- +1-315-215-1633
- sales@thebrainyinsights.com

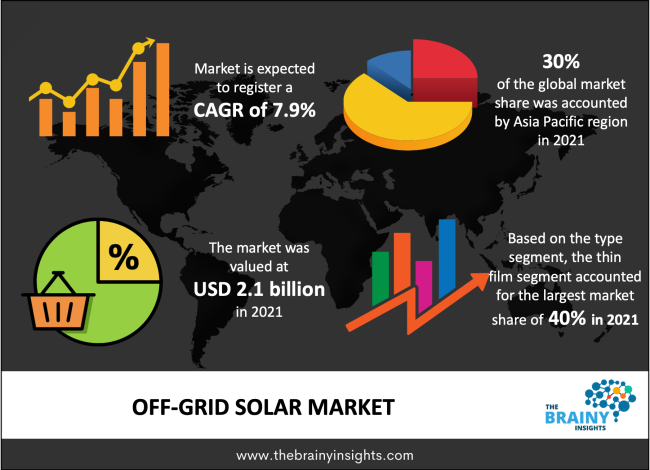
The Off-Grid Solar market was estimated at around 2.1 billion in 2021, growing at a CAGR of nearly 7.9% during 2022-2030. The market is projected to reach approximately USD 4.5 billion by 2030.
Off-grid solar options have become popular ways to expand access to renewable energy while preserving the environment. With the use of batteries that store the solar electricity produced by the system, off-grid solar systems function independently away from the electrical grid. Batteries, solar panels, inverters, and controllers are the four basic parts of an off-grid solar system. In places where the power grid is not available, these systems supply electricity for vital loads. In 2021, the U.S. overtook Canada as the region with the largest market for off-grid solar PV panels. The United States is regarded as the second largest PV panel adopter in the world because of the country's increasing PV panel usage. The country's market is anticipated to show a significant CAGR during the forecast period.
Get an overview of this study by requesting a free sample
Every day, COVID-19's effects on the global economy change. The renewable energy sector is finding it to be extremely difficult, which is leading to a shortfall of raw material supply and potential job losses. Due to a drop in electricity prices following the COVID-19 outbreak, businesses in the energy and power sector are currently facing a number of difficulties. Furthermore, China is the biggest market for the production of solar energy. Global investment in renewable energy and overall generation have been impacted by the country's economic growth slowdown.
Increasing share of solar energy sources in the global energy mix
In Sub-Saharan Africa in 2018, only about 47% of the population has access to electricity, according to World Bank statistics. Only 11% and 25% of the people in Burundi and Madagascar, two Sub-Saharan nations, have access to electricity, respectively. However, these nations' and other developing nations' demand for power has been rising recently. During the anticipated timeframe, this is probably going to help the market for solar energy grow. Statistics from IRENA show that between 2012 and 2018, the cost of installing solar energy decreased by 61%. In these developing nations, the demand for off-grid solar systems has also increased due to the lower capital requirements.
Growing adoption of off-grid solar in developing and rural areas
Simply put, the off-grid solar sector has transformed lives. For instance, Monpura in Bangladesh is growing because of solar energy. Markets are booming, homes can power TVs and refrigerators, and even the nighttime lighting of the streets. The 20 million people who live in Bangladesh are supplied with electricity using off-grid solar installations. Over 360 million individuals worldwide already have access to off-grid solar installations. Although this looks like a huge sum, it only represents 17% of the possible worldwide market. Off-grid solar systems have the potential to significantly improve the lives of the 1 billion people who do not have access to electricity as well as the additional 1 billion who have insufficient or inconsistent electricity supply.
In developing nations around the world, the World Bank Group has committed $1.3 billion for off-grid solar programs that are primarily based on solar technologies. These programs are concerned with the largest population communities, like Sub-Saharan Africa and South Asia, where homes lack access to electricity.
Off-grid solar systems are self-sufficient and supply electricity for essential loads in locations without access to a power grid. They are self-sustaining and independent of the grids, which are key elements in their dominance of the solar energy market. Produce enough energy to be stored and used at night or during power outages. act as a perfect solution for isolated places without access to the grid for power.
The off-grid solar PV panel market has been divided into thin-film, crystalline silicon, and other categories based on technology. Thin-film solar PV panels held the greatest revenue share of 40% in the global off-grid solar PV panels market in 2021 because of their compact design, high durability high durability, and use of flexible and lightweight materials during manufacturing. Due to their small weight and affordable installation, thin-film off-grid solar PV panels are often used in commercial applications.
These are frequently referred to as "thin films" due to the incredibly thin layers of the film on glass, stainless steel, or a flexible substrate. The film must have a thickness of less than one micron. To prevent damage, these cells are assembled into a module and laminated.
Due to the prolonged lifecycle of the panels, the low weight-to-volume ratio, and the inexpensive production of silicon semiconductors, the crystalline silicon segment is anticipated to experience significant growth over the course of the forecast period. High demand for crystalline silicon exceeds production capabilities, which raises prices.
During the forecast period, the residential category is anticipated to increase at the fastest rate. Commercial solar PV panels can power industrial facilities in off-grid or remote regions, pre-heat ventilation air, and heat water in offices, enterprises, and other structures. They have a lifespan of 14 to 20 years. Along with an increase in power demand in communication base stations and data centres, the quick adoption of PV modules in corporate offices, hotels, and hospitals is anticipated to stimulate product demand throughout the commercial sector.
Due to the demand for potential in renewable energy projects, investments in rural regions, and solar energy, Asia Pacific (APAC) is anticipated to hold the greatest market share of 30% throughout the projection period. The APAC market demand may be influenced by plans for electrifying rural areas and government incentives to increase solar energy use. The market may benefit from the APAC region's sustainable efforts to reduce carbon emissions and satisfy energy needs. Due to the development of clean energy technologies and expanding residential activities—as industries are the biggest consumers of electricity and employ thin films to store energy throughout maximum sunny areas—North America is anticipated to profit from the global off-grid solar PV panels market.
The global Off-Grid Solar market is segmented as follows:
By Type
By Application
By Region/Geography
| Attribute | Description |
|---|---|
| Base Year | 2021 |
| Forecast period | 2022-2030 |
| Report Coverage | Revenue estimation and forecast, company profile, competitive landscape, growth factors, and recent trends |
| Regional scope | North America, Europe, Asia Pacific, Middle East & Africa, and Latin America |
| Market Size(unit) | USD Billion |
| CAGR (2022 to 2030) | 7.9% |
| Segments Covered |
By Type |
1. Introduction
1.1. Objectives of the Study
1.2. Market Definition
1.3. Research Scope
2. Research Methodology and Assumptions
3. Executive Summary
4. Premium Insights
4.1. Porter’s Five Forces Analysis
4.2. Value Chain Analysis
4.3. Top Investment Pockets
4.3.1. Market Attractiveness Analysis By Type
4.3.2. Market Attractiveness Analysis By Application
4.4. Industry Trends
5. Market Dynamics
5.1. Market Evaluation
5.2. Drivers
5.2.1. Increasing share of solar energy sources in the global energy mix
5.3. Restraints
5.3.1. High initial investments would hamper the market
5.4. Opportunities
5.4.1. Small and medium enterprises (SMEs) switching to solar energy
6. Global Off-Grid Solar Market Analysis and Forecast, By Type
6.1. Segment Overview
6.2. Thin Film
6.3. Crystalline Silicon
6.4. Others
7. Global Off-Grid Solar Market Analysis and Forecast, By Application
7.1. Segment Overview
7.2. Residential
7.3. Commercial
7.4. Industrial
8. Global Off-Grid Solar Market Analysis and Forecast, By Regional Analysis
8.1. Segment Overview
8.2. North America
8.2.1. U.S.
8.2.2. Canada
8.2.3. Mexico
8.3. Europe
8.3.1. Germany
8.3.2. France
8.3.3. U.K.
8.3.4. Italy
8.3.5. Spain
8.3.6. Rest of Europe
8.4. Asia-Pacific
8.4.1. Japan
8.4.2. China
8.4.3. India
8.4.4. Australia
8.4.5. South Korea
8.4.6. Rest of Asia-Pacific
8.5. South America
8.5.1. Brazil
8.5.2. Argentina
8.5.3. Rest of South America
8.6. Middle East and Africa
8.6.1. UAE
8.6.2. South Africa
8.6.3. Egypt
8.6.4. Kuwait
8.6.5. Saudi Arabia
8.6.6. Rest of Middle East & Africa
9. Global Off-Grid Solar Market-Competitive Landscape
9.1. Overview
9.2. Market Share of Key Players in the Off-Grid Solar market
9.2.1. Global Company Market Share
9.2.2. North America Company Market Share
9.2.3. Europe Company Market Share
9.2.4. APAC Company Market Share
9.3. Competitive Situations and Trends
9.3.1. Type Launches and Developments
9.3.2. Partnerships, Collaborations, and Agreements
9.3.3. Mergers & Acquisitions
9.3.4. Expansions
10. Company Profiles
10.1. Jinko Solar
10.1.1. Business Overview
10.1.2. Company Snapshot
10.1.3. Company Market Share Analysis
10.1.4. Company Application Portfolio
10.1.5. Recent Developments
10.1.6. SWOT Analysis
10.2. JA Solar
10.2.1. Business Overview
10.2.2. Company Snapshot
10.2.3. Company Market Share Analysis
10.2.4. Company Application Portfolio
10.2.5. Recent Developments
10.2.6. SWOT Analysis
10.3. Trina Solar
10.3.1. Business Overview
10.3.2. Company Snapshot
10.3.3. Company Market Share Analysis
10.3.4. Company Application Portfolio
10.3.5. Recent Developments
10.3.6. SWOT Analysis
10.4. LONGi Solar
10.4.1. Business Overview
10.4.2. Company Snapshot
10.4.3. Company Market Share Analysis
10.4.4. Company Application Portfolio
10.4.5. Recent Developments
10.4.6. SWOT Analysis
10.5. Canadian Solar
10.5.1. Business Overview
10.5.2. Company Snapshot
10.5.3. Company Market Share Analysis
10.5.4. Company Application Portfolio
10.5.5. Recent Developments
10.5.6. SWOT Analysis
10.6. Sun Power Corporation
10.6.1. Business Overview
10.6.2. Company Snapshot
10.6.3. Company Market Share Analysis
10.6.4. Company Application Portfolio
10.6.5. Recent Developments
10.6.6. SWOT Analysis
10.7. First Solar
10.7.1. Business Overview
10.7.2. Company Snapshot
10.7.3. Company Market Share Analysis
10.7.4. Company Application Portfolio
10.7.5. Recent Developments
10.7.6. SWOT Analysis
10.8. Hanwha Q-Cells
10.8.1. Business Overview
10.8.2. Company Snapshot
10.8.3. Company Market Share Analysis
10.8.4. Company Application Portfolio
10.8.5. Recent Developments
10.8.6. SWOT Analysis
10.9. Risen Energy
10.9.1. Business Overview
10.9.2. Company Snapshot
10.9.3. Company Market Share Analysis
10.9.4. Company Application Portfolio
10.9.5. Recent Developments
10.9.6. SWOT Analysis
10.10. Talesun
10.10.1. Business Overview
10.10.2. Company Snapshot
10.10.3. Company Market Share Analysis
10.10.4. Company Application Portfolio
10.10.5. Recent Developments
10.10.6. SWOT Analysis
List of Table
1. Global Off-Grid Solar Market, By Type, 2022-2030(USD Billion)
2. Global Thin-Film Off-Grid Solar Market, By Region, 2022-2030(USD Billion)
3. Global Crystalline Silicon Battery Off-Grid Solar Market, By Region, 2022-2030(USD Billion)
4. Global Others Off-Grid Solar Market, By Region, 2022-2030(USD Billion)
5. Global Off-Grid Solar Market, By Application, 2022-2030(USD Billion)
6. Global Commercial Off-Grid Solar Market, By Region, 2022-2030(USD Billion)
7. Global Residential Off-Grid Solar Market, By Region, 2022-2030(USD Billion)
8. Global Industrial Off-Grid Solar Market, By Region, 2022-2030(USD Billion)
9. Global Off-Grid Solar Market, By Region, 2022-2030(USD Billion)
10. Global Off-Grid Solar Market, By North America, 2022-2030(USD Billion)
11. North America Off-Grid Solar Market, By Type, 2022-2030(USD Billion)
12. North America Off-Grid Solar Market, By Application, 2022-2030(USD Billion)
13. U.S. Off-Grid Solar Market, By Type, 2022-2030(USD Billion)
14. U.S. Off-Grid Solar Market, By Application, 2022-2030(USD Billion)
15. Canada Off-Grid Solar Market, By Type, 2022-2030(USD Billion)
16. Canada Off-Grid Solar Market, By Application, 2022-2030(USD Billion)
17. Mexico Off-Grid Solar Market, By Type, 2022-2030(USD Billion)
18. Mexico Off-Grid Solar Market, By Application, 2022-2030(USD Billion)
19. Europe Off-Grid Solar Market, By Type, 2022-2030(USD Billion)
20. Europe Off-Grid Solar Market, By Application, 2022-2030(USD Billion)
21. Germany Off-Grid Solar Market, By Type, 2022-2030(USD Billion)
22. Germany Off-Grid Solar Market, By Application, 2022-2030(USD Billion)
23. France Off-Grid Solar Market, By Type, 2022-2030(USD Billion)
24. France Off-Grid Solar Market, By Application, 2022-2030(USD Billion)
25. U.K. Off-Grid Solar Market, By Type, 2022-2030(USD Billion)
26. U.K. Off-Grid Solar Market, By Application, 2022-2030(USD Billion)
27. Italy Off-Grid Solar Market, By Type, 2022-2030(USD Billion)
28. Italy Off-Grid Solar Market, By Application, 2022-2030(USD Billion)
29. Spain Off-Grid Solar Market, By Type, 2022-2030(USD Billion)
30. Spain Off-Grid Solar Market, By Application, 2022-2030(USD Billion)
31. Rest of Europe Off-Grid Solar Market, By Type, 2022-2030(USD Billion)
32. Rest of Europe Off-Grid Solar Market, By Application, 2022-2030(USD Billion)
33. Asia Pacific Off-Grid Solar Market, By Type, 2022-2030(USD Billion)
34. Asia Pacific Off-Grid Solar Market, By Application, 2022-2030(USD Billion)
35. Japan Off-Grid Solar Market, By Type, 2022-2030(USD Billion)
36. Japan Off-Grid Solar Market, By Application, 2022-2030(USD Billion)
37. China Off-Grid Solar Market, By Type, 2022-2030(USD Billion)
38. China Off-Grid Solar Market, By Application, 2022-2030(USD Billion)
39. India Off-Grid Solar Market, By Type, 2022-2030(USD Billion)
40. India Off-Grid Solar Market, By Application, 2022-2030(USD Billion)
41. Australia Off-Grid Solar Market, By Type, 2022-2030(USD Billion)
42. Australia Off-Grid Solar Market, By Application, 2022-2030(USD Billion)
43. South Korea Off-Grid Solar Market, By Type, 2022-2030(USD Billion)
44. South Korea Off-Grid Solar Market, By Application, 2022-2030(USD Billion)
45. Rest of Asia-Pacific Off-Grid Solar Market, By Type, 2022-2030(USD Billion)
46. Rest of Asia-Pacific Off-Grid Solar Market, By Application, 2022-2030(USD Billion)
47. South America Off-Grid Solar Market, By Type, 2022-2030(USD Billion)
48. South America Off-Grid Solar Market, By Application, 2022-2030(USD Billion)
49. Brazil Off-Grid Solar Market, By Type, 2022-2030(USD Billion)
50. Brazil Off-Grid Solar Market, By Application, 2022-2030(USD Billion)
51. Argentina Off-Grid Solar Market, By Type, 2022-2030(USD Billion)
52. Argentina Off-Grid Solar Market, By Application, 2022-2030(USD Billion)
53. Rest of Latin America Off-Grid Solar Market, By Type, 2022-2030(USD Billion)
54. Rest of Latin America Off-Grid Solar Market, By Application, 2022-2030(USD Billion)
55. Middle East and Africa Off-Grid Solar Market, By Type, 2022-2030(USD Billion)
56. Middle East and Africa Off-Grid Solar Market, By Application, 2022-2030(USD Billion)
57. UAE Off-Grid Solar Market, By Type, 2022-2030(USD Billion)
58. UAE Off-Grid Solar Market, By Application, 2022-2030(USD Billion)
59. South Africa Off-Grid Solar Market, By Type, 2022-2030(USD Billion)
60. South Africa Off-Grid Solar Market, By Application, 2022-2030(USD Billion)
61. Egypt Off-Grid Solar Market, By Type, 2022-2030(USD Billion)
62. Egypt Off-Grid Solar Market, By Application, 2022-2030(USD Billion)
63. Kuwait Off-Grid Solar Market, By Type, 2022-2030(USD Billion)
64. Kuwait Off-Grid Solar Market, By Application, 2022-2030(USD Billion)
65. Saudi Arabia Off-Grid Solar Market, By Type, 2022-2030(USD Billion)
66. Saudi Arabia Off-Grid Solar Market, By Application, 2022-2030(USD Billion)
67. Rest of Middle East Off-Grid Solar Market, By Type, 2022-2030(USD Billion)
68. Rest of Middle East Off-Grid Solar Market, By Application, 2022-2030(USD Billion)
List of Figures
1. Global Off-Grid Solar Market Segmentation
2. Off-Grid Solar Market: Research Methodology
3. Market Size Estimation Methodology: Bottom-Up Approach
4. Market Size Estimation Methodology: Top-Down Approach
5. Data Triangulation
6. Porter’s Five Forces Analysis
7. Value Chain Analysis
8. Global Off-Grid Solar Market Attractiveness Analysis By Type
9. Global Off-Grid Solar Market Attractiveness Analysis By Application
10. Global Off-Grid Solar Market Attractiveness Analysis By Region
11. Global Off-Grid Solar Market: Dynamics
12. Global Off-Grid Solar Market Share By Type(2022 & 2030)
13. Global Off-Grid Solar Market Share By Application(2022 & 2030)
14. Global Off-Grid Solar Market Share by Regions (2022 & 2030)
15. Global Off-Grid Solar Market Share by Company (2021)
By Type
By Application
By Region/Geography
Research has its special purpose to undertake marketing efficiently. In this competitive scenario, businesses need information across all industry verticals; the information about customer wants, market demand, competition, industry trends, distribution channels etc. This information needs to be updated regularly because businesses operate in a dynamic environment. Our organization, The Brainy Insights incorporates scientific and systematic research procedures in order to get proper market insights and industry analysis for overall business success. The analysis consists of studying the market from a miniscule level wherein we implement statistical tools which helps us in examining the data with accuracy and precision.
Our research reports feature both; quantitative and qualitative aspects for any market. Qualitative information for any market research process are fundamental because they reveal the customer needs and wants, usage and consumption for any product/service related to a specific industry. This in turn aids the marketers/investors in knowing certain perceptions of the customers. Qualitative research can enlighten about the different product concepts and designs along with unique service offering that in turn, helps define marketing problems and generate opportunities. On the other hand, quantitative research engages with the data collection process through interviews, e-mail interactions, surveys and pilot studies. Quantitative aspects for the market research are useful to validate the hypotheses generated during qualitative research method, explore empirical patterns in the data with the help of statistical tools, and finally make the market estimations.
The Brainy Insights offers comprehensive research and analysis, based on a wide assortment of factual insights gained through interviews with CXOs and global experts and secondary data from reliable sources. Our analysts and industry specialist assume vital roles in building up statistical tools and analysis models, which are used to analyse the data and arrive at accurate insights with exceedingly informative research discoveries. The data provided by our organization have proven precious to a diverse range of companies, facilitating them to address issues such as determining which products/services are the most appealing, whether or not customers use the product in the manner anticipated, the purchasing intentions of the market and many others.
Our research methodology encompasses an idyllic combination of primary and secondary initiatives. Key phases involved in this process are listed below:

The phase involves the gathering and collecting of market data and its related information with the help of different sources & research procedures.

The data procurement stage involves in data gathering and collecting through various data sources.
This stage involves in extensive research. These data sources includes:
Purchased Database: Purchased databases play a crucial role in estimating the market sizes irrespective of the domain. Our purchased database includes:
Primary Research: The Brainy Insights interacts with leading companies and experts of the concerned domain to develop the analyst team’s market understanding and expertise. It improves and substantiates every single data presented in the market reports. Primary research mainly involves in telephonic interviews, E-mail interactions and face-to-face interviews with the raw material providers, manufacturers/producers, distributors, & independent consultants. The interviews that we conduct provides valuable data on market size and industry growth trends prevailing in the market. Our organization also conducts surveys with the various industry experts in order to gain overall insights of the industry/market. For instance, in healthcare industry we conduct surveys with the pharmacists, doctors, surgeons and nurses in order to gain insights and key information of a medical product/device/equipment which the customers are going to usage. Surveys are conducted in the form of questionnaire designed by our own analyst team. Surveys plays an important role in primary research because surveys helps us to identify the key target audiences of the market. Additionally, surveys helps to identify the key target audience engaged with the market. Our survey team conducts the survey by targeting the key audience, thus gaining insights from them. Based on the perspectives of the customers, this information is utilized to formulate market strategies. Moreover, market surveys helps us to understand the current competitive situation of the industry. To be precise, our survey process typically involve with the 360 analysis of the market. This analytical process begins by identifying the prospective customers for a product or service related to the market/industry to obtain data on how a product/service could fit into customers’ lives.

Secondary Research: The secondary data sources includes information published by the on-profit organizations such as World bank, WHO, company fillings, investor presentations, annual reports, national government documents, statistical databases, blogs, articles, white papers and others. From the annual report, we analyse a company’s revenue to understand the key segment and market share of that organization in a particular region. We analyse the company websites and adopt the product mapping technique which is important for deriving the segment revenue. In the product mapping method, we select and categorize the products offered by the companies catering to domain specific market, deduce the product revenue for each of the companies so as to get overall estimation of the market size. We also source data and analyses trends based on information received from supply side and demand side intermediaries in the value chain. The supply side denotes the data gathered from supplier, distributor, wholesaler and the demand side illustrates the data gathered from the end customers for respective market domain.

The supply side for a domain specific market is analysed by:
The demand side for the market is estimated through:
In-house Library: Apart from these third-party sources, we have our in-house library of qualitative and quantitative information. Our in-house database includes market data for various industry and domains. These data are updated on regular basis as per the changing market scenario. Our library includes, historic databases, internal audit reports and archives.
Sometimes there are instances where there is no metadata or raw data available for any domain specific market. For those cases, we use our expertise to forecast and estimate the market size in order to generate comprehensive data sets. Our analyst team adopt a robust research technique in order to produce the estimates:
Data Synthesis: This stage involves the analysis & mapping of all the information obtained from the previous step. It also involves in scrutinizing the data for any discrepancy observed while data gathering related to the market. The data is collected with consideration to the heterogeneity of sources. Robust scientific techniques are in place for synthesizing disparate data sets and provide the essential contextual information that can orient market strategies. The Brainy Insights has extensive experience in data synthesis where the data passes through various stages:


Market Deduction & Formulation: The final stage comprises of assigning data points at appropriate market spaces so as to deduce feasible conclusions. Analyst perspective & subject matter expert based holistic form of market sizing coupled with industry analysis also plays a crucial role in this stage.
This stage involves in finalization of the market size and numbers that we have collected from data integration step. With data interpolation, it is made sure that there is no gap in the market data. Successful trend analysis is done by our analysts using extrapolation techniques, which provide the best possible forecasts for the market.
Data Validation & Market Feedback: Validation is the most important step in the process. Validation & re-validation via an intricately designed process helps us finalize data-points to be used for final calculations.

The Brainy Insights interacts with leading companies and experts of the concerned domain to develop the analyst team’s market understanding and expertise. It improves and substantiates every single data presented in the market reports. The data validation interview and discussion panels are typically composed of the most experienced industry members. The participants include, however, are not limited to:
Moreover, we always validate our data and findings through primary respondents from all the major regions we are working on.


Free Customization
Fortune 500 Clients
Free Yearly Update On Purchase Of Multi/Corporate License
Companies Served Till Date