- +1-315-215-1633
- sales@thebrainyinsights.com

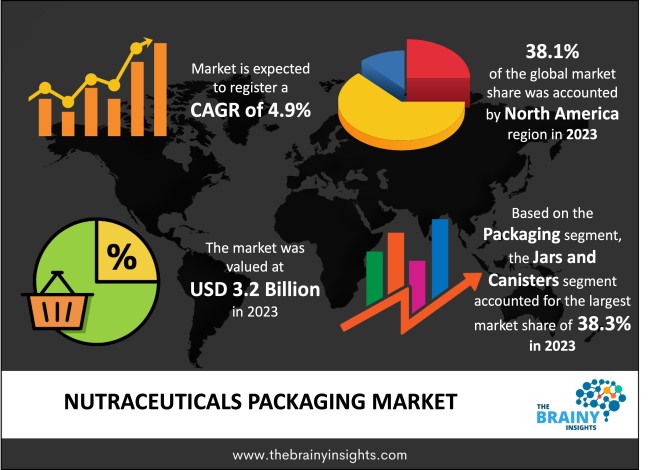
The Nutraceuticals Packaging Market was valued at USD 3.2 billion in 2023 and grew at a CAGR of 4.9% from 2024 to 2033. The requirement for particular packaging that guarantees the integrity of the product and safety has been pushed by the increasing demand from customers for wellness and health goods, which is responsible for the market's expansion globally. Additionally, longer shelf lives and higher-quality products have been made possible by developments in packaging technology, such as active and innovative packaging. The nutraceutical packaging sector has grown as a result of these causes as well as growing consumer knowledge of the advantages of nutraceutical products.
Sensitive chemicals used in nutraceutical goods frequently deteriorate when exposed to light, air, moisture, or temperature changes. Packaging keeps these goods safe from the elements, preserving their effectiveness and shelf life. Additionally, whether handling, storing, and traveling, nutraceutical items are kept safe and intact thanks to proper packaging. It protects consumer health by preventing contamination, manipulation, and deterioration.
Get an overview of this study by requesting a free sample
The market for nutraceutical goods is being driven by rising consumer interest and awareness of health and wellness. In order to maintain product efficacy and purity, consumers are looking for functional foods, beverages, and supplements with additional health advantages. This has created a demand for creative packaging solutions. Additionally, as the world's population ages, there is a rising need for nutraceutical goods that support healthy aging, treat chronic illnesses, and improve general wellbeing. Delivery of these goods securely and effectively depends heavily on packing, particularly for senior consumers who might have particular demands or preferences in terms of packaging.
Manufacturers of nutraceuticals and packaging suppliers face compliance challenges due to strict laws controlling labeling, safety, and quality assurance. Complying with regulatory regulations may include expensive certification, testing, and documentation procedures, raising production costs and preventing certain players from entering certain markets. Additionally, higher packaging costs may result from the use of specialist materials, technologies, and design elements to satisfy the particular needs of nutraceutical products. Manufacturers in price-sensitive market segments could find it difficult to strike a balance between the necessity for high-quality packaging solutions and cost-effectiveness.
Packaging makers have a chance to create and market environmentally friendly packaging solutions for nutraceutical products as the focus on environmental sustainability grows. This covers packaging choices that are recyclable, compostable, and made of biodegradable materials in line with customer preferences for environmentally friendly packaging. Additionally, technological innovations like smart packaging systems, active packaging systems, and package materials based on nanotechnology present chances to boost customer interaction, increase shelf life, and preserve products better. Packaging that incorporates technologies such as RFID tags, QR codes, and sensors allows for consumer interaction, traceability, and authentication.
North America led the market in 2023 with the largest market share of 38.1%. Demand for creative packaging solutions that improve sustainability, convenience, and usefulness is rising. Packaging makers have the chance to create and launch innovative packaging forms that are specifically suited for the North American nutraceutical market, like resealable pouches, single-serving sachets, and eco-friendly materials. Additionally, as customers place a higher value on health and wellbeing, nutraceutical firms have a chance to stand out from the competition by using high-end packaging materials and designs. Unique shapes, textures, and finishes, together with opulent packaging alternatives, can make businesses stand out on store shelves and attract discerning customers looking for premium goods.
North America Region Nutraceuticals Packaging Market Share in 2023 - 38.1%
www.thebrainyinsights.com
Check the geographical analysis of this market by requesting a free sample
The Jars and canisters segment dominated the global market in 2023 with a market share of 38.3%. Nutraceutical products are well-protected from air, light, and moisture by jars and canisters, maintaining their effectiveness and integrity. For delicate components in particular, there are opportunities to innovate with barrier materials and sealing technologies to guarantee product freshness and shelf life. Additionally, distinctive canister and jar designs provide nutraceutical brands a chance to stand out on retail shelves. Customized labels, sizes, forms, and colors can improve customer appeal and brand awareness, making products stand out in a crowded market.
The functional beverages segment dominated the global market in 2023 with a market share of 31.9%. Functional beverages frequently have delicate ingredients that need to be packaged carefully to preserve the efficacy and purity of the final product. There are opportunities to develop novel barrier materials, such laminates and coatings, to shield drinks from light, air, and moisture while maintaining their nutritional value and shelf life. Additionally, consumers looking for portable and handy wellness solutions are catered to by functional beverages. Innovative packaging designs, like single-serve bottles, pouches, and cans with resealable closures, can improve usability and convenience for consumers so they can have functional beverages anywhere, at any time.
The Liquid segment dominated the global market in 2023 with a market share of 28.7%. Active substances used in functional beverages frequently need to be packaged specifically to ensure their stability and effectiveness. Packaging types including PET bottles, glass bottles, cartons, and pouches offer a chance to innovate by incorporating features like oxygen barriers, tamper-evident seals, and resealable closures to guarantee product integrity and shelf stability. Additionally, consumers of functional beverages frequently have hectic schedules and look for quick and portable solutions. Single-serve bottles, pouches, and cans are examples of packaging options that are convenient and portable, meeting consumer demands for rapid and simple consumption without sacrificing product quality.
| Attribute | Description |
|---|---|
| Market Size | Revenue (USD Billion) |
| Market size value in 2023 | USD 3.2 Billion |
| Market size value in 2033 | USD 5.1 Billion |
| CAGR (2024 to 2033) | 4.9% |
| Historical data | 2020-2022 |
| Base Year | 2023 |
| Forecast | 2024-2033 |
| Region | The regions analyzed for the market are Asia Pacific, Europe, South America, North America, and Middle East & Africa. Furthermore, the regions are further analyzed at the country level. |
| Segments | Packaging, Product, Form |
As per The Brainy Insights, the size of the nutraceuticals packaging market was valued at USD 3.2 billion in 2023 to USD 5.1 billion by 2033.
The global nutraceuticals packaging market is growing at a CAGR of 4.9% during the forecast period 2024-2033.
The North America region emerged as the largest market for the Nutraceuticals Packaging.
The growing health consciousness will influence the market's growth.
1. Introduction
1.1. Objectives of the Study
1.2. Market Definition
1.3. Research Scope
1.4. Currency
1.5. Key Target Audience
2. Research Methodology and Assumptions
3. Executive Summary
4. Premium Insights
4.1. Porter’s Five Forces Analysis
4.2. Value Chain Analysis
4.3. Top Investment Pockets
4.3.1. Market Attractiveness Analysis by Packaging
4.3.2. Market Attractiveness Analysis by Product
4.3.3. Market Attractiveness Analysis by Form
4.3.4. Market Attractiveness Analysis by Region
4.4. Industry Trends
5. Market Dynamics
5.1. Market Evaluation
5.2. Drivers
5.2.1. Growing Health Consciousness
5.3. Restraints
5.3.1. Cost Concerns
5.4. Opportunities
5.4.1. Expansion in Emerging Markets
5.5. Challenges
5.5.1. Environmental Concerns
6. Global Nutraceuticals Packaging Market Analysis and Forecast, By Packaging
6.1. Segment Overview
6.2. Blisters & Strips
6.3. Bottles
6.4. Jars & Canisters
6.5. Bags & Pouches
6.6. Stick Packs
6.7. Boxes & Cartons
6.8. Caps & Closures
6.9. Others
7. Global Nutraceuticals Packaging Market Analysis and Forecast, By Product
7.1. Segment Overview
7.2. Dietary Supplements
7.3. Functional Foods
7.4. Functional Beverages
7.5. Others
8. Global Nutraceuticals Packaging Market Analysis and Forecast, By Form
8.1. Segment Overview
8.2. Tablets & Capsules
8.3. Powder & Granules
8.4. Liquid
8.5. Solid & Soft Gel
9. Global Nutraceuticals Packaging Market Analysis and Forecast, By Regional Analysis
9.1. Segment Overview
9.2. North America
9.2.1. U.S.
9.2.2. Canada
9.2.3. Mexico
9.3. Europe
9.3.1. Germany
9.3.2. France
9.3.3. U.K.
9.3.4. Italy
9.3.5. Spain
9.4. Asia-Pacific
9.4.1. Japan
9.4.2. China
9.4.3. India
9.5. South America
9.5.1. Brazil
9.6. Middle East and Africa
9.6.1. UAE
9.6.2. South Africa
10. Global Nutraceuticals Packaging Market-Competitive Landscape
10.1. Overview
10.2. Market Share of Key Players in the Nutraceuticals Packaging Market
10.2.1. Global Company Market Share
10.2.2. North America Company Market Share
10.2.3. Europe Company Market Share
10.2.4. APAC Company Market Share
10.3. Competitive Situations and Trends
10.3.1. Product Launches and Developments
10.3.2. Partnerships, Collaborations, and Agreements
10.3.3. Mergers & Acquisitions
10.3.4. Expansions
11. Company Profiles
11.1. Glenroy, Inc.
11.1.1. Business Overview
11.1.2. Company Snapshot
11.1.3. Company Market Share Analysis
11.1.4. Company Product Portfolio
11.1.5. Recent Developments
11.1.6. SWOT Analysis
11.2. Berry Global Inc.
11.2.1. Business Overview
11.2.2. Company Snapshot
11.2.3. Company Market Share Analysis
11.2.4. Company Product Portfolio
11.2.5. Recent Developments
11.2.6. SWOT Analysis
11.3. MOD-PAC Corporation
11.3.1. Business Overview
11.3.2. Company Snapshot
11.3.3. Company Market Share Analysis
11.3.4. Company Product Portfolio
11.3.5. Recent Developments
11.3.6. SWOT Analysis
11.4. MJS Packaging
11.4.1. Business Overview
11.4.2. Company Snapshot
11.4.3. Company Market Share Analysis
11.4.4. Company Product Portfolio
11.4.5. Recent Developments
11.4.6. SWOT Analysis
11.5. JohnsByrne Company
11.5.1. Business Overview
11.5.2. Company Snapshot
11.5.3. Company Market Share Analysis
11.5.4. Company Product Portfolio
11.5.5. Recent Developments
11.5.6. SWOT Analysis
11.6. Amcor PLC
11.6.1. Business Overview
11.6.2. Company Snapshot
11.6.3. Company Market Share Analysis
11.6.4. Company Product Portfolio
11.6.5. Recent Developments
11.6.6. SWOT Analysis
11.7. Amgraph Packaging, Inc.
11.7.1. Business Overview
11.7.2. Company Snapshot
11.7.3. Company Market Share Analysis
11.7.4. Company Product Portfolio
11.7.5. Recent Developments
11.7.6. SWOT Analysis
11.8. Birchwood Contract Manufacturing
11.8.1. Business Overview
11.8.2. Company Snapshot
11.8.3. Company Market Share Analysis
11.8.4. Company Product Portfolio
11.8.5. Recent Developments
11.8.6. SWOT Analysis
11.9. Syntegon Packaging Technology GmbH
11.9.1. Business Overview
11.9.2. Company Snapshot
11.9.3. Company Market Share Analysis
11.9.4. Company Product Portfolio
11.9.5. Recent Developments
11.9.6. SWOT Analysis
11.10. Comar Packaging Solutions
11.10.1. Business Overview
11.10.2. Company Snapshot
11.10.3. Company Market Share Analysis
11.10.4. Company Product Portfolio
11.10.5. Recent Developments
11.10.6. SWOT Analysis
List of Table
1. Global Nutraceuticals Packaging Market, By Packaging, 2020-2033 (USD Billion)
2. Global Blisters & Strips, Nutraceuticals Packaging Market, By Region, 2020-2033 (USD Billion)
3. Global Bottles, Nutraceuticals Packaging Market, By Region, 2020-2033 (USD Billion)
4. Global Jars & Canisters, Nutraceuticals Packaging Market, By Region, 2020-2033 (USD Billion)
5. Global Bags & Pouches, Nutraceuticals Packaging Market, By Region, 2020-2033 (USD Billion)
6. Global Stick Packs, Nutraceuticals Packaging Market, By Region, 2020-2033 (USD Billion)
7. Global Boxes & Cartons, Nutraceuticals Packaging Market, By Region, 2020-2033 (USD Billion)
8. Global Caps & Closures, Nutraceuticals Packaging Market, By Region, 2020-2033 (USD Billion)
9. Global Others, Nutraceuticals Packaging Market, By Region, 2020-2033 (USD Billion)
10. Global Nutraceuticals Packaging Market, By Product, 2020-2033 (USD Billion)
11. Global Dietary Supplements, Nutraceuticals Packaging Market, By Region, 2020-2033 (USD Billion)
12. Global Functional Foods, Nutraceuticals Packaging Market, By Region, 2020-2033 (USD Billion)
13. Global Functional Beverages, Nutraceuticals Packaging Market, By Region, 2020-2033 (USD Billion)
14. Global Others, Nutraceuticals Packaging Market, By Region, 2020-2033 (USD Billion)
15. Global Nutraceuticals Packaging Market, By Form, 2020-2033 (USD Billion)
16. Global Tablets & Capsules, Nutraceuticals Packaging Market, By Region, 2020-2033 (USD Billion)
17. Global Powder & Granules, Nutraceuticals Packaging Market, By Region, 2020-2033 (USD Billion)
18. Global Liquid, Nutraceuticals Packaging Market, By Region, 2020-2033 (USD Billion)
19. Global Solid & Soft Gel, Nutraceuticals Packaging Market, By Region, 2020-2033 (USD Billion)
20. Global Nutraceuticals Packaging Market, By Region, 2020-2033 (USD Billion)
21. North America Nutraceuticals Packaging Market, By Packaging, 2020-2033 (USD Billion)
22. North America Nutraceuticals Packaging Market, By Product, 2020-2033 (USD Billion)
23. North America Nutraceuticals Packaging Market, By Form, 2020-2033 (USD Billion)
24. U.S. Nutraceuticals Packaging Market, By Packaging, 2020-2033 (USD Billion)
25. U.S. Nutraceuticals Packaging Market, By Product, 2020-2033 (USD Billion)
26. U.S. Nutraceuticals Packaging Market, By Form, 2020-2033 (USD Billion)
27. Canada Nutraceuticals Packaging Market, By Packaging, 2020-2033 (USD Billion)
28. Canada Nutraceuticals Packaging Market, By Product, 2020-2033 (USD Billion)
29. Canada Nutraceuticals Packaging Market, By Form, 2020-2033 (USD Billion)
30. Mexico Nutraceuticals Packaging Market, By Packaging, 2020-2033 (USD Billion)
31. Mexico Nutraceuticals Packaging Market, By Product, 2020-2033 (USD Billion)
32. Mexico Nutraceuticals Packaging Market, By Form, 2020-2033 (USD Billion)
33. Europe Nutraceuticals Packaging Market, By Packaging, 2020-2033 (USD Billion)
34. Europe Nutraceuticals Packaging Market, By Product, 2020-2033 (USD Billion)
35. Europe Nutraceuticals Packaging Market, By Form, 2020-2033 (USD Billion)
36. Germany Nutraceuticals Packaging Market, By Packaging, 2020-2033 (USD Billion)
37. Germany Nutraceuticals Packaging Market, By Product, 2020-2033 (USD Billion)
38. Germany Nutraceuticals Packaging Market, By Form, 2020-2033 (USD Billion)
39. France Nutraceuticals Packaging Market, By Packaging, 2020-2033 (USD Billion)
40. France Nutraceuticals Packaging Market, By Product, 2020-2033 (USD Billion)
41. France Nutraceuticals Packaging Market, By Form, 2020-2033 (USD Billion)
42. U.K. Nutraceuticals Packaging Market, By Packaging, 2020-2033 (USD Billion)
43. U.K. Nutraceuticals Packaging Market, By Product, 2020-2033 (USD Billion)
44. U.K. Nutraceuticals Packaging Market, By Form, 2020-2033 (USD Billion)
45. Italy Nutraceuticals Packaging Market, By Packaging, 2020-2033 (USD Billion)
46. Italy Nutraceuticals Packaging Market, By Product, 2020-2033 (USD Billion)
47. Italy Nutraceuticals Packaging Market, By Form, 2020-2033 (USD Billion)
48. Spain Nutraceuticals Packaging Market, By Packaging, 2020-2033 (USD Billion)
49. Spain Nutraceuticals Packaging Market, By Product, 2020-2033 (USD Billion)
50. Spain Nutraceuticals Packaging Market, By Form, 2020-2033 (USD Billion)
51. Asia Pacific Nutraceuticals Packaging Market, By Packaging, 2020-2033 (USD Billion)
52. Asia Pacific Nutraceuticals Packaging Market, By Product, 2020-2033 (USD Billion)
53. Asia Pacific Nutraceuticals Packaging Market, By Form, 2020-2033 (USD Billion)
54. Japan Nutraceuticals Packaging Market, By Packaging, 2020-2033 (USD Billion)
55. Japan Nutraceuticals Packaging Market, By Product, 2020-2033 (USD Billion)
56. Japan Nutraceuticals Packaging Market, By Form, 2020-2033 (USD Billion)
57. China Nutraceuticals Packaging Market, By Packaging, 2020-2033 (USD Billion)
58. China Nutraceuticals Packaging Market, By Product, 2020-2033 (USD Billion)
59. China Nutraceuticals Packaging Market, By Form, 2020-2033 (USD Billion)
60. India Nutraceuticals Packaging Market, By Packaging, 2020-2033 (USD Billion)
61. India Nutraceuticals Packaging Market, By Product, 2020-2033 (USD Billion)
62. India Nutraceuticals Packaging Market, By Form, 2020-2033 (USD Billion)
63. South America Nutraceuticals Packaging Market, By Packaging, 2020-2033 (USD Billion)
64. South America Nutraceuticals Packaging Market, By Product, 2020-2033 (USD Billion)
65. South America Nutraceuticals Packaging Market, By Form, 2020-2033 (USD Billion)
66. Brazil Nutraceuticals Packaging Market, By Packaging, 2020-2033 (USD Billion)
67. Brazil Nutraceuticals Packaging Market, By Product, 2020-2033 (USD Billion)
68. Brazil Nutraceuticals Packaging Market, By Form, 2020-2033 (USD Billion)
69. Middle East and Africa Nutraceuticals Packaging Market, By Packaging, 2020-2033 (USD Billion)
70. Middle East and Africa Nutraceuticals Packaging Market, By Product, 2020-2033 (USD Billion)
71. Middle East and Africa Nutraceuticals Packaging Market, By Form, 2020-2033 (USD Billion)
72. UAE Nutraceuticals Packaging Market, By Packaging, 2020-2033 (USD Billion)
73. UAE Nutraceuticals Packaging Market, By Product, 2020-2033 (USD Billion)
74. UAE Nutraceuticals Packaging Market, By Form, 2020-2033 (USD Billion)
75. South Africa Nutraceuticals Packaging Market, By Packaging, 2020-2033 (USD Billion)
76. South Africa Nutraceuticals Packaging Market, By Product, 2020-2033 (USD Billion)
77. South Africa Nutraceuticals Packaging Market, By Form, 2020-2033 (USD Billion)
List of Figures
1. Global Nutraceuticals Packaging Market Segmentation
2. Nutraceuticals Packaging Market: Research Methodology
3. Market Size Estimation Methodology: Bottom-Up Approach
4. Market Size Estimation Methodology: Top-Down Approach
5. Data Triangulation
6. Porter’s Five Forces Analysis
7. Value Chain Analysis
8. Global Nutraceuticals Packaging Market Attractiveness Analysis by Packaging
9. Global Nutraceuticals Packaging Market Attractiveness Analysis by Product
10. Global Nutraceuticals Packaging Market Attractiveness Analysis by Form
11. Global Nutraceuticals Packaging Market Attractiveness Analysis by Region
12. Global Nutraceuticals Packaging Market: Dynamics
13. Global Nutraceuticals Packaging Market Share by Packaging (2023 & 2033)
14. Global Nutraceuticals Packaging Market Share by Product (2023 & 2033)
15. Global Nutraceuticals Packaging Market Share by Form (2023 & 2033)
16. Global Nutraceuticals Packaging Market Share by Regions (2023 & 2033)
17. Global Nutraceuticals Packaging Market Share by Company (2023)
This study forecasts revenue at global, regional, and country levels from 2020 to 2033. The Brainy Insights has segmented the global nutraceuticals packaging market based on below-mentioned segments:
Global Nutraceuticals Packaging Market by Packaging:
Global Nutraceuticals Packaging Market by Product:
Global Nutraceuticals Packaging Market by Form:
Global Nutraceuticals Packaging Market by Region:
Research has its special purpose to undertake marketing efficiently. In this competitive scenario, businesses need information across all industry verticals; the information about customer wants, market demand, competition, industry trends, distribution channels etc. This information needs to be updated regularly because businesses operate in a dynamic environment. Our organization, The Brainy Insights incorporates scientific and systematic research procedures in order to get proper market insights and industry analysis for overall business success. The analysis consists of studying the market from a miniscule level wherein we implement statistical tools which helps us in examining the data with accuracy and precision.
Our research reports feature both; quantitative and qualitative aspects for any market. Qualitative information for any market research process are fundamental because they reveal the customer needs and wants, usage and consumption for any product/service related to a specific industry. This in turn aids the marketers/investors in knowing certain perceptions of the customers. Qualitative research can enlighten about the different product concepts and designs along with unique service offering that in turn, helps define marketing problems and generate opportunities. On the other hand, quantitative research engages with the data collection process through interviews, e-mail interactions, surveys and pilot studies. Quantitative aspects for the market research are useful to validate the hypotheses generated during qualitative research method, explore empirical patterns in the data with the help of statistical tools, and finally make the market estimations.
The Brainy Insights offers comprehensive research and analysis, based on a wide assortment of factual insights gained through interviews with CXOs and global experts and secondary data from reliable sources. Our analysts and industry specialist assume vital roles in building up statistical tools and analysis models, which are used to analyse the data and arrive at accurate insights with exceedingly informative research discoveries. The data provided by our organization have proven precious to a diverse range of companies, facilitating them to address issues such as determining which products/services are the most appealing, whether or not customers use the product in the manner anticipated, the purchasing intentions of the market and many others.
Our research methodology encompasses an idyllic combination of primary and secondary initiatives. Key phases involved in this process are listed below:

The phase involves the gathering and collecting of market data and its related information with the help of different sources & research procedures.

The data procurement stage involves in data gathering and collecting through various data sources.
This stage involves in extensive research. These data sources includes:
Purchased Database: Purchased databases play a crucial role in estimating the market sizes irrespective of the domain. Our purchased database includes:
Primary Research: The Brainy Insights interacts with leading companies and experts of the concerned domain to develop the analyst team’s market understanding and expertise. It improves and substantiates every single data presented in the market reports. Primary research mainly involves in telephonic interviews, E-mail interactions and face-to-face interviews with the raw material providers, manufacturers/producers, distributors, & independent consultants. The interviews that we conduct provides valuable data on market size and industry growth trends prevailing in the market. Our organization also conducts surveys with the various industry experts in order to gain overall insights of the industry/market. For instance, in healthcare industry we conduct surveys with the pharmacists, doctors, surgeons and nurses in order to gain insights and key information of a medical product/device/equipment which the customers are going to usage. Surveys are conducted in the form of questionnaire designed by our own analyst team. Surveys plays an important role in primary research because surveys helps us to identify the key target audiences of the market. Additionally, surveys helps to identify the key target audience engaged with the market. Our survey team conducts the survey by targeting the key audience, thus gaining insights from them. Based on the perspectives of the customers, this information is utilized to formulate market strategies. Moreover, market surveys helps us to understand the current competitive situation of the industry. To be precise, our survey process typically involve with the 360 analysis of the market. This analytical process begins by identifying the prospective customers for a product or service related to the market/industry to obtain data on how a product/service could fit into customers’ lives.

Secondary Research: The secondary data sources includes information published by the on-profit organizations such as World bank, WHO, company fillings, investor presentations, annual reports, national government documents, statistical databases, blogs, articles, white papers and others. From the annual report, we analyse a company’s revenue to understand the key segment and market share of that organization in a particular region. We analyse the company websites and adopt the product mapping technique which is important for deriving the segment revenue. In the product mapping method, we select and categorize the products offered by the companies catering to domain specific market, deduce the product revenue for each of the companies so as to get overall estimation of the market size. We also source data and analyses trends based on information received from supply side and demand side intermediaries in the value chain. The supply side denotes the data gathered from supplier, distributor, wholesaler and the demand side illustrates the data gathered from the end customers for respective market domain.

The supply side for a domain specific market is analysed by:
The demand side for the market is estimated through:
In-house Library: Apart from these third-party sources, we have our in-house library of qualitative and quantitative information. Our in-house database includes market data for various industry and domains. These data are updated on regular basis as per the changing market scenario. Our library includes, historic databases, internal audit reports and archives.
Sometimes there are instances where there is no metadata or raw data available for any domain specific market. For those cases, we use our expertise to forecast and estimate the market size in order to generate comprehensive data sets. Our analyst team adopt a robust research technique in order to produce the estimates:
Data Synthesis: This stage involves the analysis & mapping of all the information obtained from the previous step. It also involves in scrutinizing the data for any discrepancy observed while data gathering related to the market. The data is collected with consideration to the heterogeneity of sources. Robust scientific techniques are in place for synthesizing disparate data sets and provide the essential contextual information that can orient market strategies. The Brainy Insights has extensive experience in data synthesis where the data passes through various stages:


Market Deduction & Formulation: The final stage comprises of assigning data points at appropriate market spaces so as to deduce feasible conclusions. Analyst perspective & subject matter expert based holistic form of market sizing coupled with industry analysis also plays a crucial role in this stage.
This stage involves in finalization of the market size and numbers that we have collected from data integration step. With data interpolation, it is made sure that there is no gap in the market data. Successful trend analysis is done by our analysts using extrapolation techniques, which provide the best possible forecasts for the market.
Data Validation & Market Feedback: Validation is the most important step in the process. Validation & re-validation via an intricately designed process helps us finalize data-points to be used for final calculations.

The Brainy Insights interacts with leading companies and experts of the concerned domain to develop the analyst team’s market understanding and expertise. It improves and substantiates every single data presented in the market reports. The data validation interview and discussion panels are typically composed of the most experienced industry members. The participants include, however, are not limited to:
Moreover, we always validate our data and findings through primary respondents from all the major regions we are working on.


Free Customization
Fortune 500 Clients
Free Yearly Update On Purchase Of Multi/Corporate License
Companies Served Till Date