- +1-315-215-1633
- sales@thebrainyinsights.com

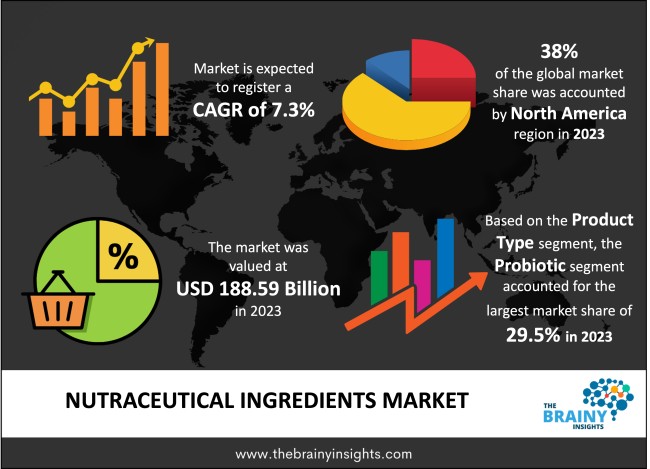
The global nutraceutical ingredients market was valued at USD 188.59 billion in 2023. The global nutraceutical ingredients market is expected to reach USD 381.51 billion by 2033 at a CAGR of 7.3% from 2024 to 2033. The North America is expected to grow the fastest during the forecast period. The demand for nutraceuticals ingredients has been increasing owing to the factors such as rising awareness regarding health & wellness among consumers. Furthermore, the increasing demand for fortified food products propels the market's growth. The rising incidences of chronic diseases worldwide also drive the market's growth. On the other hand, the increasing mandates on food fortification by government organizations will bode well for the market. The market is further growing owing to consumers' increasing demand for nutraceutical products such as prebiotics, probiotics, and vitamins.
Bioactive compounds called nutraceutical ingredients are obtained from natural sources such as plants, animals and microorganisms. These components provide several health advantages when incorporated into a balanced diet or consumed as dietary supplements. Nutrients like vitamins, minerals, amino acids, fatty acids, and dietary fibres can be found in these substances, which have antioxidant capabilities and anti-inflammatory properties, among other therapeutic benefits. Nutraceuticals such as probiotics (live bacteria), polyphenols (micronutrients), and omega-3 fatty acids known for their ideal contribution to eating habits wholesomeness have become increasingly popular due to their power to prevent certain diseases while improving overall well-being. Consumption of nutraceutical ingredients significantly impacts combating long-lasting conditions by promoting optimal internal system functions associated with health/wellness.
The increasing consumption of nutraceutical supplements also accelerates market growth for nutraceutical ingredients in the forecast period. Furthermore, the demand for natural nutraceutical ingredients such as ginkgo Biloba, garlic, cranberry, and ginseng extracts, such as chondroitin and glucosamine, has increased owing to the rising popularity of preventive medicines, homeopathic remedies, and self-treatment. Moreover, nutraceutical manufacturing companies have started including new ingredients in their products, such as polyphenols, plant sterols, probiotics, and fatty acids, along with traditional ingredients such as minerals, vitamins, and proteins.
Get an overview of this study by requesting a free sample
In March 2022, Tate & Lyle acquired Quantum Hi-Tech Biological, a prebiotic dietary fiber business in China, from ChemPartner Pharmatech for a value of USD 237 million. The main aim of this strategic acquisition is to strengthen the dietary fiber market of Tate & Lyle in Asia and China.
In February 2022, Fytexia Group was acquired by ABF Ingredients, a subsidiary of Associated British Foods. Pyrexia Group is a developer of active ingredients for various dietary supplements. The main aim of this acquisition was to expand ABFI's product portfolio in the pharmaceutical, nutritional, and food sectors.
Increasing incidences of chronic diseases- The increasing incidences of chronic diseases such as diabetes, blood pressure, obesity, and cardiovascular diseases and the deaths due to diabetes and respiratory diseases drive the market's growth. This has increased awareness among consumers about having a healthy diet. It is a clear fact that there is an excellent link between food and health. And once the eating pattern improves, health starts falling in place. So, consumers are looking for options that provide the right combination of taste and nutrition. This increases the demand for nutraceutical ingredients as they are healthier alternatives and offer specific functionalities.
High cost- Nutraceutical ingredients are rare to find and are used in various applications, such as animal nutrition, pharmaceuticals, functional food & beverages, and personal care products. However, the inclusion of nutraceutical ingredients in pharmaceuticals, feed products, food & beverage products, and personal care products increases the price of the final products. This increased price of the final products hampers the market's growth as most consumers refrain from buying expensive food products and prefer having natural ones.
New advanced technologies- Most nutraceutical ingredient manufacturers are adopting personalized healthcare technologies to formulate customized and better-suited end products for consumers. Furthermore, the companies operating in consumer products are increasingly collecting data for proper analysis of consumers' lifestyles and purchasing behavior to help provide tailored options per their needs and requirements. Using the latest technologies for studying consumer behavior towards food and lifestyle is expected to offer growth opportunities for the market over the forecast period.
Consumer skepticism towards new products- Even though consumers are aware of better dietary choices and increasing health awareness, consumers remain skeptical about using nutraceutical products. Apart from this, many consumers are aware of their manufacturing, including synthetic sourcing and unsubstantiated health claims, which refrains consumers from using these products. This is expected to challenge the market's growth over the forecast period. Furthermore, manufacturers' various health claims for marketing and selling purposes do not result in successful fruition, making consumer skepticism toward these products challenging the market's growth.
The regions analyzed for the market include North America, Europe, South America, Asia Pacific, the Middle East, and Africa. The North America emerged as the largest market for the global nutraceutical ingredients market, with a 38% market revenue share in 2023.
The U.S. is the largest market, followed by Canada in the region. In North America, a surge of consumer health consciousness results from an inclination towards nutraceutical ingredients that enhance overall wellness and fight chronic ailments. The North American market is inclined to natural and organic products that incorporate nutraceutical components. The demand for dietary supplements and functional foods is driven by the growing number of lifestyle-related illnesses, such as obesity, diabetes, and cardiovascular disorders, affecting older adults increasingly. Furthermore, the rise in sports nutrition and weight management has boosted demand for nutraceutical ingredients within the region.
North America Region Nutraceutical Ingredients Market Share in 2023 - 38%
www.thebrainyinsights.com
Check the geographical analysis of this market by requesting a free sample
The product type segment is divided into proteins, probiotics, phytochemicals & plant extracts, amino acids, and fibers & specialty carbohydrates. The probiotic segment dominated the market, with a market share of around 29.5% in 2023. Consumers are increasingly consuming probiotic ingredients with several health benefits and nutritional applications. Furthermore, they have positive effects on the health of humans. Owing to this, probiotic ingredients are increasingly being used in various applications such as beverages, dietary supplements, functional food, and animal nutritional industries.
The application segment is divided into food, beverages, animal nutrition, and dietary supplements. Over the forecast period, the dietary supplements segment is expected to grow at the fastest CAGR of 8.8%. The demand for dietary supplements has been increasing owing to the several health benefits offered by them, such as increased absorption of calcium and bone density improvement, improvement of gut microflora balance, control of blood sugar, improvement of intestinal functions such as regularity and bulking, enhancement of immune functions, reduction in the release of toxins that can cause fatty liver and other diseases, decreased risk of cardiovascular diseases, possible removal of the risk of obesity & metabolic syndrome, and improvement in bloating, abdominal pain, and constipation.
The form segment is divided into dry and liquid. In 2023, the dry segment dominated the market, accounting for around 56% of global revenue. Most nutraceutical ingredients are in dry forms, such as vitamins, proteins, prebiotic & probiotic premixes, amino acids, and some minerals such as folic acid and zinc. These nutraceutical ingredients are extracted from several sources in dry form. For instance, vitamin C is extracted from the acerola plant, and amino acids and fiber are extracted from the hemp plant. Furthermore, the dry form of nutraceutical ingredients helps preserve the color and flavor of food & beverage products and is easy to handle and store. The dry form of nutraceutical ingredients is available in capsule or tablet form for dietary supplements.
| Attribute | Description |
|---|---|
| Market Size | Revenue (USD Billion) |
| Market size value in 2023 | USD 188.59 billion |
| Market size value in 2033 | USD 381.51 billion |
| CAGR (2024 to 2033) | 7.3% |
| Historical data | 2020-2022 |
| Base Year | 2023 |
| Forecast | 2024-2033 |
| Region | Region includes Europe, Asia Pacific, North America, South America, and Middle East & Africa. |
| Segments | Product Type, Application, By Form, End-Use |
As per The Brainy Insights, the size of the nutraceutical ingredients market was valued at USD 188.59 billion in 2023 to USD 381.51 billion by 2033.
The global nutraceutical ingredients market is growing at a CAGR of 7.3% during the forecast period 2024-2033.
North America region emerged as the largest market for nutraceutical ingredients.
Increasing incidences of chronic diseases will influence the market's growth.
Consumer skepticism toward new products could hamper market growth.
New advanced technologies will provide considerable opportunities to the market.
Key players in the nutraceutical ingredients market are Archer Daniels Midland Company (ADM), BASF, Arla Foods, Roquette Freres, Cargill, DSM, Ingredion, Tate & Lyle PLC, Ingredion Incorporated, Ajinomoto Co., Inc.
1. Introduction
1.1. Objectives of the Study
1.2. Market Definition
1.3. Research Scope
1.4. Currency
1.5. Key Target Audience
2. Research Methodology and Assumptions
3. Executive Summary
4. Premium Insights
4.1. Porter’s Five Forces Analysis
4.2. Value Chain Analysis
4.3. Top Investment Pockets
4.3.1. Market Attractiveness Analysis By Product Type
4.3.2. Market Attractiveness Analysis By Application
4.3.3. Market Attractiveness Analysis By Form
4.3.4. Market Attractiveness Analysis By Region
4.4. Industry Trends
5. Market Dynamics
5.1. Market Evaluation
5.2. Drivers
5.2.1. Increasing incidences of chronic diseases
5.3. Restraints
5.3.1. High cost
5.4. Opportunities
5.4.1. New advanced technologies
5.5. Challenges
5.5.1. Consumer skepticism towards new products
6. Global Nutraceutical ingredients Market Analysis and Forecast, By Product Type
6.1. Segment Overview
6.2. Proteins
6.3. Probiotics
6.4. Phytochemicals & Plant Extracts
6.5. Amino Acids
6.6. Fibers & Specialty Carbohydrates
7. Global Nutraceutical ingredients Market Analysis and Forecast, By Application
7.1. Segment Overview
7.2. Food
7.3. Beverages
7.4. Animal Nutrition
7.5. Dietary Supplements
8. Global Nutraceutical ingredients Market Analysis and Forecast, By Form
8.1. Segment Overview
8.2. Dry
8.3. Liquid
9. Global Nutraceutical ingredients Market Analysis and Forecast, By Regional Analysis
9.1. Segment Overview
9.2. North America
9.2.1. U.S.
9.2.2. Canada
9.2.3. Mexico
9.3. Europe
9.3.1. Germany
9.3.2. France
9.3.3. U.K.
9.3.4. Italy
9.3.5. Spain
9.4. Asia-Pacific
9.4.1. Japan
9.4.2. China
9.4.3. India
9.5. South America
9.5.1. Brazil
9.6. Middle East and Africa
9.6.1. UAE
9.6.2. South Africa
10. Global Nutraceutical ingredients Market-Competitive Landscape
10.1. Overview
10.1.1. Market Share of Key Players in the Nutraceutical ingredients Market
10.1.2. Global Company Market Share
10.1.3. North America Company Market Share
10.1.4. Europe Company Market Share
10.1.5. APAC Company Market Share
10.2. Competitive Situations and Trends
10.2.1. Product Launches and Developments
10.2.2. Partnerships, Collaborations, and Agreements
10.2.3. Mergers & Acquisitions
10.2.4. Expansions
11. Company Profiles
11.1. Archer Daniels Midland Company (ADM)
11.1.1. Business Overview
11.1.2. Company Snapshot
11.1.3. Company Market Share Analysis
11.1.4. Company Component Portfolio
11.1.5. Recent Developments
11.1.6. SWOT Analysis
11.2. BASF
11.2.1. Business Overview
11.2.2. Company Snapshot
11.2.3. Company Market Share Analysis
11.2.4. Company Component Portfolio
11.2.5. Recent Developments
11.2.6. SWOT Analysis
11.3. Arla Foods
11.3.1. Business Overview
11.3.2. Company Snapshot
11.3.3. Company Market Share Analysis
11.3.4. Company Component Portfolio
11.3.5. Recent Developments
11.3.6. SWOT Analysis
11.4. Roquette Freres
11.4.1. Business Overview
11.4.2. Company Snapshot
11.4.3. Company Market Share Analysis
11.4.4. Company Component Portfolio
11.4.5. Recent Developments
11.4.6. SWOT Analysis
11.5. Cargill
11.5.1. Business Overview
11.5.2. Company Snapshot
11.5.3. Company Market Share Analysis
11.5.4. Company Component Portfolio
11.5.5. Recent Developments
11.5.6. SWOT Analysis
11.6. DSM
11.6.1. Business Overview
11.6.2. Company Snapshot
11.6.3. Company Market Share Analysis
11.6.4. Company Component Portfolio
11.6.5. Recent Developments
11.6.6. SWOT Analysis
11.7. Ingredion
11.7.1. Business Overview
11.7.2. Company Snapshot
11.7.3. Company Market Share Analysis
11.7.4. Company Component Portfolio
11.7.5. Recent Developments
11.7.6. SWOT Analysis
11.8. Tate & Lyle PLC
11.8.1. Business Overview
11.8.2. Company Snapshot
11.8.3. Company Market Share Analysis
11.8.4. Company Component Portfolio
11.8.5. Recent Developments
11.8.6. SWOT Analysis
11.9. Ingredion Incorporated
11.9.1. Business Overview
11.9.2. Company Snapshot
11.9.3. Company Market Share Analysis
11.9.4. Company Component Portfolio
11.9.5. Recent Developments
11.9.6. SWOT Analysis
11.10. Ajinomoto Co., Inc.
11.10.1. Business Overview
11.10.2. Company Snapshot
11.10.3. Company Market Share Analysis
11.10.4. Company Component Portfolio
11.10.5. Recent Developments
11.10.6. SWOT Analysis
List of Table
1. Global Nutraceutical Ingredients Market, By Product Type, 2020-2033 (USD Billion)
2. Global Proteins Nutraceutical Ingredients Market, By Region, 2020-2033 (USD Billion)
3. Global Probiotics Nutraceutical Ingredients Market, By Region, 2020-2033 (USD Billion)
4. Global Phytochemicals & Plant Extracts Nutraceutical Ingredients Market, By Region, 2020-2033 (USD Billion)
5. Global Amino Acids Nutraceutical Ingredients Market, By Region, 2020-2033 (USD Billion)
6. Global Fibers & Specialty Carbohydrates Nutraceutical Ingredients Market, By Region, 2020-2033 (USD Billion)
7. Global Nutraceutical Ingredients Market, By Application, 2020-2033 (USD Billion)
8. Global Food Nutraceutical Ingredients Market, By Region, 2020-2033 (USD Billion)
9. Global Beverages Nutraceutical Ingredients Market, By Region, 2020-2033 (USD Billion)
10. Global Animal Nutrition Nutraceutical Ingredients Market, By Region, 2020-2033 (USD Billion)
11. Global Dietary Supplements Nutraceutical Ingredients Market, By Region, 2020-2033 (USD Billion)
12. Global Nutraceutical Ingredients Market, By Form, 2020-2033 (USD Billion)
13. Global Dry Nutraceutical Ingredients Market, By Region, 2020-2033 (USD Billion)
14. Global Liquid Nutraceutical Ingredients Market, By Region, 2020-2033 (USD Billion)
15. Global Nutraceutical Ingredients Market, By Region, 2020-2033 (USD Billion)
16. North America Nutraceutical Ingredients Market, By Product Type, 2020-2033 (USD Billion)
17. North America Nutraceutical Ingredients Market, By Application, 2020-2033 (USD Billion)
18. North America Nutraceutical Ingredients Market, By Form, 2020-2033 (USD Billion)
19. U.S. Nutraceutical Ingredients Market, By Product Type, 2020-2033 (USD Billion)
20. U.S. Nutraceutical Ingredients Market, By Application, 2020-2033 (USD Billion)
21. U.S. Nutraceutical Ingredients Market, By Form, 2020-2033 (USD Billion)
22. Canada Nutraceutical Ingredients Market, By Product Type, 2020-2033 (USD Billion)
23. Canada Nutraceutical Ingredients Market, By Application, 2020-2033 (USD Billion)
24. Canada Nutraceutical Ingredients Market, By Form, 2020-2033 (USD Billion)
25. Mexico Nutraceutical Ingredients Market, By Product Type, 2020-2033 (USD Billion)
26. Mexico Nutraceutical Ingredients Market, By Application, 2020-2033 (USD Billion)
27. Mexico Nutraceutical Ingredients Market, By Form, 2020-2033 (USD Billion)
28. Europe Nutraceutical Ingredients Market, By Product Type, 2020-2033 (USD Billion)
29. Europe Nutraceutical Ingredients Market, By Application, 2020-2033 (USD Billion)
30. Europe Nutraceutical Ingredients Market, By Form, 2020-2033 (USD Billion)
31. Germany Nutraceutical Ingredients Market, By Product Type, 2020-2033 (USD Billion)
32. Germany Nutraceutical Ingredients Market, By Application, 2020-2033 (USD Billion)
33. Germany Nutraceutical Ingredients Market, By Form, 2020-2033 (USD Billion)
34. France Nutraceutical Ingredients Market, By Product Type, 2020-2033 (USD Billion)
35. France Nutraceutical Ingredients Market, By Application, 2020-2033 (USD Billion)
36. France Nutraceutical Ingredients Market, By Form, 2020-2033 (USD Billion)
37. U.K. Nutraceutical Ingredients Market, By Product Type, 2020-2033 (USD Billion)
38. U.K. Nutraceutical Ingredients Market, By Application, 2020-2033 (USD Billion)
39. U.K. Nutraceutical Ingredients Market, By Form, 2020-2033 (USD Billion)
40. Italy Nutraceutical Ingredients Market, By Product Type, 2020-2033 (USD Billion)
41. Italy Nutraceutical Ingredients Market, By Application, 2020-2033 (USD Billion)
42. Italy Nutraceutical Ingredients Market, By Form, 2020-2033 (USD Billion)
43. Spain Nutraceutical Ingredients Market, By Product Type, 2020-2033 (USD Billion)
44. Spain Nutraceutical Ingredients Market, By Application, 2020-2033 (USD Billion)
45. Spain Nutraceutical Ingredients Market, By Form, 2020-2033 (USD Billion)
46. Asia Pacific Nutraceutical Ingredients Market, By Product Type, 2020-2033 (USD Billion)
47. Asia Pacific Nutraceutical Ingredients Market, By Application, 2020-2033 (USD Billion)
48. Asia Pacific Nutraceutical Ingredients Market, By Form, 2020-2033 (USD Billion)
49. Japan Nutraceutical Ingredients Market, By Product Type, 2020-2033 (USD Billion)
50. Japan Nutraceutical Ingredients Market, By Application, 2020-2033 (USD Billion)
51. Japan Nutraceutical Ingredients Market, By Form, 2020-2033 (USD Billion)
52. China Nutraceutical Ingredients Market, By Product Type, 2020-2033 (USD Billion)
53. China Nutraceutical Ingredients Market, By Application, 2020-2033 (USD Billion)
54. China Nutraceutical Ingredients Market, By Form, 2020-2033 (USD Billion)
55. India Nutraceutical Ingredients Market, By Product Type, 2020-2033 (USD Billion)
56. India Nutraceutical Ingredients Market, By Application, 2020-2033 (USD Billion)
57. India Nutraceutical Ingredients Market, By Form, 2020-2033 (USD Billion)
58. South America Nutraceutical Ingredients Market, By Product Type, 2020-2033 (USD Billion)
59. South America Nutraceutical Ingredients Market, By Application, 2020-2033 (USD Billion)
60. South America Nutraceutical Ingredients Market, By Form, 2020-2033 (USD Billion)
61. Brazil Nutraceutical Ingredients Market, By Product Type, 2020-2033 (USD Billion)
62. Brazil Nutraceutical Ingredients Market, By Application, 2020-2033 (USD Billion)
63. Brazil Nutraceutical Ingredients Market, By Form, 2020-2033 (USD Billion)
64. The Middle East and Africa Nutraceutical Ingredients Market, By Product Type, 2020-2033 (USD Billion)
65. The Middle East and Africa Nutraceutical Ingredients Market, By Application, 2020-2033 (USD Billion)
66. The Middle East and Africa Nutraceutical Ingredients Market, By Form, 2020-2033 (USD Billion)
67. UAE Nutraceutical Ingredients Market, By Product Type, 2020-2033 (USD Billion)
68. UAE Nutraceutical Ingredients Market, By Application, 2020-2033 (USD Billion)
69. UAE Nutraceutical Ingredients Market, By Form, 2020-2033 (USD Billion)
70. South Africa Nutraceutical ingredients Market, By Product Type, 2020-2033 (USD Billion)
71. South Africa Nutraceutical ingredients Market, By Application, 2020-2033 (USD Billion)
72. South Africa Nutraceutical ingredients Market, By Form, 2020-2033 (USD Billion)
List of Figures
1. Global Nutraceutical ingredients Market Segmentation
2. Nutraceutical ingredients Market: Research Methodology
3. Market Size Estimation Methodology: Bottom-Up Approach
4. Market Size Estimation Methodology: Top-Down Approach
5. Data Triangulation
6. Porter’s Five Forces Analysis
7. Value Chain Analysis
8. Global Nutraceutical Ingredients Market Attractiveness Analysis By Product Type
9. Global Nutraceutical Ingredients Market Attractiveness Analysis By Application
10. Global Nutraceutical Ingredients Market Attractiveness Analysis By Form
11. Global Nutraceutical Ingredients Market Attractiveness Analysis By Region
12. Global Nutraceutical Ingredients Market: Dynamics
13. Global Nutraceutical Ingredients Market Share by Product Type (2023 & 2033)
14. Global Nutraceutical Ingredients Market Share By Application (2023 & 2033)
15. Global Nutraceutical Ingredients Market Share by Form (2023 & 2033)
16. Global Nutraceutical Ingredients Market Share by Regions (2023 & 2033)
17. Global Nutraceutical Ingredients Market Share by Company (2023)
This study forecasts revenue at global, regional, and country levels from 2020 to 2033. Brainy Insights has segmented the global nutraceutical ingredients market based on the below-mentioned segments:
Global Nutraceutical Ingredients Market by Product Type:
Global Nutraceutical Ingredients Market by Application:
Global Nutraceutical Ingredients Market by Form:
Global Nutraceutical Ingredients Market by Region:
Research has its special purpose to undertake marketing efficiently. In this competitive scenario, businesses need information across all industry verticals; the information about customer wants, market demand, competition, industry trends, distribution channels etc. This information needs to be updated regularly because businesses operate in a dynamic environment. Our organization, The Brainy Insights incorporates scientific and systematic research procedures in order to get proper market insights and industry analysis for overall business success. The analysis consists of studying the market from a miniscule level wherein we implement statistical tools which helps us in examining the data with accuracy and precision.
Our research reports feature both; quantitative and qualitative aspects for any market. Qualitative information for any market research process are fundamental because they reveal the customer needs and wants, usage and consumption for any product/service related to a specific industry. This in turn aids the marketers/investors in knowing certain perceptions of the customers. Qualitative research can enlighten about the different product concepts and designs along with unique service offering that in turn, helps define marketing problems and generate opportunities. On the other hand, quantitative research engages with the data collection process through interviews, e-mail interactions, surveys and pilot studies. Quantitative aspects for the market research are useful to validate the hypotheses generated during qualitative research method, explore empirical patterns in the data with the help of statistical tools, and finally make the market estimations.
The Brainy Insights offers comprehensive research and analysis, based on a wide assortment of factual insights gained through interviews with CXOs and global experts and secondary data from reliable sources. Our analysts and industry specialist assume vital roles in building up statistical tools and analysis models, which are used to analyse the data and arrive at accurate insights with exceedingly informative research discoveries. The data provided by our organization have proven precious to a diverse range of companies, facilitating them to address issues such as determining which products/services are the most appealing, whether or not customers use the product in the manner anticipated, the purchasing intentions of the market and many others.
Our research methodology encompasses an idyllic combination of primary and secondary initiatives. Key phases involved in this process are listed below:

The phase involves the gathering and collecting of market data and its related information with the help of different sources & research procedures.

The data procurement stage involves in data gathering and collecting through various data sources.
This stage involves in extensive research. These data sources includes:
Purchased Database: Purchased databases play a crucial role in estimating the market sizes irrespective of the domain. Our purchased database includes:
Primary Research: The Brainy Insights interacts with leading companies and experts of the concerned domain to develop the analyst team’s market understanding and expertise. It improves and substantiates every single data presented in the market reports. Primary research mainly involves in telephonic interviews, E-mail interactions and face-to-face interviews with the raw material providers, manufacturers/producers, distributors, & independent consultants. The interviews that we conduct provides valuable data on market size and industry growth trends prevailing in the market. Our organization also conducts surveys with the various industry experts in order to gain overall insights of the industry/market. For instance, in healthcare industry we conduct surveys with the pharmacists, doctors, surgeons and nurses in order to gain insights and key information of a medical product/device/equipment which the customers are going to usage. Surveys are conducted in the form of questionnaire designed by our own analyst team. Surveys plays an important role in primary research because surveys helps us to identify the key target audiences of the market. Additionally, surveys helps to identify the key target audience engaged with the market. Our survey team conducts the survey by targeting the key audience, thus gaining insights from them. Based on the perspectives of the customers, this information is utilized to formulate market strategies. Moreover, market surveys helps us to understand the current competitive situation of the industry. To be precise, our survey process typically involve with the 360 analysis of the market. This analytical process begins by identifying the prospective customers for a product or service related to the market/industry to obtain data on how a product/service could fit into customers’ lives.

Secondary Research: The secondary data sources includes information published by the on-profit organizations such as World bank, WHO, company fillings, investor presentations, annual reports, national government documents, statistical databases, blogs, articles, white papers and others. From the annual report, we analyse a company’s revenue to understand the key segment and market share of that organization in a particular region. We analyse the company websites and adopt the product mapping technique which is important for deriving the segment revenue. In the product mapping method, we select and categorize the products offered by the companies catering to domain specific market, deduce the product revenue for each of the companies so as to get overall estimation of the market size. We also source data and analyses trends based on information received from supply side and demand side intermediaries in the value chain. The supply side denotes the data gathered from supplier, distributor, wholesaler and the demand side illustrates the data gathered from the end customers for respective market domain.

The supply side for a domain specific market is analysed by:
The demand side for the market is estimated through:
In-house Library: Apart from these third-party sources, we have our in-house library of qualitative and quantitative information. Our in-house database includes market data for various industry and domains. These data are updated on regular basis as per the changing market scenario. Our library includes, historic databases, internal audit reports and archives.
Sometimes there are instances where there is no metadata or raw data available for any domain specific market. For those cases, we use our expertise to forecast and estimate the market size in order to generate comprehensive data sets. Our analyst team adopt a robust research technique in order to produce the estimates:
Data Synthesis: This stage involves the analysis & mapping of all the information obtained from the previous step. It also involves in scrutinizing the data for any discrepancy observed while data gathering related to the market. The data is collected with consideration to the heterogeneity of sources. Robust scientific techniques are in place for synthesizing disparate data sets and provide the essential contextual information that can orient market strategies. The Brainy Insights has extensive experience in data synthesis where the data passes through various stages:


Market Deduction & Formulation: The final stage comprises of assigning data points at appropriate market spaces so as to deduce feasible conclusions. Analyst perspective & subject matter expert based holistic form of market sizing coupled with industry analysis also plays a crucial role in this stage.
This stage involves in finalization of the market size and numbers that we have collected from data integration step. With data interpolation, it is made sure that there is no gap in the market data. Successful trend analysis is done by our analysts using extrapolation techniques, which provide the best possible forecasts for the market.
Data Validation & Market Feedback: Validation is the most important step in the process. Validation & re-validation via an intricately designed process helps us finalize data-points to be used for final calculations.

The Brainy Insights interacts with leading companies and experts of the concerned domain to develop the analyst team’s market understanding and expertise. It improves and substantiates every single data presented in the market reports. The data validation interview and discussion panels are typically composed of the most experienced industry members. The participants include, however, are not limited to:
Moreover, we always validate our data and findings through primary respondents from all the major regions we are working on.


Free Customization
Fortune 500 Clients
Free Yearly Update On Purchase Of Multi/Corporate License
Companies Served Till Date