- +1-315-215-1633
- sales@thebrainyinsights.com

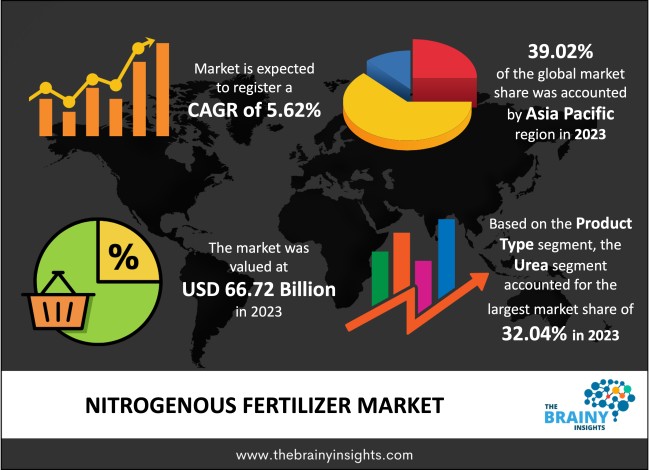
The global nitrogenous fertilizer market was valued at USD 66.72 Billion in 2023 and grew at a CAGR of 5.62% from 2024 to 2033. The market is expected to reach USD 115.27 Billion by 2033. The growth of the nitrogenous fertilizer market can be attributed to the rising usage of it in the production of different crops. Further, the increasing investment in the development of fertilizers has played a pivotal role in the market growth.
Chemicals called fertilizers are sprayed on crops to increase their yield. Farmers use these to increase crop yields. They increase the fertility of the soil and improve its ability to hold onto water. Nitrogen is a key element required for plants to grow. Although it is found naturally, very few plants can actually absorb it. Consequently, it is given to plants artificially as nitrogenous fertilizers. These nitrogenous fertilizers achieve yield faster by controlling plant growth and enhancing plant texture. The most popular type of fertilizer is nitrogen fertilizer, which is produced from nitrogen compounds and is applied to crops to increase production in the farming sector. Among other things, they are frequently utilized in fertigation, foliar, and soil treatments. Many agricultural items utilize nitrogenous fertilizers, including cereals, cotton, fruits, and vegetables.
Get an overview of this study by requesting a free sample
Wide applications: Fertiliser containing nitrogen has various effects on crop growth. It promotes the growth of foliage and gives plants a green hue. When it comes to cereals, it usually results in lumpy seeds and succulence, or tenderness, in the plant. Farmers use nitrogenous fertilizer to reduce the possibility of leaching below the root zone or gaseous losses through denitrification. Nitrogen is essential for the growth and reproduction of plants. Increasing soil nitrogen availability will frequently result in greater pasture and crop growth. Fertilizers that contain nitrogen are frequently added to address this condition. Nitrogen fertilizers are crucial to ensuring a sufficient supply of nutrient-dense food, and thus, nitrogen fertilizers are now being used in several regions.
Fluctuating cost of materials: One of the main factors influencing the price of fertilizer production is the cost of raw materials. Fertilizer prices might vary yearly, depending on macroeconomic factors. Thus, the market growth of nitrogenous fertilizers will be hindered due to the price fluctuations of raw materials.
Increasing investment in the agriculture industry: A strain is being placed on the current global food production infrastructure due to the worldwide population growth. There needs to be more space for farmers to grow food, even while the world's population rises quickly. By 2050, it is predicted that there will be about 10 billion people on the planet, necessitating a major increase in food production. Regarding their ability to secure the livelihoods of millions of people employed along agricultural value chains and enhance the industry's environmental sustainability, investments in agriculture and food systems are rising. If present trends continue, there will be a 70% rise in caloric demand and a minimum 100% increase in crop demand by 2050 for human consumption and animal feed. Thus, investment in the agriculture industry will rise eventually.
The regions analyzed for the market include North America, Europe, South America, Asia Pacific, the Middle East, and Africa. Asia-Pacific emerged as the most significant Nitrogenous Fertilizer market, with a 39.02% market revenue share in 2023.
Asia Pacific region will account for the largest market share with revenue growth. The Asia Pacific region has led the market for nitrogenous fertilizers in recent years, and this trend is expected to continue shortly. Among the biggest users of nitrogenous fertilizers in the region are the developing nations of China and India. The region's vast rice production has primarily driven the market for nitrogenous fertilizers.
Asia-Pacific region Nitrogenous Fertilizer Market Share in 2023 - 39.02%
www.thebrainyinsights.com
Check the geographical analysis of this market by requesting a free sample
The product type segment is divided into ammonium sulfate, ammonium nitrate, urea, calcium ammonium nitrate and others. The urea segment dominated the market, with a share of around 32.04% in 2023. Since it contains up to 46% nitrogen, urea is the most important nitrogenous fertilizer. It is probable that urea volatilization, caused by rapid hydrolysis to form ammonium carbonate, will result in a significant ammonia loss if urea is sprayed onto the bare soil surface.
The crop type segment is divided into fruits and vegetables, oilseeds and pulses, cereals and grains and others. The cereals and grains segment dominated the market, with a share of around 43.29% in 2023. When fertilizing wheat and barley properly, three components are crucial: nitrogen, phosphorus, and potassium. Given that sufficient nitrogen supply is necessary for optimal yields and that cereal seeds have storage protein reserves containing around 6% nitrogen, nitrogen is cereal crops' most important mineral ingredient.
| Attribute | Description |
|---|---|
| Market Size | Revenue (USD Billion) |
| Market size value in 2023 | USD 66.72 Billion |
| Market size value in 2033 | USD 115.27 Billion |
| CAGR (2024 to 2033) | 5.62% |
| Historical data | 2020-2022 |
| Base Year | 2023 |
| Forecast | 2024-2033 |
| Region | The regions analyzed for the market are Asia Pacific, Europe, South America, North America, and Middle East & Africa. Furthermore, the regions are further analyzed at the country level. |
| Segments | Product Type and Crop Type |
As per The Brainy Insights, the size of the nitrogenous fertilizer market was valued at USD 66.72 Billion in 2023 to USD 115.27 Billion by 2033.
Global nitrogenous fertilizer market is growing at a CAGR of 5.62% during the forecast period 2024-2033.
The global nitrogenous fertilizer market has been segmented based on product type, crop type and regions. Urea industry led the market in 2023 in the product type segment. Cereals and grains led the market in 2023 in the crop type segment.
Asia Pacific region emerged as the largest market for the nitrogenous fertilizer.
The market's growth will be influenced by the growing usage of nitrogenous fertilizer.
The fluctuating cost of raw material can hamper the market growth.
The increasing investment in agriculture industry is providing huge opportunities to the market.
1. Introduction
1.1. Objectives of the Study
1.2. Market Definition
1.3. Research Scope
1.4. Currency
1.5. Key Target Audience
2. Research Methodology and Assumptions
3. Executive Summary
4. Premium Insights
4.1. Porter’s Five Forces Analysis
4.2. Value Chain Analysis
4.3. Top Investment Pockets
4.3.1. Market Attractiveness Analysis by Product Type
4.3.2. Market Attractiveness Analysis by Crop Type
4.3.3. Market Attractiveness Analysis by Region
4.4. Industry Trends
5. Market Dynamics
5.1. Market Evaluation
5.2. Drivers
5.2.1. Increasing usage of nitrogenous fertilizer
5.3. Restraints
5.3.1. Fluctuating cost of raw materials
5.4. Opportunities
5.4.1. Increasing investment in agriculture industry
5.5. Challenges
5.5.1. Environment impact
6. Global Nitrogenous Fertilizer Market Analysis and Forecast, By Product Type
6.1. Segment Overview
6.2. Ammonium Sulfate
6.3. Ammonium Nitrate
6.4. Urea
6.5. Calcium Ammonium Nitrate
6.6. Others
7. Global Nitrogenous Fertilizer Market Analysis and Forecast, By Crop Type
7.1. Segment Overview
7.2. Vegetables
7.3. Oilseeds and Pulses
7.4. Cereals and Grains
7.5. Others
8. Global Nitrogenous Fertilizer Market Analysis and Forecast, By Regional Analysis
8.1. Segment Overview
8.2. North America
8.2.1. U.S.
8.2.2. Canada
8.2.3. Mexico
8.3. Europe
8.3.1. Germany
8.3.2. France
8.3.3. U.K.
8.3.4. Italy
8.3.5. Spain
8.4. Asia-Pacific
8.4.1. Japan
8.4.2. China
8.4.3. India
8.5. South America
8.5.1. Brazil
8.6. Middle East and Africa
8.6.1. UAE
8.6.2. South Africa
9. Global Nitrogenous Fertilizer Market-Competitive Landscape
9.1. Overview
9.2. Market Share of Key Players in the Nitrogenous Fertilizer Market
9.2.1. Global Company Market Share
9.2.2. North America Company Market Share
9.2.3. Europe Company Market Share
9.2.4. APAC Company Market Share
9.3. Competitive Situations and Trends
9.3.1. Product Launches and Developments
9.3.2. Partnerships, Collaborations, and Agreements
9.3.3. Mergers & Acquisitions
9.3.4. Expansions
10. Company Profiles
10.1. Aquasol Nutri
10.1.1. Business Overview
10.1.2. Company Snapshot
10.1.3. Company Market Share Analysis
10.1.4. Company Product Portfolio
10.1.5. Recent Developments
10.1.6. SWOT Analysis
10.2. CF Industries Holdings Inc.
10.2.1. Business Overview
10.2.2. Company Snapshot
10.2.3. Company Market Share Analysis
10.2.4. Company Product Portfolio
10.2.5. Recent Developments
10.2.6. SWOT Analysis
10.3. Bunge Ltd.
10.3.1. Business Overview
10.3.2. Company Snapshot
10.3.3. Company Market Share Analysis
10.3.4. Company Product Portfolio
10.3.5. Recent Developments
10.3.6. SWOT Analysis
10.4. Coromandal International Limited
10.4.1. Business Overview
10.4.2. Company Snapshot
10.4.3. Company Market Share Analysis
10.4.4. Company Product Portfolio
10.4.5. Recent Developments
10.4.6. SWOT Analysis
10.5. Haifa Group
10.5.1. Business Overview
10.5.2. Company Snapshot
10.5.3. Company Market Share Analysis
10.5.4. Company Product Portfolio
10.5.5. Recent Developments
10.5.6. SWOT Analysis
10.6. Eurochem Group AG
10.6.1. Business Overview
10.6.2. Company Snapshot
10.6.3. Company Market Share Analysis
10.6.4. Company Product Portfolio
10.6.5. Recent Developments
10.6.6. SWOT Analysis
10.7. Hellagrolip SA
10.7.1. Business Overview
10.7.2. Company Snapshot
10.7.3. Company Market Share Analysis
10.7.4. Company Product Portfolio
10.7.5. Recent Developments
10.7.6. SWOT Analysis
10.8. Koch Fertilizer, LLC
10.8.1. Business Overview
10.8.2. Company Snapshot
10.8.3. Company Market Share Analysis
10.8.4. Company Product Portfolio
10.8.5. Recent Developments
10.8.6. SWOT Analysis
10.9. ICL Fertilizers
10.9.1. Business Overview
10.9.2. Company Snapshot
10.9.3. Company Market Share Analysis
10.9.4. Company Product Portfolio
10.9.5. Recent Developments
10.9.6. SWOT Analysis
10.10. Kynoch Fertilizer
10.10.1. Business Overview
10.10.2. Company Snapshot
10.10.3. Company Market Share Analysis
10.10.4. Company Product Portfolio
10.10.5. Recent Developments
10.10.6. SWOT Analysis
10.11. Nutrien Ltd.
10.11.1. Business Overview
10.11.2. Company Snapshot
10.11.3. Company Market Share Analysis
10.11.4. Company Product Portfolio
10.11.5. Recent Developments
10.11.6. SWOT Analysis
10.12. Notore Chemical Industries Plc
10.12.1. Business Overview
10.12.2. Company Snapshot
10.12.3. Company Market Share Analysis
10.12.4. Company Product Portfolio
10.12.5. Recent Developments
10.12.6. SWOT Analysis
10.13. OCI Nitrogen
10.13.1. Business Overview
10.13.2. Company Snapshot
10.13.3. Company Market Share Analysis
10.13.4. Company Product Portfolio
10.13.5. Recent Developments
10.13.6. SWOT Analysis
10.14. Rolfes Agri Ltd.
10.14.1. Business Overview
10.14.2. Company Snapshot
10.14.3. Company Market Share Analysis
10.14.4. Company Product Portfolio
10.14.5. Recent Developments
10.14.6. SWOT Analysis
10.15. Omnia Holdings Limited
10.15.1. Business Overview
10.15.2. Company Snapshot
10.15.3. Company Market Share Analysis
10.15.4. Company Product Portfolio
10.15.5. Recent Developments
10.15.6. SWOT Analysis
10.16. Sasol
10.16.1. Business Overview
10.16.2. Company Snapshot
10.16.3. Company Market Share Analysis
10.16.4. Company Product Portfolio
10.16.5. Recent Developments
10.16.6. SWOT Analysis
10.17. TriomfSA
10.17.1. Business Overview
10.17.2. Company Snapshot
10.17.3. Company Market Share Analysis
10.17.4. Company Product Portfolio
10.17.5. Recent Developments
10.17.6. SWOT Analysis
10.18. Sorfertp
10.18.1. Business Overview
10.18.2. Company Snapshot
10.18.3. Company Market Share Analysis
10.18.4. Company Product Portfolio
10.18.5. Recent Developments
10.18.6. SWOT Analysis
10.19. Yara
10.19.1. Business Overview
10.19.2. Company Snapshot
10.19.3. Company Market Share Analysis
10.19.4. Company Product Portfolio
10.19.5. Recent Developments
10.19.6. SWOT Analysis
List of Table
1. Global Nitrogenous Fertilizer Market, By Product Type, 2020-2033 (USD Billion)
2. Global Ammonium Sulfate, Nitrogenous Fertilizer Market, By Region, 2020-2033 (USD Billion)
3. Global Ammonium Nitrate, Nitrogenous Fertilizer Market, By Region, 2020-2033 (USD Billion)
4. Global Urea, Nitrogenous Fertilizer Market, By Region, 2020-2033 (USD Billion)
5. Global Calcium Ammonium Nitrate, Nitrogenous Fertilizer Market, By Region, 2020-2033 (USD Billion)
6. Global Others, Nitrogenous Fertilizer Market, By Region, 2020-2033 (USD Billion)
7. Global Nitrogenous Fertilizer Market, By Crop Type, 2020-2033 (USD Billion)
8. Global Fruits and Vegetables, Nitrogenous Fertilizer Market, By Region, 2020-2033 (USD Billion)
9. Global Oilseeds and Pulses, Nitrogenous Fertilizer Market, By Region, 2020-2033 (USD Billion)
10. Global Cereals and Grains, Nitrogenous Fertilizer Market, By Region, 2020-2033 (USD Billion)
11. Global Others, Nitrogenous Fertilizer Market, By Region, 2020-2033 (USD Billion)
12. Global Nitrogenous Fertilizer Market, By Region, 2020-2033 (USD Billion)
13. North America Nitrogenous Fertilizer Market, By Product Type, 2020-2033 (USD Billion)
14. North America Nitrogenous Fertilizer Market, By Crop Type, 2020-2033 (USD Billion)
15. U.S. Nitrogenous Fertilizer Market, By Product Type, 2020-2033 (USD Billion)
16. U.S. Nitrogenous Fertilizer Market, By Crop Type, 2020-2033 (USD Billion)
17. Canada Nitrogenous Fertilizer Market, By Product Type, 2020-2033 (USD Billion)
18. Canada Nitrogenous Fertilizer Market, By Crop Type, 2020-2033 (USD Billion)
19. Mexico Nitrogenous Fertilizer Market, By Product Type, 2020-2033 (USD Billion)
20. Mexico Nitrogenous Fertilizer Market, By Crop Type, 2020-2033 (USD Billion)
21. Europe Nitrogenous Fertilizer Market, By Product Type, 2020-2033 (USD Billion)
22. Europe Nitrogenous Fertilizer Market, By Crop Type, 2020-2033 (USD Billion)
23. Germany Nitrogenous Fertilizer Market, By Product Type, 2020-2033 (USD Billion)
24. Germany Nitrogenous Fertilizer Market, By Crop Type, 2020-2033 (USD Billion)
25. France Nitrogenous Fertilizer Market, By Product Type, 2020-2033 (USD Billion)
26. France Nitrogenous Fertilizer Market, By Crop Type, 2020-2033 (USD Billion)
27. U.K. Nitrogenous Fertilizer Market, By Product Type, 2020-2033 (USD Billion)
28. U.K. Nitrogenous Fertilizer Market, By Crop Type, 2020-2033 (USD Billion)
29. Italy Nitrogenous Fertilizer Market, By Product Type, 2020-2033 (USD Billion)
30. Italy Nitrogenous Fertilizer Market, By Crop Type, 2020-2033 (USD Billion)
31. Spain Nitrogenous Fertilizer Market, By Product Type, 2020-2033 (USD Billion)
32. Spain Nitrogenous Fertilizer Market, By Crop Type, 2020-2033 (USD Billion)
33. Asia Pacific Nitrogenous Fertilizer Market, By Product Type, 2020-2033 (USD Billion)
34. Asia Pacific Nitrogenous Fertilizer Market, By Crop Type, 2020-2033 (USD Billion)
35. Japan Nitrogenous Fertilizer Market, By Product Type, 2020-2033 (USD Billion)
36. Japan Nitrogenous Fertilizer Market, By Crop Type, 2020-2033 (USD Billion)
37. China Nitrogenous Fertilizer Market, By Product Type, 2020-2033 (USD Billion)
38. China Nitrogenous Fertilizer Market, By Crop Type, 2020-2033 (USD Billion)
39. India Nitrogenous Fertilizer Market, By Product Type, 2020-2033 (USD Billion)
40. India Nitrogenous Fertilizer Market, By Crop Type, 2020-2033 (USD Billion)
41. South America Nitrogenous Fertilizer Market, By Product Type, 2020-2033 (USD Billion)
42. South America Nitrogenous Fertilizer Market, By Crop Type, 2020-2033 (USD Billion)
43. Brazil Nitrogenous Fertilizer Market, By Product Type, 2020-2033 (USD Billion)
44. Brazil Nitrogenous Fertilizer Market, By Crop Type, 2020-2033 (USD Billion)
45. Middle East and Africa Nitrogenous Fertilizer Market, By Product Type, 2020-2033 (USD Billion)
46. Middle East and Africa Nitrogenous Fertilizer Market, By Crop Type, 2020-2033 (USD Billion)
47. UAE Nitrogenous Fertilizer Market, By Product Type, 2020-2033 (USD Billion)
48. UAE Nitrogenous Fertilizer Market, By Crop Type, 2020-2033 (USD Billion)
49. South Africa Nitrogenous Fertilizer Market, By Product Type, 2020-2033 (USD Billion)
50. South Africa Nitrogenous Fertilizer Market, By Crop Type, 2020-2033 (USD Billion)
List of Figures
1. Global Nitrogenous Fertilizer Market Segmentation
2. Nitrogenous Fertilizer Market: Research Methodology
3. Market Size Estimation Methodology: Bottom-Up Approach
4. Market Size Estimation Methodology: Top-Down Approach
5. Data Triangulation
6. Porter’s Five Forces Analysis
7. Value Chain Analysis
8. Global Nitrogenous Fertilizer Market Attractiveness Analysis by Product Type
9. Global Nitrogenous Fertilizer Market Attractiveness Analysis by Crop Type
10. Global Nitrogenous Fertilizer Market Attractiveness Analysis by Region
11. Global Nitrogenous Fertilizer Market: Dynamics
12. Global Nitrogenous Fertilizer Market Share by Product Type (2023 & 2033)
13. Global Nitrogenous Fertilizer Market Share by Crop Type (2023 & 2033)
14. Global Nitrogenous Fertilizer Market Share by Regions (2023 & 2033)
15. Global Nitrogenous Fertilizer Market Share by Company (2023)
This study forecasts revenue at global, regional, and country levels from 2020 to 2033. The Brainy Insights has segmented the global nitrogenous fertilizer market based on below mentioned segments:
Global Nitrogenous Fertilizer Market by Product Type:
Global Nitrogenous Fertilizer Market by Crop Type:
Global Nitrogenous Fertilizer Market by Region:
Research has its special purpose to undertake marketing efficiently. In this competitive scenario, businesses need information across all industry verticals; the information about customer wants, market demand, competition, industry trends, distribution channels etc. This information needs to be updated regularly because businesses operate in a dynamic environment. Our organization, The Brainy Insights incorporates scientific and systematic research procedures in order to get proper market insights and industry analysis for overall business success. The analysis consists of studying the market from a miniscule level wherein we implement statistical tools which helps us in examining the data with accuracy and precision.
Our research reports feature both; quantitative and qualitative aspects for any market. Qualitative information for any market research process are fundamental because they reveal the customer needs and wants, usage and consumption for any product/service related to a specific industry. This in turn aids the marketers/investors in knowing certain perceptions of the customers. Qualitative research can enlighten about the different product concepts and designs along with unique service offering that in turn, helps define marketing problems and generate opportunities. On the other hand, quantitative research engages with the data collection process through interviews, e-mail interactions, surveys and pilot studies. Quantitative aspects for the market research are useful to validate the hypotheses generated during qualitative research method, explore empirical patterns in the data with the help of statistical tools, and finally make the market estimations.
The Brainy Insights offers comprehensive research and analysis, based on a wide assortment of factual insights gained through interviews with CXOs and global experts and secondary data from reliable sources. Our analysts and industry specialist assume vital roles in building up statistical tools and analysis models, which are used to analyse the data and arrive at accurate insights with exceedingly informative research discoveries. The data provided by our organization have proven precious to a diverse range of companies, facilitating them to address issues such as determining which products/services are the most appealing, whether or not customers use the product in the manner anticipated, the purchasing intentions of the market and many others.
Our research methodology encompasses an idyllic combination of primary and secondary initiatives. Key phases involved in this process are listed below:

The phase involves the gathering and collecting of market data and its related information with the help of different sources & research procedures.

The data procurement stage involves in data gathering and collecting through various data sources.
This stage involves in extensive research. These data sources includes:
Purchased Database: Purchased databases play a crucial role in estimating the market sizes irrespective of the domain. Our purchased database includes:
Primary Research: The Brainy Insights interacts with leading companies and experts of the concerned domain to develop the analyst team’s market understanding and expertise. It improves and substantiates every single data presented in the market reports. Primary research mainly involves in telephonic interviews, E-mail interactions and face-to-face interviews with the raw material providers, manufacturers/producers, distributors, & independent consultants. The interviews that we conduct provides valuable data on market size and industry growth trends prevailing in the market. Our organization also conducts surveys with the various industry experts in order to gain overall insights of the industry/market. For instance, in healthcare industry we conduct surveys with the pharmacists, doctors, surgeons and nurses in order to gain insights and key information of a medical product/device/equipment which the customers are going to usage. Surveys are conducted in the form of questionnaire designed by our own analyst team. Surveys plays an important role in primary research because surveys helps us to identify the key target audiences of the market. Additionally, surveys helps to identify the key target audience engaged with the market. Our survey team conducts the survey by targeting the key audience, thus gaining insights from them. Based on the perspectives of the customers, this information is utilized to formulate market strategies. Moreover, market surveys helps us to understand the current competitive situation of the industry. To be precise, our survey process typically involve with the 360 analysis of the market. This analytical process begins by identifying the prospective customers for a product or service related to the market/industry to obtain data on how a product/service could fit into customers’ lives.

Secondary Research: The secondary data sources includes information published by the on-profit organizations such as World bank, WHO, company fillings, investor presentations, annual reports, national government documents, statistical databases, blogs, articles, white papers and others. From the annual report, we analyse a company’s revenue to understand the key segment and market share of that organization in a particular region. We analyse the company websites and adopt the product mapping technique which is important for deriving the segment revenue. In the product mapping method, we select and categorize the products offered by the companies catering to domain specific market, deduce the product revenue for each of the companies so as to get overall estimation of the market size. We also source data and analyses trends based on information received from supply side and demand side intermediaries in the value chain. The supply side denotes the data gathered from supplier, distributor, wholesaler and the demand side illustrates the data gathered from the end customers for respective market domain.

The supply side for a domain specific market is analysed by:
The demand side for the market is estimated through:
In-house Library: Apart from these third-party sources, we have our in-house library of qualitative and quantitative information. Our in-house database includes market data for various industry and domains. These data are updated on regular basis as per the changing market scenario. Our library includes, historic databases, internal audit reports and archives.
Sometimes there are instances where there is no metadata or raw data available for any domain specific market. For those cases, we use our expertise to forecast and estimate the market size in order to generate comprehensive data sets. Our analyst team adopt a robust research technique in order to produce the estimates:
Data Synthesis: This stage involves the analysis & mapping of all the information obtained from the previous step. It also involves in scrutinizing the data for any discrepancy observed while data gathering related to the market. The data is collected with consideration to the heterogeneity of sources. Robust scientific techniques are in place for synthesizing disparate data sets and provide the essential contextual information that can orient market strategies. The Brainy Insights has extensive experience in data synthesis where the data passes through various stages:


Market Deduction & Formulation: The final stage comprises of assigning data points at appropriate market spaces so as to deduce feasible conclusions. Analyst perspective & subject matter expert based holistic form of market sizing coupled with industry analysis also plays a crucial role in this stage.
This stage involves in finalization of the market size and numbers that we have collected from data integration step. With data interpolation, it is made sure that there is no gap in the market data. Successful trend analysis is done by our analysts using extrapolation techniques, which provide the best possible forecasts for the market.
Data Validation & Market Feedback: Validation is the most important step in the process. Validation & re-validation via an intricately designed process helps us finalize data-points to be used for final calculations.

The Brainy Insights interacts with leading companies and experts of the concerned domain to develop the analyst team’s market understanding and expertise. It improves and substantiates every single data presented in the market reports. The data validation interview and discussion panels are typically composed of the most experienced industry members. The participants include, however, are not limited to:
Moreover, we always validate our data and findings through primary respondents from all the major regions we are working on.


Free Customization
Fortune 500 Clients
Free Yearly Update On Purchase Of Multi/Corporate License
Companies Served Till Date