- +1-315-215-1633
- sales@thebrainyinsights.com

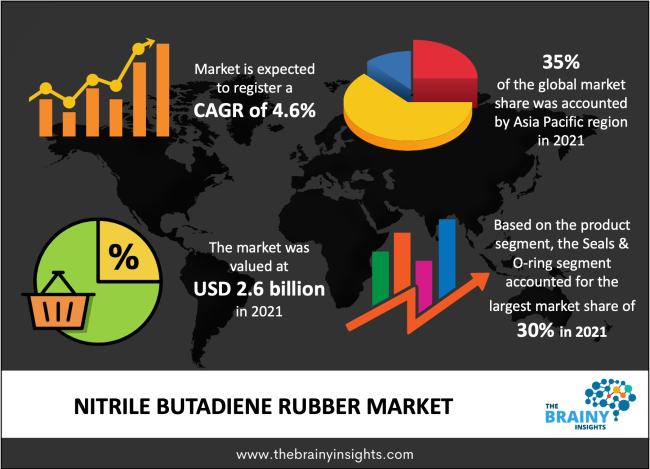
The nitrile butadiene rubber market was estimated at around 2.6 billion in 2021, growing at a CAGR of nearly 4.6% during 2022-2030. The market is projected to reach approximately USD 3.9 billion by 2030.
Buna-N or nitrile rubber, often known as nitrile butadiene rubber (NBR), is a synthetic rubber made by copolymerizing butadiene with acrylonitrile. A synthetic rubber made of acrylonitrile and butadiene; nitrile butadiene rubber is a copolymer. It possesses appropriate resilience and tensile strength, good to exceptional compression set resistance, good to excellent elongation qualities, but weak flame and steam resistance. In automobile seals, gaskets, and other components that come into contact with hot oils, high oil resistance is typically preferred. NBR is the perfect material for aeronautical applications because it can endure temperatures between 40 and 108 degrees Celsius. In the automotive and industrial industries, nitrile butadiene rubber is mostly utilized to make parts for dashboards, brake pads, kick panels, and other items. In these industries, it is referred to as the rubber products workforce. Its versatility includes a capacity to withstand a range of temperatures, which makes it helpful in aircraft applications. Nitrile butadiene rubber is a useful material for use in the nuclear industry because of its physical characteristics, such as hardness and rigidity. Along with stoppers, tubes, and supporting or cushioning materials for medical equipment, NBR is also utilized in these products.
One of the main causes of this growth is the rising demand for NBR products from the vehicle industry. In the automotive sector, NBR is widely utilized, and belts, O-rings, and cables are where it finds the most use. NBR provides good abrasion and low rolling resistance, which ensures high performance and is utilized in tire treads and sidewalls.
Get an overview of this study by requesting a free sample
The COVID-19 epidemic had a severe negative impact on the global automotive industry's sales and output. The global automotive production in 2020 was 7,77,11,725, according to data released by OICA, which represents a 15.5% decrease from the figures for the previous year. The global production in 2021 was 8,01,45,988 units, 3% more than in 2020, but 13% less than pre-COVID levels (2019). Nitrile butadiene rubber demand has decreased significantly as a result of COVID-19 due to supply chain interruptions and nationwide lockdowns. The hardest hit industries during the pandemic were the automotive and construction sectors, which had an impact on the NBR industry. China's industrial sector, on the other hand, has had strong demand growth as a result of the continuation of production activities after the lockdowns.
Increasing automobile and transportation industry demand to accelerate the market’s growth
One of the main industries using nitrile butadiene rubber is the automotive and transportation sector. NBR is utilized in the automotive and aerospace industries to create gasoline and oil handling hoses, seals, grommets, and self-sealing fuel tanks because standard rubbers cannot be employed. Aeronautical applications benefit greatly from NBR's capacity to endure temperatures between -40 and 108 °C (-40 and 226 °F). Automotive transmission belts are among the applications for nitrile rubber. In heavy-duty and military vehicles, NBR tires are frequently utilized. The basic qualities of controlled deformation, high strength, high affinity, and abrasion resistance are also utilized in coated tire cord fabrics.
Rising gloves demand
Because of increased investment in the healthcare business, there is likely to be an increase in demand for NBR gloves, notably in the medical sector. To prevent the transmission of pathogens into the patient's body during operations and examinations, gloves are frequently utilized. A further factor projected to speed up market value growth over the coming years is the increased demand for disposable gloves across a variety of industries, particularly in the food sector.
The nitrile butadiene rubber market is segmented into the product, and application. Based on product, the market for Seals & O-ring segment is estimated to lead the market during the forecast period. In order to provide a leak-proof seal between two components, seals and O-rings, mechanical gaskets with a round cross-section, are frequently used in pumps, cylinders, and other fluid applications. NBR seals and O-rings are among the most widely used sealing elastomers because of their resistance to fuels and lubricants made of petroleum, as well as their comparatively inexpensive cost. Widespread usage of NBR O-rings and seals in the manufacturing, oil and gas, and automotive industries has increased demand for NBR in these sectors.
By application, the automotive is anticipated to dominant the nitrile butadiene rubber market during the forecast period. Injection-molded and lathe-cut seals, cables, and other parts that must withstand high temperatures and corrosion all make use of nitrile butadiene rubber. The O-rings assist in sealing the connections between two components and stop internal vehicle leaks. The automotive industry is expanding as a result of the increased acceptance of electric vehicles and technical improvements, which will ultimately drive the market. In this regard, a large rise in the demand for NBR is anticipated due to rising environmental concerns as well as government support for the production and use of electric vehicles through subsidies and federal and state tax credits.
Throughout the projection period, Asia-Pacific is expected to remain one of the most alluring markets, and this region accounts for the majority revenue share in the market. The market is expanding in the Asia-Pacific region as a result of rising hospital admissions, personalized medicine preferences, the incidence of chronic illnesses, and technological advancements in medicine. The COVID-19 pandemic epidemic has had the biggest impact on the demand for NBR latex in the area. Natural rubber latex is being replaced by NBR latex, especially in the glove business, because it performs better even in challenging circumstances. Due to the expanding demand for this material from the automotive industry, China held the greatest market share in the region in 2021. Additionally, the nation is a sizable producer of both consumer and industrial goods globally. It outperforms other economies by a significant margin and is the world's fastest-growing consumer of goods and services. The sustained increases in industrial output, imports and exports, consumer spending, and capital investment are what are driving China's economy's rapid growth.
The global Nitrile butadiene rubber market is segmented as follows:
By Product
By Application
By Region/Geography
| Attribute | Description |
|---|---|
| Base Year | 2021 |
| Forecast period | 2022-2030 |
| Report Coverage | Revenue estimation and forecast, company profile, competitive landscape, growth factors, and recent trends |
| Regional scope | North America, Europe, Asia Pacific, Middle East & Africa, and Latin America |
| Market Size(unit) | USD Billion |
| CAGR (2022 to 2030) | 4.6% |
| Segments Covered |
By Product |
1. Introduction
1.1. Objectives of the Study
1.2. Market Definition
1.3. Research Scope
2. Research Methodology and Assumptions
3. Executive Summary
4. Premium Insights
4.1. Porter’s Five Forces Analysis
4.2. Value Chain Analysis
4.3. Top Investment Pockets
4.3.1. Market Attractiveness Analysis By Product
4.3.2. Market Attractiveness Analysis By Application
4.4. Industry Trends
5. Market Dynamics
5.1. Market Evaluation
5.2. Drivers
5.2.1. Increasing automobile and transportation industry demand to accelerate the market’s growth
5.2.2. Rising gloves demand
5.3. Restrains
5.3.1. Availability of substitute materials would hamper the market
5.4. Opportunities
5.4.1. Growing market
6. Global Nitrile Butadiene Rubber Market Analysis and Forecast, By Product
6.1. Segment Overview
6.2. Hoses
6.3. Belts
6.4. Cables
6.5. Molded
6.6. Seals & O-ring
6.7. Gloves
6.8. Others
7. Global Nitrile Butadiene Rubber Market Analysis and Forecast, By Application
7.1. Segment Overview
7.2. Automotive
7.3. Oil & Gas
7.4. Mining
7.5. Medical
7.6. Others
8. Global Nitrile Butadiene Rubber Market Analysis and Forecast, By Regional Analysis
8.1. Segment Overview
8.2. North America
8.2.1. U.S.
8.2.2. Canada
8.2.3. Mexico
8.3. Europe
8.3.1. Germany
8.3.2. France
8.3.3. U.K.
8.3.4. Italy
8.3.5. Spain
8.3.6. Rest of Europe
8.4. Asia-Pacific
8.4.1. Japan
8.4.2. China
8.4.3. India
8.4.4. Australia
8.4.5. South Korea
8.4.6. Rest of Asia-Pacific
8.5. South America
8.5.1. Brazil
8.5.2. Argentina
8.5.3. Rest of South America
8.6. Middle East and Africa
8.6.1. UAE
8.6.2. South Africa
8.6.3. Egypt
8.6.4. Kuwait
8.6.5. Saudi Arabia
8.6.6. Rest of Middle East & Africa
9. Global Nitrile Butadiene Rubber Market-Competitive Landscape
9.1. Overview
9.2. Market Share of Key Players in the Nitrile Butadiene Rubber market
9.2.1. Global Company Market Share
9.2.2. North America Company Market Share
9.2.3. Europe Company Market Share
9.2.4. APAC Company Market Share
9.3. Competitive Situations and Trends
9.3.1. Product Launches and Developments
9.3.2. Partnerships, Collaborations, and Agreements
9.3.3. Mergers & Acquisitions
9.3.4. Expansions
10. Company Profiles
10.1. ARLANXEO
10.1.1. Business Overview
10.1.2. Company Snapshot
10.1.3. Company Market Share Analysis
10.1.4. Company Application Portfolio
10.1.5. Recent Developments
10.1.6. SWOT Analysis
10.2. Zeon Chemicals L.P.
10.2.1. Business Overview
10.2.2. Company Snapshot
10.2.3. Company Market Share Analysis
10.2.4. Company Application Portfolio
10.2.5. Recent Developments
10.2.6. SWOT Analysis
10.3. Dynasol Group
10.3.1. Business Overview
10.3.2. Company Snapshot
10.3.3. Company Market Share Analysis
10.3.4. Company Application Portfolio
10.3.5. Recent Developments
10.3.6. SWOT Analysis
10.4. Synthos S.A.
10.4.1. Business Overview
10.4.2. Company Snapshot
10.4.3. Company Market Share Analysis
10.4.4. Company Application Portfolio
10.4.5. Recent Developments
10.4.6. SWOT Analysis
10.5. LG Chem
10.5.1. Business Overview
10.5.2. Company Snapshot
10.5.3. Company Market Share Analysis
10.5.4. Company Application Portfolio
10.5.5. Recent Developments
10.5.6. SWOT Analysis
10.6. JSR Corporation
10.6.1. Business Overview
10.6.2. Company Snapshot
10.6.3. Company Market Share Analysis
10.6.4. Company Application Portfolio
10.6.5. Recent Developments
10.6.6. SWOT Analysis
10.7. Atlantic Gasket Corporation
10.7.1. Business Overview
10.7.2. Company Snapshot
10.7.3. Company Market Share Analysis
10.7.4. Company Application Portfolio
10.7.5. Recent Developments
10.7.6. SWOT Analysis
10.8. Hanna Rubber Company
10.8.1. Business Overview
10.8.2. Company Snapshot
10.8.3. Company Market Share Analysis
10.8.4. Company Application Portfolio
10.8.5. Recent Developments
10.8.6. SWOT Analysis
10.9. Precision Associates Inc.
10.9.1. Business Overview
10.9.2. Company Snapshot
10.9.3. Company Market Share Analysis
10.9.4. Company Application Portfolio
10.9.5. Recent Developments
10.9.6. SWOT Analysis
10.10. Anqing Hualan Technology Co., Ltd.
10.10.1. Business Overview
10.10.2. Company Snapshot
10.10.3. Company Market Share Analysis
10.10.4. Company Application Portfolio
10.10.5. Recent Developments
10.10.6. SWOT Analysis
List of Table
1. Global Nitrile Butadiene Rubber Market, By Product, 2022-2030(USD Billion)
2. Global Hoses Nitrile Butadiene Rubber Market, By Region, 2022-2030(USD Billion)
3. Global Belts Nitrile Butadiene Rubber Market, By Region, 2022-2030(USD Billion)
4. Global Cables Nitrile Butadiene Rubber Market, By Region, 2022-2030(USD Billion)
5. Global Molded Nitrile Butadiene Rubber Market, By Region, 2022-2030(USD Billion)
6. Global Seals & O-ring Nitrile Butadiene Rubber Market, By Region, 2022-2030(USD Billion)
7. Global Gloves Nitrile Butadiene Rubber Market, By Region, 2022-2030(USD Billion)
8. Global Others Nitrile Butadiene Rubber Market, By Region, 2022-2030(USD Billion)
9. Global Nitrile Butadiene Rubber Market, By Application, 2022-2030(USD Billion)
10. Global Automotive Nitrile Butadiene Rubber Market, By Region, 2022-2030(USD Billion)
11. Global Oil & Gas Nitrile Butadiene Rubber Market, By Region, 2022-2030(USD Billion)
12. Global Mining Nitrile Butadiene Rubber Market, By Region, 2022-2030(USD Billion)
13. Global Medical Nitrile Butadiene Rubber Market, By Region, 2022-2030(USD Billion)
14. Global Others Nitrile Butadiene Rubber Market, By Region, 2022-2030(USD Billion)
15. Global Nitrile Butadiene Rubber Market, By Region, 2022-2030(USD Billion)
16. Global Nitrile Butadiene Rubber Market, By North America, 2022-2030(USD Billion)
17. North America Nitrile Butadiene Rubber Market, By Product, 2022-2030(USD Billion)
18. North America Nitrile Butadiene Rubber Market, By Application, 2022-2030(USD Billion)
19. U.S. Nitrile Butadiene Rubber Market, By Product, 2022-2030(USD Billion)
20. U.S. Nitrile Butadiene Rubber Market, By Application, 2022-2030(USD Billion)
21. Canada Nitrile Butadiene Rubber Market, By Product, 2022-2030(USD Billion)
22. Canada Nitrile Butadiene Rubber Market, By Application, 2022-2030(USD Billion)
23. Mexico Nitrile Butadiene Rubber Market, By Product, 2022-2030(USD Billion)
24. Mexico Nitrile Butadiene Rubber Market, By Application, 2022-2030(USD Billion)
25. Europe Nitrile Butadiene Rubber Market, By Product, 2022-2030(USD Billion)
26. Europe Nitrile Butadiene Rubber Market, By Application, 2022-2030(USD Billion)
27. Germany Nitrile Butadiene Rubber Market, By Product, 2022-2030(USD Billion)
28. Germany Nitrile Butadiene Rubber Market, By Application, 2022-2030(USD Billion)
29. France Nitrile Butadiene Rubber Market, By Product, 2022-2030(USD Billion)
30. France Nitrile Butadiene Rubber Market, By Application, 2022-2030(USD Billion)
31. U.K. Nitrile Butadiene Rubber Market, By Product, 2022-2030(USD Billion)
32. U.K. Nitrile Butadiene Rubber Market, By Application, 2022-2030(USD Billion)
33. Italy Nitrile Butadiene Rubber Market, By Product, 2022-2030(USD Billion)
34. Italy Nitrile Butadiene Rubber Market, By Application, 2022-2030(USD Billion)
35. Spain Nitrile Butadiene Rubber Market, By Product, 2022-2030(USD Billion)
36. Spain Nitrile Butadiene Rubber Market, By Application, 2022-2030(USD Billion)
37. Rest of Europe Nitrile Butadiene Rubber Market, By Product, 2022-2030(USD Billion)
38. Rest of Europe Nitrile Butadiene Rubber Market, By Application, 2022-2030(USD Billion)
39. Asia Pacific Nitrile Butadiene Rubber Market, By Product, 2022-2030(USD Billion)
40. Asia Pacific Nitrile Butadiene Rubber Market, By Application, 2022-2030(USD Billion)
41. Japan Nitrile Butadiene Rubber Market, By Product, 2022-2030(USD Billion)
42. Japan Nitrile Butadiene Rubber Market, By Application, 2022-2030(USD Billion)
43. China Nitrile Butadiene Rubber Market, By Product, 2022-2030(USD Billion)
44. China Nitrile Butadiene Rubber Market, By Application, 2022-2030(USD Billion)
45. India Nitrile Butadiene Rubber Market, By Product, 2022-2030(USD Billion)
46. India Nitrile Butadiene Rubber Market, By Application, 2022-2030(USD Billion)
47. Australia Nitrile Butadiene Rubber Market, By Product, 2022-2030(USD Billion)
48. Australia Nitrile Butadiene Rubber Market, By Application, 2022-2030(USD Billion)
49. South Korea Nitrile Butadiene Rubber Market, By Product, 2022-2030(USD Billion)
50. South Korea Nitrile Butadiene Rubber Market, By Application, 2022-2030(USD Billion)
51. Rest of Asia-Pacific Nitrile Butadiene Rubber Market, By Product, 2022-2030(USD Billion)
52. Rest of Asia-Pacific Nitrile Butadiene Rubber Market, By Application, 2022-2030(USD Billion)
53. South America Nitrile Butadiene Rubber Market, By Product, 2022-2030(USD Billion)
54. South America Nitrile Butadiene Rubber Market, By Application, 2022-2030(USD Billion)
55. Brazil Nitrile Butadiene Rubber Market, By Product, 2022-2030(USD Billion)
56. Brazil Nitrile Butadiene Rubber Market, By Application, 2022-2030(USD Billion)
57. Argentina Nitrile Butadiene Rubber Market, By Product, 2022-2030(USD Billion)
58. Argentina Nitrile Butadiene Rubber Market, By Application, 2022-2030(USD Billion)
59. Rest of Latin America Nitrile Butadiene Rubber Market, By Product, 2022-2030(USD Billion)
60. Rest of Latin America Nitrile Butadiene Rubber Market, By Application, 2022-2030(USD Billion)
61. Middle East and Africa Nitrile Butadiene Rubber Market, By Product, 2022-2030(USD Billion)
62. Middle East and Africa Nitrile Butadiene Rubber Market, By Application, 2022-2030(USD Billion)
63. UAE Nitrile Butadiene Rubber Market, By Product, 2022-2030(USD Billion)
64. UAE Nitrile Butadiene Rubber Market, By Application, 2022-2030(USD Billion)
65. South Africa Nitrile Butadiene Rubber Market, By Product, 2022-2030(USD Billion)
66. South Africa Nitrile Butadiene Rubber Market, By Application, 2022-2030(USD Billion)
67. Egypt Nitrile Butadiene Rubber Market, By Product, 2022-2030(USD Billion)
68. Egypt Nitrile Butadiene Rubber Market, By Application, 2022-2030(USD Billion)
69. Kuwait Nitrile Butadiene Rubber Market, By Product, 2022-2030(USD Billion)
70. Kuwait Nitrile Butadiene Rubber Market, By Application, 2022-2030(USD Billion)
71. Saudi Arabia Nitrile Butadiene Rubber Market, By Product, 2022-2030(USD Billion)
72. Saudi Arabia Nitrile Butadiene Rubber Market, By Application, 2022-2030(USD Billion)
73. Rest of Middle East Nitrile Butadiene Rubber Market, By Product, 2022-2030(USD Billion)
74. Rest of Middle East Nitrile Butadiene Rubber Market, By Application, 2022-2030(USD Billion)
List of Figures
1. Global Nitrile Butadiene Rubber Market Segmentation
2. Nitrile Butadiene Rubber Market: Research Methodology
3. Market Size Estimation Methodology: Bottom-Up Approach
4. Market Size Estimation Methodology: Top-Down Approach
5. Data Triangulation
6. Porter’s Five Forces Analysis
7. Value Chain Analysis
8. Global Nitrile Butadiene Rubber Market Attractiveness Analysis By Product
9. Global Nitrile Butadiene Rubber Market Attractiveness Analysis By Application
10. Global Nitrile Butadiene Rubber Market Attractiveness Analysis By Region
11. Global Nitrile Butadiene Rubber Market: Dynamics
12. Global Nitrile Butadiene Rubber Market Share By Product(2022 & 2030)
13. Global Nitrile Butadiene Rubber Market Share By Application(2022 & 2030)
14. Global Nitrile Butadiene Rubber Market Share by Regions (2022 & 2030)
15. Global Nitrile Butadiene Rubber Market Share by Company (2021)
By Product
By Application
By Region/Geography
Research has its special purpose to undertake marketing efficiently. In this competitive scenario, businesses need information across all industry verticals; the information about customer wants, market demand, competition, industry trends, distribution channels etc. This information needs to be updated regularly because businesses operate in a dynamic environment. Our organization, The Brainy Insights incorporates scientific and systematic research procedures in order to get proper market insights and industry analysis for overall business success. The analysis consists of studying the market from a miniscule level wherein we implement statistical tools which helps us in examining the data with accuracy and precision.
Our research reports feature both; quantitative and qualitative aspects for any market. Qualitative information for any market research process are fundamental because they reveal the customer needs and wants, usage and consumption for any product/service related to a specific industry. This in turn aids the marketers/investors in knowing certain perceptions of the customers. Qualitative research can enlighten about the different product concepts and designs along with unique service offering that in turn, helps define marketing problems and generate opportunities. On the other hand, quantitative research engages with the data collection process through interviews, e-mail interactions, surveys and pilot studies. Quantitative aspects for the market research are useful to validate the hypotheses generated during qualitative research method, explore empirical patterns in the data with the help of statistical tools, and finally make the market estimations.
The Brainy Insights offers comprehensive research and analysis, based on a wide assortment of factual insights gained through interviews with CXOs and global experts and secondary data from reliable sources. Our analysts and industry specialist assume vital roles in building up statistical tools and analysis models, which are used to analyse the data and arrive at accurate insights with exceedingly informative research discoveries. The data provided by our organization have proven precious to a diverse range of companies, facilitating them to address issues such as determining which products/services are the most appealing, whether or not customers use the product in the manner anticipated, the purchasing intentions of the market and many others.
Our research methodology encompasses an idyllic combination of primary and secondary initiatives. Key phases involved in this process are listed below:

The phase involves the gathering and collecting of market data and its related information with the help of different sources & research procedures.

The data procurement stage involves in data gathering and collecting through various data sources.
This stage involves in extensive research. These data sources includes:
Purchased Database: Purchased databases play a crucial role in estimating the market sizes irrespective of the domain. Our purchased database includes:
Primary Research: The Brainy Insights interacts with leading companies and experts of the concerned domain to develop the analyst team’s market understanding and expertise. It improves and substantiates every single data presented in the market reports. Primary research mainly involves in telephonic interviews, E-mail interactions and face-to-face interviews with the raw material providers, manufacturers/producers, distributors, & independent consultants. The interviews that we conduct provides valuable data on market size and industry growth trends prevailing in the market. Our organization also conducts surveys with the various industry experts in order to gain overall insights of the industry/market. For instance, in healthcare industry we conduct surveys with the pharmacists, doctors, surgeons and nurses in order to gain insights and key information of a medical product/device/equipment which the customers are going to usage. Surveys are conducted in the form of questionnaire designed by our own analyst team. Surveys plays an important role in primary research because surveys helps us to identify the key target audiences of the market. Additionally, surveys helps to identify the key target audience engaged with the market. Our survey team conducts the survey by targeting the key audience, thus gaining insights from them. Based on the perspectives of the customers, this information is utilized to formulate market strategies. Moreover, market surveys helps us to understand the current competitive situation of the industry. To be precise, our survey process typically involve with the 360 analysis of the market. This analytical process begins by identifying the prospective customers for a product or service related to the market/industry to obtain data on how a product/service could fit into customers’ lives.

Secondary Research: The secondary data sources includes information published by the on-profit organizations such as World bank, WHO, company fillings, investor presentations, annual reports, national government documents, statistical databases, blogs, articles, white papers and others. From the annual report, we analyse a company’s revenue to understand the key segment and market share of that organization in a particular region. We analyse the company websites and adopt the product mapping technique which is important for deriving the segment revenue. In the product mapping method, we select and categorize the products offered by the companies catering to domain specific market, deduce the product revenue for each of the companies so as to get overall estimation of the market size. We also source data and analyses trends based on information received from supply side and demand side intermediaries in the value chain. The supply side denotes the data gathered from supplier, distributor, wholesaler and the demand side illustrates the data gathered from the end customers for respective market domain.

The supply side for a domain specific market is analysed by:
The demand side for the market is estimated through:
In-house Library: Apart from these third-party sources, we have our in-house library of qualitative and quantitative information. Our in-house database includes market data for various industry and domains. These data are updated on regular basis as per the changing market scenario. Our library includes, historic databases, internal audit reports and archives.
Sometimes there are instances where there is no metadata or raw data available for any domain specific market. For those cases, we use our expertise to forecast and estimate the market size in order to generate comprehensive data sets. Our analyst team adopt a robust research technique in order to produce the estimates:
Data Synthesis: This stage involves the analysis & mapping of all the information obtained from the previous step. It also involves in scrutinizing the data for any discrepancy observed while data gathering related to the market. The data is collected with consideration to the heterogeneity of sources. Robust scientific techniques are in place for synthesizing disparate data sets and provide the essential contextual information that can orient market strategies. The Brainy Insights has extensive experience in data synthesis where the data passes through various stages:


Market Deduction & Formulation: The final stage comprises of assigning data points at appropriate market spaces so as to deduce feasible conclusions. Analyst perspective & subject matter expert based holistic form of market sizing coupled with industry analysis also plays a crucial role in this stage.
This stage involves in finalization of the market size and numbers that we have collected from data integration step. With data interpolation, it is made sure that there is no gap in the market data. Successful trend analysis is done by our analysts using extrapolation techniques, which provide the best possible forecasts for the market.
Data Validation & Market Feedback: Validation is the most important step in the process. Validation & re-validation via an intricately designed process helps us finalize data-points to be used for final calculations.

The Brainy Insights interacts with leading companies and experts of the concerned domain to develop the analyst team’s market understanding and expertise. It improves and substantiates every single data presented in the market reports. The data validation interview and discussion panels are typically composed of the most experienced industry members. The participants include, however, are not limited to:
Moreover, we always validate our data and findings through primary respondents from all the major regions we are working on.


Free Customization
Fortune 500 Clients
Free Yearly Update On Purchase Of Multi/Corporate License
Companies Served Till Date