- +1-315-215-1633
- sales@thebrainyinsights.com

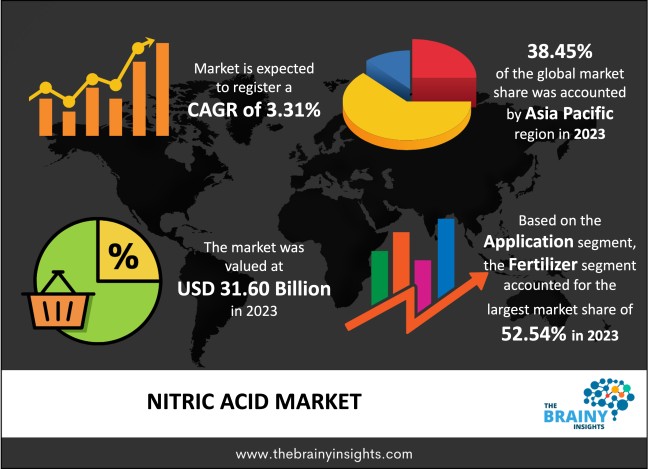
The global nitric acid market was valued at USD 31.60 billion in 2023 and grew at a CAGR of 3.31% from 2024 to 2033. The market is expected to reach USD 43.77 billion by 2033. The increasing demand for fertilizers will drive the growth of the global nitric acid market.
Nitric acid is an inorganic substance. Its chemical formula is HNO3. It is a mineral acid that is corrosive and colourless. Nitric acid is a powerful oxidant and a good conductor of electricity. The colour of nitric acid can range from bright yellow to a deeper brown. The majority of nitric acid that is sold commercially has a 68% concentration in water. Nitric acid has several industrial applications. The advantages of NO have largely been attained in synthesising the salt ammonium nitrate, NH4NO3, which is used in producing fertilizers and explosives, is the most significant industrial usage of nitric acid. Nitric acid is also used in metal-refining and soda production industries. It is a typical laboratory reagent as well. It serves as an oxidizer in liquid-fuelled rockets. Nitric acid is also used to produce adhesives that are essential in the packaging industry. Nitric acid can be used to treat boils and warts. Diluted nitric acid can be sued to cure indigestion. Nitric acid and alcohol can be used to engrave patterns into various metals, including copper, bronze, and brass, contributing to its demand from the décor industry. Nitric acid is also used to identify drugs in spot tests. The main ingredient in furniture varnish is nitric acid. It is then frequently utilized as a lacquer.
Get an overview of this study by requesting a free sample
The increasing demand for fertilizers – the global food shortages brought on by the covid-19 pandemic-induced restrictions and the Russia-Ukraine war highlighted the importance of self-sufficiency in food. Furthermore, the climate change crisis and, changing monsoon patterns, extreme weather conditions have increased the risks of crop damage, making food a national interest. Therefore, introducing fertiliser subsidies will benefit the global nitric acid market. Furthermore, the rising focus on improving fertilisers' production capacity to meet the agricultural industry's needs will also augment the market's growth.
The shift towards organic farming – the excess and exploitative use of chemical fertilizers, pesticides and genetically modified seeds has negatively affected soil and overall food quality. The growing awareness about these effects has increased the demand for organic produce devoid of such chemicals and healthier. The increasing demand for organic produce has contributed to the growing adoption of organic farming, which relies on organic fertilizers like manure, seaweed, and straws. The shift towards organic farming will significantly impact the demand for nitric acid, which will impede the market’s growth.
The growing applications of nitric acid – the growing agricultural yields are attributed to healthy amounts of fertilizers with the correct NPK ratio being used to improve soil health. This has contributed positively towards the growth of the nitric acid market. Similarly, the growth of the textile, defence, construction and packaging industry will bode well for nitric acid. The introduction of favourable schemes and increased funding for the growth of the textile industry by governments of developing nations is a case in point. Similarly, the increasing infrastructural spending of the government and private players will boost the building and construction market. The positive growth in these segments will augment the global nitric acid market's growth and development in the forecast period.
The regions analyzed for the market include North America, Europe, South America, Asia Pacific, the Middle East, and Africa. Asia Pacific emerged as the most significant global nitric acid market, with a 38.45% market revenue share in 2023.
India and China are among the top wheat, rice, cotton and sugarcane producers. These crops use more fertilizers than other grains, cereals and cash crops. Furthermore, the South and East Asian economies of Vietnam, Laos, and Thailand are significant rice producers. The extensive and thriving agriculture sector contributes to the regional nitric acid market's growth. Additionally, India, China, Bangladesh and Vietnam are dominant textiles producers, furthering the regional nitric acid market's development.
Asia Pacific Region Nitric Acid Market Share in 2023 – 38.45%
www.thebrainyinsights.com
Check the geographical analysis of this market by requesting a free sample
The application segment is divided into fertilizers, adipic acid, nitrobenzene, toluene Di-isocyanate, and others. The fertilizer segment dominated, with a market share of around 52.54% in 2023. fertilizers include nitrogen, potassium, and phosphorus, crucial elements plants need. Nitrogen constitutes the majority of proportion in fertilizers, given plants' high demand for nitrogen for their growth and nutrition. By giving the soil the proper mix of nutrients, fertilizers increase output and ensure healthy food. Without fertilizers, the soil would become impoverished, making it particularly challenging to grow plants. Fertilizers provide nutrients that the soil lacks, replenish the nutrients lost during harvest and improve the quality and nutrient content of the plants. They offer better yield results, reducing production costs and retail costs of food production. The food crisis worldwide has highlighted the importance of a self-sufficient nation in producing and feeding its population, contributing to the rising initiatives at improving agriculture, thereby augmenting the fertilizer segment's growth.
| Attribute | Description |
|---|---|
| Market Size | Revenue (USD Billion) |
| Market size value in 2023 | USD 31.60 Billion |
| Market size value in 2033 | USD 43.77 Billion |
| CAGR (2024 to 2033) | 3.31% |
| Historical data | 2020-2022 |
| Base Year | 2023 |
| Forecast | 2024-2033 |
| Region | The regions analyzed for the market are Asia Pacific, Europe, South America, North America, and Middle East & Africa. Furthermore, the regions are further analyzed at the country level. |
| Segments | Application |
As per The Brainy Insights, the size of the global nitric acid market was valued at USD 31.60 billion in 2023 to USD 43.77 billion by 2033.
Global nitric acid market is growing at a CAGR of 3.31% during the forecast period 2024-2033.
The market's growth will be influenced by the increasing demand for fertilizers.
The shift towards organic farming could hamper the market growth.
1. Introduction
1.1. Objectives of the Study
1.2. Market Definition
1.3. Research Scope
1.4. Currency
1.5. Key Target Audience
2. Research Methodology and Assumptions
3. Executive Summary
4. Premium Insights
4.1. Porter’s Five Forces Analysis
4.2. Value Chain Analysis
4.3. Top Investment Pockets
4.3.1. Market Attractiveness Analysis By Application
4.3.2. Market Attractiveness Analysis By Region
4.4. Industry Trends
5. Market Dynamics
5.1. Market Evaluation
5.2. Drivers
5.2.1. The increasing demand for fertilizers
5.3. Restraints
5.3.1. The shift towards organic farming
5.4. Opportunities
5.4.1. The growing applications of nitric acid
5.5. Challenges
5.5.1. Haphazard policy decisions
6. Global Nitric Acid Market Analysis and Forecast, By Application
6.1. Segment Overview
6.2. Fertilizers
6.3. Adipic Acid
6.4. Nitrobenzene
6.5. Toluene Di-Isocyanate
6.6. Others
7. Global Nitric Acid Market Analysis and Forecast, By Regional Analysis
7.1. Segment Overview
7.2. North America
7.2.1. U.S.
7.2.2. Canada
7.2.3. Mexico
7.3. Europe
7.3.1. Germany
7.3.2. France
7.3.3. U.K.
7.3.4. Italy
7.3.5. Spain
7.4. Asia-Pacific
7.4.1. Japan
7.4.2. China
7.4.3. India
7.5. South America
7.5.1. Brazil
7.6. Middle East and Africa
7.6.1. UAE
7.6.2. South Africa
8. Global Nitric Acid Market-Competitive Landscape
8.1. Overview
8.2. Market Share of Key Players in the Nitric Acid Market
8.2.1. Global Company Market Share
8.2.2. North America Company Market Share
8.2.3. Europe Company Market Share
8.2.4. APAC Company Market Share
8.3. Competitive Situations and Trends
8.3.1. Product Launches and Developments
8.3.2. Partnerships, Collaborations, and Agreements
8.3.3. Mergers & Acquisitions
8.3.4. Expansions
9. Company Profiles
9.1. BASF SE
9.1.1. Business Overview
9.1.2. Company Snapshot
9.1.3. Company Market Share Analysis
9.1.4. Company Product Portfolio
9.1.5. Recent Developments
9.1.6. SWOT Analysis
9.2. CF Industry Holdings, Inc
9.2.1. Business Overview
9.2.2. Company Snapshot
9.2.3. Company Market Share Analysis
9.2.4. Company Product Portfolio
9.2.5. Recent Developments
9.2.6. SWOT Analysis
9.3. Deepak Fertilisers and Petrochemicals Corporation Ltd (DFPCL)
9.3.1. Business Overview
9.3.2. Company Snapshot
9.3.3. Company Market Share Analysis
9.3.4. Company Product Portfolio
9.3.5. Recent Developments
9.3.6. SWOT Analysis
9.4. Dyno Nobel
9.4.1. Business Overview
9.4.2. Company Snapshot
9.4.3. Company Market Share Analysis
9.4.4. Company Product Portfolio
9.4.5. Recent Developments
9.4.6. SWOT Analysis
9.5. Enaex S.A.
9.5.1. Business Overview
9.5.2. Company Snapshot
9.5.3. Company Market Share Analysis
9.5.4. Company Product Portfolio
9.5.5. Recent Developments
9.5.6. SWOT Analysis
9.6. IXOM Ltd.
9.6.1. Business Overview
9.6.2. Company Snapshot
9.6.3. Company Market Share Analysis
9.6.4. Company Product Portfolio
9.6.5. Recent Developments
9.6.6. SWOT Analysis
9.7. LSB Industries
9.7.1. Business Overview
9.7.2. Company Snapshot
9.7.3. Company Market Share Analysis
9.7.4. Company Product Portfolio
9.7.5. Recent Developments
9.7.6. SWOT Analysis
9.8. Nutrien Ltd.
9.8.1. Business Overview
9.8.2. Company Snapshot
9.8.3. Company Market Share Analysis
9.8.4. Company Product Portfolio
9.8.5. Recent Developments
9.8.6. SWOT Analysis
9.9. Omnia Holding Limited
9.9.1. Business Overview
9.9.2. Company Snapshot
9.9.3. Company Market Share Analysis
9.9.4. Company Product Portfolio
9.9.5. Recent Developments
9.9.6. SWOT Analysis
9.10. Sasol
9.10.1. Business Overview
9.10.2. Company Snapshot
9.10.3. Company Market Share Analysis
9.10.4. Company Component Portfolio
9.10.5. Recent Developments
9.10.6. SWOT Analysis
List of Table
1. Global Nitric Acid Market, By Application, 2020-2033 (USD Billion)
2. Global Fertilizers Nitric Acid Market, By Region, 2020-2033 (USD Billion)
3. Global Adipic Acid Nitric Acid Market, By Region, 2020-2033 (USD Billion)
4. Global Nitrobenzene Nitric Acid Market, By Region, 2020-2033 (USD Billion)
5. Global Toluene Di-Isocyanate Nitric Acid Market, By Region, 2020-2033 (USD Billion)
6. Global Others Nitric Acid Market, By Region, 2020-2033 (USD Billion)
7. Global Nitric Acid Market, By Region, 2020-2033 (USD Billion)
8. North America Nitric Acid Market, By Application, 2020-2033 (USD Billion)
9. U.S. Nitric Acid Market, By Application, 2020-2033 (USD Billion)
10. Canada Nitric Acid Market, By Application, 2020-2033 (USD Billion)
11. Mexico Nitric Acid Market, By Application, 2020-2033 (USD Billion)
12. Europe Nitric Acid Market, By Application, 2020-2033 (USD Billion)
13. Germany Nitric Acid Market, By Application, 2020-2033 (USD Billion)
14. France Nitric Acid Market, By Application, 2020-2033 (USD Billion)
15. U.K. Nitric Acid Market, By Application, 2020-2033 (USD Billion)
16. Italy Nitric Acid Market, By Application, 2020-2033 (USD Billion)
17. Spain Nitric Acid Market, By Application, 2020-2033 (USD Billion)
18. Asia Pacific Nitric Acid Market, By Application, 2020-2033 (USD Billion)
19. Japan Nitric Acid Market, By Application, 2020-2033 (USD Billion)
20. China Nitric Acid Market, By Application, 2020-2033 (USD Billion)
21. India Nitric Acid Market, By Application, 2020-2033 (USD Billion)
22. South America Nitric Acid Market, By Application, 2020-2033 (USD Billion)
23. Brazil Nitric Acid Market, By Application, 2020-2033 (USD Billion)
24. Middle East and Africa Nitric Acid Market, By Application, 2020-2033 (USD Billion)
25. UAE Nitric Acid Market, By Application, 2020-2033 (USD Billion)
26. South Africa Nitric Acid Market, By Application, 2020-2033 (USD Billion)
List of Figures
1. Global Nitric Acid Market Segmentation
2. Nitric Acid Market: Research Methodology
3. Market Size Estimation Methodology: Bottom-Up Approach
4. Market Size Estimation Methodology: Top-Down Approach
5. Data Triangulation
6. Porter’s Five Forces Analysis
7. Value Chain Analysis
8. Global Nitric Acid Market Attractiveness Analysis By Application
9. Global Nitric Acid Market Attractiveness Analysis By Region
10. Global Nitric Acid Market: Dynamics
11. Global Nitric Acid Market Share by Application (2023 & 2033)
12. Global Nitric Acid Market Share by Regions (2023 & 2033)
13. Global Nitric Acid Market Share by Company (2023)
This study forecasts revenue at global, regional, and country levels from 2020 to 2033. The Brainy Insights has segmented the global nitric acid market based on below mentioned segments:
Global Nitric Acid Market by Application:
Global Nitric Acid Market by Region:
Research has its special purpose to undertake marketing efficiently. In this competitive scenario, businesses need information across all industry verticals; the information about customer wants, market demand, competition, industry trends, distribution channels etc. This information needs to be updated regularly because businesses operate in a dynamic environment. Our organization, The Brainy Insights incorporates scientific and systematic research procedures in order to get proper market insights and industry analysis for overall business success. The analysis consists of studying the market from a miniscule level wherein we implement statistical tools which helps us in examining the data with accuracy and precision.
Our research reports feature both; quantitative and qualitative aspects for any market. Qualitative information for any market research process are fundamental because they reveal the customer needs and wants, usage and consumption for any product/service related to a specific industry. This in turn aids the marketers/investors in knowing certain perceptions of the customers. Qualitative research can enlighten about the different product concepts and designs along with unique service offering that in turn, helps define marketing problems and generate opportunities. On the other hand, quantitative research engages with the data collection process through interviews, e-mail interactions, surveys and pilot studies. Quantitative aspects for the market research are useful to validate the hypotheses generated during qualitative research method, explore empirical patterns in the data with the help of statistical tools, and finally make the market estimations.
The Brainy Insights offers comprehensive research and analysis, based on a wide assortment of factual insights gained through interviews with CXOs and global experts and secondary data from reliable sources. Our analysts and industry specialist assume vital roles in building up statistical tools and analysis models, which are used to analyse the data and arrive at accurate insights with exceedingly informative research discoveries. The data provided by our organization have proven precious to a diverse range of companies, facilitating them to address issues such as determining which products/services are the most appealing, whether or not customers use the product in the manner anticipated, the purchasing intentions of the market and many others.
Our research methodology encompasses an idyllic combination of primary and secondary initiatives. Key phases involved in this process are listed below:

The phase involves the gathering and collecting of market data and its related information with the help of different sources & research procedures.

The data procurement stage involves in data gathering and collecting through various data sources.
This stage involves in extensive research. These data sources includes:
Purchased Database: Purchased databases play a crucial role in estimating the market sizes irrespective of the domain. Our purchased database includes:
Primary Research: The Brainy Insights interacts with leading companies and experts of the concerned domain to develop the analyst team’s market understanding and expertise. It improves and substantiates every single data presented in the market reports. Primary research mainly involves in telephonic interviews, E-mail interactions and face-to-face interviews with the raw material providers, manufacturers/producers, distributors, & independent consultants. The interviews that we conduct provides valuable data on market size and industry growth trends prevailing in the market. Our organization also conducts surveys with the various industry experts in order to gain overall insights of the industry/market. For instance, in healthcare industry we conduct surveys with the pharmacists, doctors, surgeons and nurses in order to gain insights and key information of a medical product/device/equipment which the customers are going to usage. Surveys are conducted in the form of questionnaire designed by our own analyst team. Surveys plays an important role in primary research because surveys helps us to identify the key target audiences of the market. Additionally, surveys helps to identify the key target audience engaged with the market. Our survey team conducts the survey by targeting the key audience, thus gaining insights from them. Based on the perspectives of the customers, this information is utilized to formulate market strategies. Moreover, market surveys helps us to understand the current competitive situation of the industry. To be precise, our survey process typically involve with the 360 analysis of the market. This analytical process begins by identifying the prospective customers for a product or service related to the market/industry to obtain data on how a product/service could fit into customers’ lives.

Secondary Research: The secondary data sources includes information published by the on-profit organizations such as World bank, WHO, company fillings, investor presentations, annual reports, national government documents, statistical databases, blogs, articles, white papers and others. From the annual report, we analyse a company’s revenue to understand the key segment and market share of that organization in a particular region. We analyse the company websites and adopt the product mapping technique which is important for deriving the segment revenue. In the product mapping method, we select and categorize the products offered by the companies catering to domain specific market, deduce the product revenue for each of the companies so as to get overall estimation of the market size. We also source data and analyses trends based on information received from supply side and demand side intermediaries in the value chain. The supply side denotes the data gathered from supplier, distributor, wholesaler and the demand side illustrates the data gathered from the end customers for respective market domain.

The supply side for a domain specific market is analysed by:
The demand side for the market is estimated through:
In-house Library: Apart from these third-party sources, we have our in-house library of qualitative and quantitative information. Our in-house database includes market data for various industry and domains. These data are updated on regular basis as per the changing market scenario. Our library includes, historic databases, internal audit reports and archives.
Sometimes there are instances where there is no metadata or raw data available for any domain specific market. For those cases, we use our expertise to forecast and estimate the market size in order to generate comprehensive data sets. Our analyst team adopt a robust research technique in order to produce the estimates:
Data Synthesis: This stage involves the analysis & mapping of all the information obtained from the previous step. It also involves in scrutinizing the data for any discrepancy observed while data gathering related to the market. The data is collected with consideration to the heterogeneity of sources. Robust scientific techniques are in place for synthesizing disparate data sets and provide the essential contextual information that can orient market strategies. The Brainy Insights has extensive experience in data synthesis where the data passes through various stages:


Market Deduction & Formulation: The final stage comprises of assigning data points at appropriate market spaces so as to deduce feasible conclusions. Analyst perspective & subject matter expert based holistic form of market sizing coupled with industry analysis also plays a crucial role in this stage.
This stage involves in finalization of the market size and numbers that we have collected from data integration step. With data interpolation, it is made sure that there is no gap in the market data. Successful trend analysis is done by our analysts using extrapolation techniques, which provide the best possible forecasts for the market.
Data Validation & Market Feedback: Validation is the most important step in the process. Validation & re-validation via an intricately designed process helps us finalize data-points to be used for final calculations.

The Brainy Insights interacts with leading companies and experts of the concerned domain to develop the analyst team’s market understanding and expertise. It improves and substantiates every single data presented in the market reports. The data validation interview and discussion panels are typically composed of the most experienced industry members. The participants include, however, are not limited to:
Moreover, we always validate our data and findings through primary respondents from all the major regions we are working on.


Free Customization
Fortune 500 Clients
Free Yearly Update On Purchase Of Multi/Corporate License
Companies Served Till Date