- +1-315-215-1633
- sales@thebrainyinsights.com

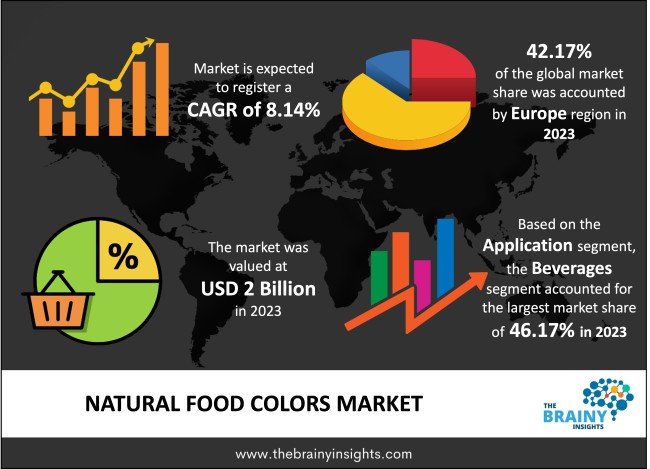
The global natural food colors market was valued at USD 2 billion in 2023 and grew at a CAGR of 8.14% from 2024 to 2033. Due to the rising demand for confectionery and bakery items, the natural food colors market is anticipated to expand quickly throughout the projected period. Additionally, strict laws against the use of artificial and similar colors are probably going to become the main force behind industrial expansion. Additionally, customers' fear of contracting an infection from consuming more imported goods with strange and unidentified ingredient origins has increased the popularity of locally produced food. This has helped local producers of natural food colors as well as potential entrants in the food business.
Because of growing consumer awareness of clean labels and natural products, as well as rising demand for them, the demand for natural food colors is growing quickly. Customers are increasingly looking for food and beverage goods that are made from natural ingredients and don't include any artificial additives. Due to possible health hazards and concerns about negative impacts on children's behavior, artificial food colors have come under criticism. Because they are derived from extracts of plants, vegetables, fruits, and other natural sources, natural food colors are seen as safer and healthier options.
Get an overview of this study by requesting a free sample
Customers are paying closer focus to the components in the food and drinks they consume. Products made from natural sources and without artificial additives are becoming more and more in demand. This trend is in line with natural food colors, which provide a safer and more organic alternative to chemical colorants. Consumers are actively looking for better food and beverage alternatives due to an increase in health awareness. Given that they come from plant, or mineral sources and do not carry the same potential health hazards as chemical colorants, natural food colors are seen as more secure and nutritious alternatives to synthetic colors.
Compared to synthetic colors, natural food colors frequently have a smaller color spectrum. It can be difficult to produce certain distinctive or bright colors with natural colorants. The effectiveness of natural colors in food and beverage applications may also be impacted by their reduced stability and sensitivity to elements including pH, temperature, light, and processing conditions.
In the food and beverage business, natural colors provide chances for product innovation and distinction. Natural colorants enable manufacturers to make aesthetically appealing and distinctive goods that stand out in the marketplace by enabling them to establish new and distinctive color tones. Utilizing the adaptability of natural colors, businesses may develop fresh color schemes and aesthetically appealing goods.
Europe led the market in 2023 with the largest market share of 42.17%. The market for natural and organic goods is well-established throughout Europe. Natural colors play a significant role in the composition of natural and organic foods and beverages. The region's expanding organic industry offers natural color producers the chance to target this market and provide certified organic color alternatives. Function foods, enriched beverages, and nutritional supplements are among the health and wellness items that are in higher demand in the European market. Natural color can be employed to improve the items' aesthetic appeal while also enhancing the clean, natural image that health-conscious customers are looking for.
Europe Region Natural Food Colors Share in 2023 - 42.17%
www.thebrainyinsights.com
Check the geographical analysis of this market by requesting a free sample
The beverages segment dominated the global market in 2023 with a market share of 46.17%. The demand for beverages with clear labels and no artificial ingredients, such as synthetic colorants, is rising. Given that they come from organic materials and are viewed as healthier and safer options, natural colors fit with this trend. Consumers who value organic and clean-label products and are health-conscious are drawn to beverages manufactured with colors that are natural.
The Carotenoids segment held a significant market share of 31.22% in 2023. Carotenoids come in a variety of hues, such as yellow, orange, and red. This color spectrum enables a variety of uses in foods, drinks, nutritional supplements, and cosmetics. In the market for natural colors, carotenoids including beta-carotene, lycopene, and lutein are frequently employed. Carotenoids are well-known for their antioxidant and health-promoting qualities. They are frequently linked to enhancing immune function, protecting against chronic illnesses, and increasing eye health. Carotenoids enable producers to provide consumers with items that are not only aesthetically pleasing but also have practical advantages.
| Attribute | Description |
|---|---|
| Market Size | Revenue (USD Billion) |
| Market size value in 2023 | USD 2 Billion |
| Market size value in 2033 | USD 4.38 Billion |
| CAGR (2024 to 2033) | 8.14% |
| Historical data | 2020-2022 |
| Base Year | 2023 |
| Forecast | 2024-2033 |
| Region | The regions analyzed for the market are Asia Pacific, Europe, South America, North America, and Middle East & Africa. Furthermore, the regions are further analyzed at the country level. |
| Segments | Application, Product |
As per The Brainy Insights, the size of the natural food colors market was valued at USD 2 billion in 2023 to USD 4.38 billion by 2033.
The global natural food colors market is growing at a CAGR of 8.14% during the forecast period 2024-2033.
The Europe region emerged as the largest market for the natural food colors.
The rise in demand of products made from natural sources will influence the market's growth.
1. Introduction
1.1. Objectives of the Study
1.2. Market Definition
1.3. Research Scope
1.4. Currency
1.5. Key Target Audience
2. Research Methodology and Assumptions
3. Executive Summary
4. Premium Insights
4.1. Porter’s Five Forces Analysis
4.2. Value Chain Analysis
4.3. Top Investment Pockets
4.3.1. Market Attractiveness Analysis by Application
4.3.2. Market Attractiveness Analysis by Product
4.3.3. Market Attractiveness Analysis by Region
4.4. Industry Trends
5. Market Dynamics
5.1. Market Evaluation
5.2. Drivers
5.2.1. Rise in demand of products made from natural sources
5.3. Restraints
5.3.1. High production cost
5.4. Opportunities
5.4.1. Rise in demand from food and beverage sector for product innovation and distinction
5.5. Challenges
5.5.1. Presence of alternative products
6. Global Natural Food Colors Market Analysis and Forecast, By Application
6.1. Segment Overview
6.2. Bakery & Confectionery
6.3. Beverages
6.4. Dairy & Frozen Products
6.5. Meat Products
6.6. Oil & Fat
6.7. Fruits & Vegetables
6.8. Food
7. Global Natural Food Colors Market Analysis and Forecast, By Product
7.1. Segment Overview
7.2. Copper Chlorophyllin
7.3. Carmine
7.4. Anthocyanin
7.5. Curcumin
7.6. Carotenoids
8. Global Natural Food Colors Market Analysis and Forecast, By Regional Analysis
8.1. Segment Overview
8.2. North America
8.2.1. U.S.
8.2.2. Canada
8.2.3. Mexico
8.3. Europe
8.3.1. Germany
8.3.2. France
8.3.3. U.K.
8.3.4. Italy
8.3.5. Spain
8.4. Asia-Pacific
8.4.1. Japan
8.4.2. China
8.4.3. India
8.5. South America
8.5.1. Brazil
8.6. Middle East and Africa
8.6.1. UAE
8.6.2. South Africa
9. Global Natural Food Colors Market-Competitive Landscape
9.1. Overview
9.2. Market Share of Key Players in the Natural Food Colors Market
9.2.1. Global Company Market Share
9.2.2. North America Company Market Share
9.2.3. Europe Company Market Share
9.2.4. APAC Company Market Share
9.3. Competitive Situations and Trends
9.3.1. Product Launches and Developments
9.3.2. Partnerships, Collaborations, and Agreements
9.3.3. Mergers & Acquisitions
9.3.4. Expansions
10. Company Profiles
10.1. Chr. Hansen Holding AS
10.1.1. Business Overview
10.1.2. Company Snapshot
10.1.3. Company Market Share Analysis
10.1.4. Company Product Portfolio
10.1.5. Recent Developments
10.1.6. SWOT Analysis
10.2. Givaudan (Naturex)
10.2.1. Business Overview
10.2.2. Company Snapshot
10.2.3. Company Market Share Analysis
10.2.4. Company Product Portfolio
10.2.5. Recent Developments
10.2.6. SWOT Analysis
10.3. Koninklijke DSM NV
10.3.1. Business Overview
10.3.2. Company Snapshot
10.3.3. Company Market Share Analysis
10.3.4. Company Product Portfolio
10.3.5. Recent Developments
10.3.6. SWOT Analysis
10.4. Sensient Technologies
10.4.1. Business Overview
10.4.2. Company Snapshot
10.4.3. Company Market Share Analysis
10.4.4. Company Product Portfolio
10.4.5. Recent Developments
10.4.6. SWOT Analysis
10.5. Symrise AG
10.5.1. Business Overview
10.5.2. Company Snapshot
10.5.3. Company Market Share Analysis
10.5.4. Company Product Portfolio
10.5.5. Recent Developments
10.5.6. SWOT Analysis
10.6. Naturex
10.6.1. Business Overview
10.6.2. Company Snapshot
10.6.3. Company Market Share Analysis
10.6.4. Company Product Portfolio
10.6.5. Recent Developments
10.6.6. SWOT Analysis
10.7. Roha Dye Chem Pvt. Ltd
10.7.1. Business Overview
10.7.2. Company Snapshot
10.7.3. Company Market Share Analysis
10.7.4. Company Product Portfolio
10.7.5. Recent Developments
10.7.6. SWOT Analysis
List of Table
1. Global Natural Food Colors Market, By Application, 2020-2033 (USD Billion)
2. Global Bakery & Confectionery, Natural Food Colors Market, By Region, 2020-2033 (USD Billion)
3. Global Beverages, Natural Food Colors Market, By Region, 2020-2033 (USD Billion)
4. Global Dairy & Frozen Products, Natural Food Colors Market, By Region, 2020-2033 (USD Billion)
5. Global Meat Products, Natural Food Colors Market, By Region, 2020-2033 (USD Billion)
6. Global Oil & Fat, Natural Food Colors Market, By Region, 2020-2033 (USD Billion)
7. Global Fruits & Vegetables, Natural Food Colors Market, By Region, 2020-2033 (USD Billion)
8. Global Food, Natural Food Colors Market, By Region, 2020-2033 (USD Billion)
9. Global Natural Food Colors Market, By Product, 2020-2033 (USD Billion)
10. Global Copper Chlorophyllin, Natural Food Colors Market, By Region, 2020-2033 (USD Billion)
11. Global Carmine, Natural Food Colors Market, By Region, 2020-2033 (USD Billion)
12. Global Anthocyanin, Natural Food Colors Market, By Region, 2020-2033 (USD Billion)
13. Global Curcumin, Natural Food Colors Market, By Region, 2020-2033 (USD Billion)
14. Global Carotenoids, Natural Food Colors Market, By Region, 2020-2033 (USD Billion)
15. Global Natural Food Colors Market, By Region, 2020-2033 (USD Billion)
16. North America Natural Food Colors Market, By Application, 2020-2033 (USD Billion)
17. North America Natural Food Colors Market, By Product, 2020-2033 (USD Billion)
18. U.S. Natural Food Colors Market, By Application, 2020-2033 (USD Billion)
19. U.S. Natural Food Colors Market, By Product, 2020-2033 (USD Billion)
20. Canada Natural Food Colors Market, By Application, 2020-2033 (USD Billion)
21. Canada Natural Food Colors Market, By Product, 2020-2033 (USD Billion)
22. Mexico Natural Food Colors Market, By Application, 2020-2033 (USD Billion)
23. Mexico Natural Food Colors Market, By Product, 2020-2033 (USD Billion)
24. Europe Natural Food Colors Market, By Application, 2020-2033 (USD Billion)
25. Europe Natural Food Colors Market, By Product, 2020-2033 (USD Billion)
26. Germany Natural Food Colors Market, By Application, 2020-2033 (USD Billion)
27. Germany Natural Food Colors Market, By Product, 2020-2033 (USD Billion)
28. France Natural Food Colors Market, By Application, 2020-2033 (USD Billion)
29. France Natural Food Colors Market, By Product, 2020-2033 (USD Billion)
30. U.K. Natural Food Colors Market, By Application, 2020-2033 (USD Billion)
31. U.K. Natural Food Colors Market, By Product, 2020-2033 (USD Billion)
32. Italy Natural Food Colors Market, By Application, 2020-2033 (USD Billion)
33. Italy Natural Food Colors Market, By Product, 2020-2033 (USD Billion)
34. Spain Natural Food Colors Market, By Application, 2020-2033 (USD Billion)
35. Spain Natural Food Colors Market, By Product, 2020-2033 (USD Billion)
36. Asia Pacific Natural Food Colors Market, By Application, 2020-2033 (USD Billion)
37. Asia Pacific Natural Food Colors Market, By Product, 2020-2033 (USD Billion)
38. Japan Natural Food Colors Market, By Application, 2020-2033 (USD Billion)
39. Japan Natural Food Colors Market, By Product, 2020-2033 (USD Billion)
40. China Natural Food Colors Market, By Application, 2020-2033 (USD Billion)
41. China Natural Food Colors Market, By Product, 2020-2033 (USD Billion)
42. India Natural Food Colors Market, By Application, 2020-2033 (USD Billion)
43. India Natural Food Colors Market, By Product, 2020-2033 (USD Billion)
44. South America Natural Food Colors Market, By Application, 2020-2033 (USD Billion)
45. South America Natural Food Colors Market, By Product, 2020-2033 (USD Billion)
46. Brazil Natural Food Colors Market, By Application, 2020-2033 (USD Billion)
47. Brazil Natural Food Colors Market, By Product, 2020-2033 (USD Billion)
48. Middle East and Africa Natural Food Colors Market, By Application, 2020-2033 (USD Billion)
49. Middle East and Africa Natural Food Colors Market, By Product, 2020-2033 (USD Billion)
50. UAE Natural Food Colors Market, By Application, 2020-2033 (USD Billion)
51. UAE Natural Food Colors Market, By Product, 2020-2033 (USD Billion)
52. South Africa Natural Food Colors Market, By Application, 2020-2033 (USD Billion)
53. South Africa Natural Food Colors Market, By Product, 2020-2033 (USD Billion)
List of Figures
1. Global Natural Food Colors Market Segmentation
2. Natural Food Colors Market: Research Methodology
3. Market Size Estimation Methodology: Bottom-Up Approach
4. Market Size Estimation Methodology: Top-Down Approach
5. Data Triangulation
6. Porter’s Five Forces Analysis
7. Value Chain Analysis
8. Global Natural Food Colors Market Attractiveness Analysis by Application
9. Global Natural Food Colors Market Attractiveness Analysis by Product
10. Global Natural Food Colors Market Attractiveness Analysis by Region
11. Global Natural Food Colors Market: Dynamics
12. Global Natural Food Colors Market Share by Application (2023 & 2033)
13. Global Natural Food Colors Market Share by Product (2023 & 2033)
14. Global Natural Food Colors Market Share by Regions (2023 & 2033)
15. Global Natural Food Colors Market Share by Company (2023)
This study forecasts revenue at global, regional, and country levels from 2020 to 2033. The Brainy Insights has segmented the global natural food colors market based on below-mentioned segments:
Global Natural Food Colors Market by Application:
Global Natural Food Colors Market by Product:
Global Natural Food Colors Market by Region:
Research has its special purpose to undertake marketing efficiently. In this competitive scenario, businesses need information across all industry verticals; the information about customer wants, market demand, competition, industry trends, distribution channels etc. This information needs to be updated regularly because businesses operate in a dynamic environment. Our organization, The Brainy Insights incorporates scientific and systematic research procedures in order to get proper market insights and industry analysis for overall business success. The analysis consists of studying the market from a miniscule level wherein we implement statistical tools which helps us in examining the data with accuracy and precision.
Our research reports feature both; quantitative and qualitative aspects for any market. Qualitative information for any market research process are fundamental because they reveal the customer needs and wants, usage and consumption for any product/service related to a specific industry. This in turn aids the marketers/investors in knowing certain perceptions of the customers. Qualitative research can enlighten about the different product concepts and designs along with unique service offering that in turn, helps define marketing problems and generate opportunities. On the other hand, quantitative research engages with the data collection process through interviews, e-mail interactions, surveys and pilot studies. Quantitative aspects for the market research are useful to validate the hypotheses generated during qualitative research method, explore empirical patterns in the data with the help of statistical tools, and finally make the market estimations.
The Brainy Insights offers comprehensive research and analysis, based on a wide assortment of factual insights gained through interviews with CXOs and global experts and secondary data from reliable sources. Our analysts and industry specialist assume vital roles in building up statistical tools and analysis models, which are used to analyse the data and arrive at accurate insights with exceedingly informative research discoveries. The data provided by our organization have proven precious to a diverse range of companies, facilitating them to address issues such as determining which products/services are the most appealing, whether or not customers use the product in the manner anticipated, the purchasing intentions of the market and many others.
Our research methodology encompasses an idyllic combination of primary and secondary initiatives. Key phases involved in this process are listed below:

The phase involves the gathering and collecting of market data and its related information with the help of different sources & research procedures.

The data procurement stage involves in data gathering and collecting through various data sources.
This stage involves in extensive research. These data sources includes:
Purchased Database: Purchased databases play a crucial role in estimating the market sizes irrespective of the domain. Our purchased database includes:
Primary Research: The Brainy Insights interacts with leading companies and experts of the concerned domain to develop the analyst team’s market understanding and expertise. It improves and substantiates every single data presented in the market reports. Primary research mainly involves in telephonic interviews, E-mail interactions and face-to-face interviews with the raw material providers, manufacturers/producers, distributors, & independent consultants. The interviews that we conduct provides valuable data on market size and industry growth trends prevailing in the market. Our organization also conducts surveys with the various industry experts in order to gain overall insights of the industry/market. For instance, in healthcare industry we conduct surveys with the pharmacists, doctors, surgeons and nurses in order to gain insights and key information of a medical product/device/equipment which the customers are going to usage. Surveys are conducted in the form of questionnaire designed by our own analyst team. Surveys plays an important role in primary research because surveys helps us to identify the key target audiences of the market. Additionally, surveys helps to identify the key target audience engaged with the market. Our survey team conducts the survey by targeting the key audience, thus gaining insights from them. Based on the perspectives of the customers, this information is utilized to formulate market strategies. Moreover, market surveys helps us to understand the current competitive situation of the industry. To be precise, our survey process typically involve with the 360 analysis of the market. This analytical process begins by identifying the prospective customers for a product or service related to the market/industry to obtain data on how a product/service could fit into customers’ lives.

Secondary Research: The secondary data sources includes information published by the on-profit organizations such as World bank, WHO, company fillings, investor presentations, annual reports, national government documents, statistical databases, blogs, articles, white papers and others. From the annual report, we analyse a company’s revenue to understand the key segment and market share of that organization in a particular region. We analyse the company websites and adopt the product mapping technique which is important for deriving the segment revenue. In the product mapping method, we select and categorize the products offered by the companies catering to domain specific market, deduce the product revenue for each of the companies so as to get overall estimation of the market size. We also source data and analyses trends based on information received from supply side and demand side intermediaries in the value chain. The supply side denotes the data gathered from supplier, distributor, wholesaler and the demand side illustrates the data gathered from the end customers for respective market domain.

The supply side for a domain specific market is analysed by:
The demand side for the market is estimated through:
In-house Library: Apart from these third-party sources, we have our in-house library of qualitative and quantitative information. Our in-house database includes market data for various industry and domains. These data are updated on regular basis as per the changing market scenario. Our library includes, historic databases, internal audit reports and archives.
Sometimes there are instances where there is no metadata or raw data available for any domain specific market. For those cases, we use our expertise to forecast and estimate the market size in order to generate comprehensive data sets. Our analyst team adopt a robust research technique in order to produce the estimates:
Data Synthesis: This stage involves the analysis & mapping of all the information obtained from the previous step. It also involves in scrutinizing the data for any discrepancy observed while data gathering related to the market. The data is collected with consideration to the heterogeneity of sources. Robust scientific techniques are in place for synthesizing disparate data sets and provide the essential contextual information that can orient market strategies. The Brainy Insights has extensive experience in data synthesis where the data passes through various stages:


Market Deduction & Formulation: The final stage comprises of assigning data points at appropriate market spaces so as to deduce feasible conclusions. Analyst perspective & subject matter expert based holistic form of market sizing coupled with industry analysis also plays a crucial role in this stage.
This stage involves in finalization of the market size and numbers that we have collected from data integration step. With data interpolation, it is made sure that there is no gap in the market data. Successful trend analysis is done by our analysts using extrapolation techniques, which provide the best possible forecasts for the market.
Data Validation & Market Feedback: Validation is the most important step in the process. Validation & re-validation via an intricately designed process helps us finalize data-points to be used for final calculations.

The Brainy Insights interacts with leading companies and experts of the concerned domain to develop the analyst team’s market understanding and expertise. It improves and substantiates every single data presented in the market reports. The data validation interview and discussion panels are typically composed of the most experienced industry members. The participants include, however, are not limited to:
Moreover, we always validate our data and findings through primary respondents from all the major regions we are working on.


Free Customization
Fortune 500 Clients
Free Yearly Update On Purchase Of Multi/Corporate License
Companies Served Till Date