- +1-315-215-1633
- sales@thebrainyinsights.com

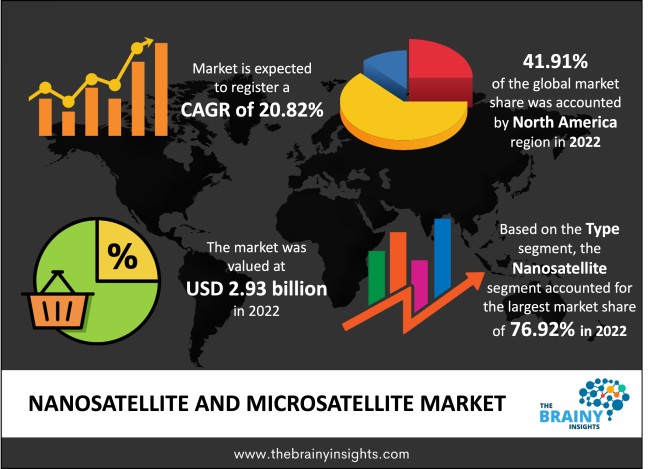
The global nanosatellite and microsatellite market was valued at USD 2.93 Billion in 2022 and grew at a CAGR of 20.82% from 2023 to 2032. The market is expected to reach USD 19.42 Billion by 2032. The growth of the nanosatellite and microsatellite market can be attributed to the rise in the prevalence of chronic diseases and the increasing cost of healthcare services.
A nanosatellite is a small satellite platform with very high-density technology that must be designed to be reliable. The level of technology, development, and progress of financing limits impacts the lifespan and dependability of a nanosatellite. As a result, all efforts must be made to ascertain a specific nature and reliability. In genomics, a microsatellite is used for analyzing a small DNA fragment that is repeated several times in succession at a specific genomic region. The number of repeated segments inside a microsatellite sequence often changes between persons, making them valuable for analyzing inheritance patterns or a DNA test or fingerprint.
Get an overview of this study by requesting a free sample
An increase in demand for mini satellites across industries: Small satellites launched into LEO orbit can be manufactured far cheaper than traditional bigger satellites. Small satellites have altered the landscape of space missions in recent years. They enable faster, more cost-effective, and dependable access to space and data products. The unique nature of nanosatellites does not preclude them from performing the same functions as larger units. Data collection and interpretation are critical for proper resource management and the development of sustainable economies. Microsatellites can be constructed less cheaply and with a shorter lead time than traditional full-sized satellites. As a result, they are likely to play an essential role in space business and utilization.
High cost: Launching small satellites remains relatively high, averaging $30k/kg during the decade. This cost hampers the use of such satellites in mid-scale and small-scale end-user industries. The high cost of launching limits the demand in most industries.
Increased launches in recent years: New competitors are constantly entering the small satellite industry, fueling rivalry and technological advancement. With lower costs comes the option for higher production rates, resulting in more new product launches per year. To remain competitive, the satellites businesses are lowering development, manufacturing, and operational costs. The manufacture of small satellites has dramatically affected the space business. This has spurred new participants in the space domain to enhance their capabilities, ranging from modest spacecraft to Earth-spanning constellations of thousands of satellites.
The regions analyzed for the market include North America, Europe, South America, Asia Pacific, the Middle East, and Africa. North America emerged as the most significant nanosatellite and microsatellite market, with a 41.91% market revenue share in 2022.
North American region will account for the largest market share with revenue growth. Nations such as the U.S. and Canada have a tremendous demand for nanosatellites and microsatellites due to the rising investment in the defence and civil industry and the increasing deployment of such satellites in scientific research. The increasing expenditure on the space industry, such as aeronautics, exploration and space operations, will provide lucrative opportunities to the nanosatellite and microsatellite market.
North America Region Nanosatellite and Microsatellite Market Share in 2022 - 41.91%
www.thebrainyinsights.com
Check the geographical analysis of this market by requesting a free sample
The type segment is divided into microsatellites and nanosatellites. The nanosatellite segment dominated the market, with a share of around 76.92% in 2022. Nanosatellites are used for several applications, such as tracking population data, improvising water management, and defence management. The nanosatellite has improved transportation capabilities and thus lowers the overall costs.
The component segment is divided into service, hardware and software. The software segment dominated the market, with a share of around 45.29% in 2022. Software is used to create and handle massive amounts of microsatellite data. The microsatellite software computes the usual suite of descriptive statistics and generates input files for the formation of programmes.
The application segment is divided into earth observation, scientific research, communication and navigation, and educational and technology training. The earth observation segment dominated the market, with a share of around 46.02% in 2022. The use of nanosatellites and microsatellites in earth observation is increasing due to the growing investments in space missions. The advanced technologies utilized in developing nanosatellite and microsatellite delivers high performance.
The end-users segment is divided into defence, government, commercial, and civil. The commercial segment dominated the market, with a share of around 46.83% in 2022. Nanosatellites are used for broadcasting, communicating and navigating applications. These satellites enable the collection of data and also deliver effective IoT connectivity.
| Attribute | Description |
|---|---|
| Market Size | Revenue (USD Billion) |
| Market size value in 2022 | USD 2.93 Billion |
| Market size value in 2032 | USD 19.42 Billion |
| CAGR (2023 to 2032) | 20.82% |
| Historical data | 2019-2021 |
| Base Year | 2022 |
| Forecast | 2023-2032 |
| Region | The regions analyzed for the market are Asia Pacific, Europe, South America, North America, and Middle East & Africa. Furthermore, the regions are further analyzed at the country level. |
| Segments | Type, Component, Application and End-users |
As per The Brainy Insights, the size of the nanosatellite and microsatellite market was valued USD 2.93 billion in 2022 to USD 19.42 billion by 2032.
Global nanosatellite and microsatellite market is growing at a CAGR of 20.82% during the forecast period 2023-2032.
North America region emerged as the largest market for the nanosatellite and microsatellite.
The market's growth will be influenced by the increasing demand of nanosatellite and microsatellite across industries.
The high cost can hamper the market growth.
The increasing number of product launches is providing huge opportunities to the market.
Key players are Dauria Aerospace, GomSpace, Innovative Solutions in Space, Sierra Nevada Corporation, SpaceQuest Ltd., Spire Global, Inc., Surrey Satellite Technology Limited, Vector Launch, The Boeing Company, Tyvak Inc. among others.
1. Introduction
1.1. Objectives of the Study
1.2. Market Definition
1.3. Research Scope
1.4. Currency
1.5. Key Target Audience
2. Research Methodology and Assumptions
3. Executive Summary
4. Premium Insights
4.1. Porter’s Five Forces Analysis
4.2. Value Chain Analysis
4.3. Top Investment Pockets
4.3.1. Market Attractiveness Analysis by Type
4.3.2. Market Attractiveness Analysis by Component
4.3.3. Market Attractiveness Analysis by Application
4.3.4. Market Attractiveness Analysis by End-users
4.3.5. Market Attractiveness Analysis by Region
4.4. Industry Trends
5. Market Dynamics
5.1. Market Evaluation
5.2. Drivers
5.2.1. Increasing use of nanosatellite and microsatellites across end-users
5.3. Restraints
5.3.1. High cost of launching
5.4. Opportunities
5.4.1. Increasing product launches
5.5. Challenges
5.5.1. Space debris concerns
6. Global Nanosatellite and Microsatellite Market Analysis and Forecast, By Type
6.1. Segment Overview
6.2. Microsatellite
6.3. Nanosatellite
7. Global Nanosatellite and Microsatellite Market Analysis and Forecast, By Component
7.1. Segment Overview
7.2. Service
7.3. Hardware
7.4. Software
8. Global Nanosatellite and Microsatellite Market Analysis and Forecast, By Application
8.1. Segment Overview
8.2. Earth Observation
8.3. Scientific Research
8.4. Communication and Navigation
8.5. Educational and Technology Training
9. Global Nanosatellite and Microsatellite Market Analysis and Forecast, By End-users
9.1. Segment Overview
9.2. Defense
9.3. Government
9.4. Commercial
9.5. Civil
10. Global Nanosatellite and Microsatellite Market Analysis and Forecast, By Regional Analysis
10.1. Segment Overview
10.2. North America
10.2.1. U.S.
10.2.2. Canada
10.2.3. Mexico
10.3. Europe
10.3.1. Germany
10.3.2. France
10.3.3. U.K.
10.3.4. Italy
10.3.5. Spain
10.4. Asia-Pacific
10.4.1. Japan
10.4.2. China
10.4.3. India
10.5. South America
10.5.1. Brazil
10.6. Middle East and Africa
10.6.1. UAE
10.6.2. South Africa
11. Global Nanosatellite and Microsatellite Market-Competitive Landscape
11.1. Overview
11.2. Market Share of Key Players in the Nanosatellite and Microsatellite Market
11.2.1. Global Company Market Share
11.2.2. North America Company Market Share
11.2.3. Europe Company Market Share
11.2.4. APAC Company Market Share
11.3. Competitive Situations and Trends
11.3.1. Product Launches and Developments
11.3.2. Partnerships, Collaborations, and Agreements
11.3.3. Mergers & Acquisitions
11.3.4. Expansions
12. Company Profiles
12.1. Dauria Aerospace
12.1.1. Business Overview
12.1.2. Company Snapshot
12.1.3. Company Market Share Analysis
12.1.4. Company Product Portfolio
12.1.5. Recent Developments
12.1.6. SWOT Analysis
12.2. GomSpace
12.2.1. Business Overview
12.2.2. Company Snapshot
12.2.3. Company Market Share Analysis
12.2.4. Company Product Portfolio
12.2.5. Recent Developments
12.2.6. SWOT Analysis
12.3. Innovative Solutions in Space
12.3.1. Business Overview
12.3.2. Company Snapshot
12.3.3. Company Market Share Analysis
12.3.4. Company Product Portfolio
12.3.5. Recent Developments
12.3.6. SWOT Analysis
12.4. Sierra Nevada Corporation
12.4.1. Business Overview
12.4.2. Company Snapshot
12.4.3. Company Market Share Analysis
12.4.4. Company Product Portfolio
12.4.5. Recent Developments
12.4.6. SWOT Analysis
12.5. SpaceQuest Ltd.
12.5.1. Business Overview
12.5.2. Company Snapshot
12.5.3. Company Market Share Analysis
12.5.4. Company Product Portfolio
12.5.5. Recent Developments
12.5.6. SWOT Analysis
12.6. Spire Global, Inc.
12.6.1. Business Overview
12.6.2. Company Snapshot
12.6.3. Company Market Share Analysis
12.6.4. Company Product Portfolio
12.6.5. Recent Developments
12.6.6. SWOT Analysis
12.7. Surrey Satellite Technology Limited
12.7.1. Business Overview
12.7.2. Company Snapshot
12.7.3. Company Market Share Analysis
12.7.4. Company Product Portfolio
12.7.5. Recent Developments
12.7.6. SWOT Analysis
12.8. Vector Launch
12.8.1. Business Overview
12.8.2. Company Snapshot
12.8.3. Company Market Share Analysis
12.8.4. Company Product Portfolio
12.8.5. Recent Developments
12.8.6. SWOT Analysis
12.9. The Boeing Company
12.9.1. Business Overview
12.9.2. Company Snapshot
12.9.3. Company Market Share Analysis
12.9.4. Company Product Portfolio
12.9.5. Recent Developments
12.9.6. SWOT Analysis
12.10. Tyvak Inc.
12.10.1. Business Overview
12.10.2. Company Snapshot
12.10.3. Company Market Share Analysis
12.10.4. Company Product Portfolio
12.10.5. Recent Developments
12.10.6. SWOT Analysis
List of Table
1. Global Nanosatellite and Microsatellite Market, By Type, 2019-2032 (USD Billion)
2. Global Microsatellite, Nanosatellite and Microsatellite Market, By Region, 2019-2032 (USD Billion)
3. Global Nanosatellite, Nanosatellite and Microsatellite Market, By Region, 2019-2032 (USD Billion)
4. Global Nanosatellite and Microsatellite Market, By Component, 2019-2032 (USD Billion)
5. Global Service, Nanosatellite and Microsatellite Market, By Region, 2019-2032 (USD Billion)
6. Global Hardware, Nanosatellite and Microsatellite Market, By Region, 2019-2032 (USD Billion)
7. Global Software, Nanosatellite and Microsatellite Market, By Region, 2019-2032 (USD Billion)
8. Global Nanosatellite and Microsatellite Market, By Application, 2019-2032 (USD Billion)
9. Global Earth Observation, Nanosatellite and Microsatellite Market, By Region, 2019-2032 (USD Billion)
10. Global Scientific Research, Nanosatellite and Microsatellite Market, By Region, 2019-2032 (USD Billion)
11. Global Communication and Navigation, Nanosatellite and Microsatellite Market, By Region, 2019-2032 (USD Billion)
12. Global Educational and Technology Training, Nanosatellite and Microsatellite Market, By Region, 2019-2032 (USD Billion)
13. Global Nanosatellite and Microsatellite Market, By End-user, 2019-2032 (USD Billion)
14. Global Defense, Nanosatellite and Microsatellite Market, By Region, 2019-2032 (USD Billion)
15. Global Government, Nanosatellite and Microsatellite Market, By Region, 2019-2032 (USD Billion)
16. Global Commercial, Nanosatellite and Microsatellite Market, By Region, 2019-2032 (USD Billion)
17. Global Civil, Nanosatellite and Microsatellite Market, By Region, 2019-2032 (USD Billion)
18. Global Nanosatellite and Microsatellite Market, By Region, 2019-2032 (USD Billion)
19. North America Nanosatellite and Microsatellite Market, By Type, 2019-2032 (USD Billion)
20. North America Nanosatellite and Microsatellite Market, By Component, 2019-2032 (USD Billion)
21. North America Nanosatellite and Microsatellite Market, By Application, 2019-2032 (USD Billion)
22. North America Nanosatellite and Microsatellite Market, By End-user, 2019-2032 (USD Billion)
23. U.S. Nanosatellite and Microsatellite Market, By Type, 2019-2032 (USD Billion)
24. U.S. Nanosatellite and Microsatellite Market, By Component, 2019-2032 (USD Billion)
25. U.S. Nanosatellite and Microsatellite Market, By Application, 2019-2032 (USD Billion)
26. U.S. Nanosatellite and Microsatellite Market, By End-user, 2019-2032 (USD Billion)
27. Canada Nanosatellite and Microsatellite Market, By Type, 2019-2032 (USD Billion)
28. Canada Nanosatellite and Microsatellite Market, By Component, 2019-2032 (USD Billion)
29. Canada Nanosatellite and Microsatellite Market, By Application, 2019-2032 (USD Billion)
30. Canada Nanosatellite and Microsatellite Market, By End-user, 2019-2032 (USD Billion)
31. Mexico Nanosatellite and Microsatellite Market, By Type, 2019-2032 (USD Billion)
32. Mexico Nanosatellite and Microsatellite Market, By Component, 2019-2032 (USD Billion)
33. Mexico Nanosatellite and Microsatellite Market, By Application, 2019-2032 (USD Billion)
34. Mexico Nanosatellite and Microsatellite Market, By End-user, 2019-2032 (USD Billion)
35. Europe Nanosatellite and Microsatellite Market, By Type, 2019-2032 (USD Billion)
36. Europe Nanosatellite and Microsatellite Market, By Component, 2019-2032 (USD Billion)
37. Europe Nanosatellite and Microsatellite Market, By Application, 2019-2032 (USD Billion)
38. Europe Nanosatellite and Microsatellite Market, By End-user, 2019-2032 (USD Billion)
39. Germany Nanosatellite and Microsatellite Market, By Type, 2019-2032 (USD Billion)
40. Germany Nanosatellite and Microsatellite Market, By Component, 2019-2032 (USD Billion)
41. Germany Nanosatellite and Microsatellite Market, By Application, 2019-2032 (USD Billion)
42. Germany Nanosatellite and Microsatellite Market, By End-user, 2019-2032 (USD Billion)
43. France Nanosatellite and Microsatellite Market, By Type, 2019-2032 (USD Billion)
44. France Nanosatellite and Microsatellite Market, By Component, 2019-2032 (USD Billion)
45. France Nanosatellite and Microsatellite Market, By Application, 2019-2032 (USD Billion)
46. France Nanosatellite and Microsatellite Market, By End-user, 2019-2032 (USD Billion)
47. U.K. Nanosatellite and Microsatellite Market, By Type, 2019-2032 (USD Billion)
48. U.K. Nanosatellite and Microsatellite Market, By Component, 2019-2032 (USD Billion)
49. U.K. Nanosatellite and Microsatellite Market, By Application, 2019-2032 (USD Billion)
50. U.K. Nanosatellite and Microsatellite Market, By End-user, 2019-2032 (USD Billion)
51. Italy Nanosatellite and Microsatellite Market, By Type, 2019-2032 (USD Billion)
52. Italy Nanosatellite and Microsatellite Market, By Component, 2019-2032 (USD Billion)
53. Italy Nanosatellite and Microsatellite Market, By Application, 2019-2032 (USD Billion)
54. Italy Nanosatellite and Microsatellite Market, By End-user, 2019-2032 (USD Billion)
55. Spain Nanosatellite and Microsatellite Market, By Type, 2019-2032 (USD Billion)
56. Spain Nanosatellite and Microsatellite Market, By Component, 2019-2032 (USD Billion)
57. Spain Nanosatellite and Microsatellite Market, By Application, 2019-2032 (USD Billion)
58. Spain Nanosatellite and Microsatellite Market, By End-user, 2019-2032 (USD Billion)
59. Asia Pacific Nanosatellite and Microsatellite Market, By Type, 2019-2032 (USD Billion)
60. Asia Pacific Nanosatellite and Microsatellite Market, By Component, 2019-2032 (USD Billion)
61. Asia Pacific Nanosatellite and Microsatellite Market, By Application, 2019-2032 (USD Billion)
62. Asia Pacific Nanosatellite and Microsatellite Market, By End-user, 2019-2032 (USD Billion)
63. Japan Nanosatellite and Microsatellite Market, By Type, 2019-2032 (USD Billion)
64. Japan Nanosatellite and Microsatellite Market, By Component, 2019-2032 (USD Billion)
65. Japan Nanosatellite and Microsatellite Market, By Application, 2019-2032 (USD Billion)
66. Japan Nanosatellite and Microsatellite Market, By End-user, 2019-2032 (USD Billion)
67. China Nanosatellite and Microsatellite Market, By Type, 2019-2032 (USD Billion)
68. China Nanosatellite and Microsatellite Market, By Component, 2019-2032 (USD Billion)
69. China Nanosatellite and Microsatellite Market, By Application, 2019-2032 (USD Billion)
70. China Nanosatellite and Microsatellite Market, By End-user, 2019-2032 (USD Billion)
71. India Nanosatellite and Microsatellite Market, By Type, 2019-2032 (USD Billion)
72. India Nanosatellite and Microsatellite Market, By Component, 2019-2032 (USD Billion)
73. India Nanosatellite and Microsatellite Market, By Application, 2019-2032 (USD Billion)
74. India Nanosatellite and Microsatellite Market, By End-user, 2019-2032 (USD Billion)
75. South America Nanosatellite and Microsatellite Market, By Type, 2019-2032 (USD Billion)
76. South America Nanosatellite and Microsatellite Market, By Component, 2019-2032 (USD Billion)
77. South America Nanosatellite and Microsatellite Market, By Application, 2019-2032 (USD Billion)
78. South America Nanosatellite and Microsatellite Market, By End-user, 2019-2032 (USD Billion)
79. Brazil Nanosatellite and Microsatellite Market, By Type, 2019-2032 (USD Billion)
80. Brazil Nanosatellite and Microsatellite Market, By Component, 2019-2032 (USD Billion)
81. Brazil Nanosatellite and Microsatellite Market, By Application, 2019-2032 (USD Billion)
82. BrazilNanosatellite and Microsatellite Market, By End-user, 2019-2032 (USD Billion)
83. Middle East and Africa Nanosatellite and Microsatellite Market, By Type, 2019-2032 (USD Billion)
84. Middle East and Africa Nanosatellite and Microsatellite Market, By Component, 2019-2032 (USD Billion)
85. Middle East and Africa Nanosatellite and Microsatellite Market, By Application, 2019-2032 (USD Billion)
86. Middle East and Africa Nanosatellite and Microsatellite Market, By End-user, 2019-2032 (USD Billion)
87. UAE Nanosatellite and Microsatellite Market, By Type, 2019-2032 (USD Billion)
88. UAE Nanosatellite and Microsatellite Market, By Component, 2019-2032 (USD Billion)
89. UAE Nanosatellite and Microsatellite Market, By Application, 2019-2032 (USD Billion)
90. UAE Nanosatellite and Microsatellite Market, By End-user, 2019-2032 (USD Billion)
91. South Africa Nanosatellite and Microsatellite Market, By Type, 2019-2032 (USD Billion)
92. South Africa Nanosatellite and Microsatellite Market, By Component, 2019-2032 (USD Billion)
93. South Africa Nanosatellite and Microsatellite Market, By Application, 2019-2032 (USD Billion)
94. South Africa Nanosatellite and Microsatellite Market, By End-user, 2019-2032 (USD Billion)
List of Figures
1. Global Nanosatellite and Microsatellite Market Segmentation
2. Nanosatellite and Microsatellite Market: Research Methodology
3. Market Size Estimation Methodology: Bottom-Up Approach
4. Market Size Estimation Methodology: Top-Down Approach
5. Data Triangulation
6. Porter’s Five Forces Analysis
7. Value Chain Analysis
8. Global Nanosatellite and Microsatellite Market Attractiveness Analysis by Type
9. Global Nanosatellite and Microsatellite Market Attractiveness Analysis by Component
10. Global Nanosatellite and Microsatellite Market Attractiveness Analysis by Application
11. Global Nanosatellite and Microsatellite Market Attractiveness Analysis by End-user
12. Global Nanosatellite and Microsatellite Market Attractiveness Analysis by Region
13. Global Nanosatellite and Microsatellite Market: Dynamics
14. Global Nanosatellite and Microsatellite Market Share by Type (2022 & 2032)
15. Global Nanosatellite and Microsatellite Market Share by Component (2022 & 2032)
16. Global Nanosatellite and Microsatellite Market Share by Application (2022 & 2032)
17. Global Nanosatellite and Microsatellite Market Share by End-user (2022 & 2032)
18. Global Nanosatellite and Microsatellite Market Share by Regions (2022 & 2032)
19. Global Nanosatellite and Microsatellite Market Share by Company (2022)
This study forecasts revenue at global, regional, and country levels from 2019 to 2032. The Brainy Insights has segmented the global nanosatellite and microsatellite market based on below mentioned segments:
Global Nanosatellite and Microsatellite Market by Type:
Global Nanosatellite and Microsatellite Market by Component:
Global Nanosatellite and Microsatellite Market by Application:
Global Nanosatellite and Microsatellite Market by End-users:
Global Nanosatellite and Microsatellite Market by Region:
Research has its special purpose to undertake marketing efficiently. In this competitive scenario, businesses need information across all industry verticals; the information about customer wants, market demand, competition, industry trends, distribution channels etc. This information needs to be updated regularly because businesses operate in a dynamic environment. Our organization, The Brainy Insights incorporates scientific and systematic research procedures in order to get proper market insights and industry analysis for overall business success. The analysis consists of studying the market from a miniscule level wherein we implement statistical tools which helps us in examining the data with accuracy and precision.
Our research reports feature both; quantitative and qualitative aspects for any market. Qualitative information for any market research process are fundamental because they reveal the customer needs and wants, usage and consumption for any product/service related to a specific industry. This in turn aids the marketers/investors in knowing certain perceptions of the customers. Qualitative research can enlighten about the different product concepts and designs along with unique service offering that in turn, helps define marketing problems and generate opportunities. On the other hand, quantitative research engages with the data collection process through interviews, e-mail interactions, surveys and pilot studies. Quantitative aspects for the market research are useful to validate the hypotheses generated during qualitative research method, explore empirical patterns in the data with the help of statistical tools, and finally make the market estimations.
The Brainy Insights offers comprehensive research and analysis, based on a wide assortment of factual insights gained through interviews with CXOs and global experts and secondary data from reliable sources. Our analysts and industry specialist assume vital roles in building up statistical tools and analysis models, which are used to analyse the data and arrive at accurate insights with exceedingly informative research discoveries. The data provided by our organization have proven precious to a diverse range of companies, facilitating them to address issues such as determining which products/services are the most appealing, whether or not customers use the product in the manner anticipated, the purchasing intentions of the market and many others.
Our research methodology encompasses an idyllic combination of primary and secondary initiatives. Key phases involved in this process are listed below:

The phase involves the gathering and collecting of market data and its related information with the help of different sources & research procedures.

The data procurement stage involves in data gathering and collecting through various data sources.
This stage involves in extensive research. These data sources includes:
Purchased Database: Purchased databases play a crucial role in estimating the market sizes irrespective of the domain. Our purchased database includes:
Primary Research: The Brainy Insights interacts with leading companies and experts of the concerned domain to develop the analyst team’s market understanding and expertise. It improves and substantiates every single data presented in the market reports. Primary research mainly involves in telephonic interviews, E-mail interactions and face-to-face interviews with the raw material providers, manufacturers/producers, distributors, & independent consultants. The interviews that we conduct provides valuable data on market size and industry growth trends prevailing in the market. Our organization also conducts surveys with the various industry experts in order to gain overall insights of the industry/market. For instance, in healthcare industry we conduct surveys with the pharmacists, doctors, surgeons and nurses in order to gain insights and key information of a medical product/device/equipment which the customers are going to usage. Surveys are conducted in the form of questionnaire designed by our own analyst team. Surveys plays an important role in primary research because surveys helps us to identify the key target audiences of the market. Additionally, surveys helps to identify the key target audience engaged with the market. Our survey team conducts the survey by targeting the key audience, thus gaining insights from them. Based on the perspectives of the customers, this information is utilized to formulate market strategies. Moreover, market surveys helps us to understand the current competitive situation of the industry. To be precise, our survey process typically involve with the 360 analysis of the market. This analytical process begins by identifying the prospective customers for a product or service related to the market/industry to obtain data on how a product/service could fit into customers’ lives.

Secondary Research: The secondary data sources includes information published by the on-profit organizations such as World bank, WHO, company fillings, investor presentations, annual reports, national government documents, statistical databases, blogs, articles, white papers and others. From the annual report, we analyse a company’s revenue to understand the key segment and market share of that organization in a particular region. We analyse the company websites and adopt the product mapping technique which is important for deriving the segment revenue. In the product mapping method, we select and categorize the products offered by the companies catering to domain specific market, deduce the product revenue for each of the companies so as to get overall estimation of the market size. We also source data and analyses trends based on information received from supply side and demand side intermediaries in the value chain. The supply side denotes the data gathered from supplier, distributor, wholesaler and the demand side illustrates the data gathered from the end customers for respective market domain.

The supply side for a domain specific market is analysed by:
The demand side for the market is estimated through:
In-house Library: Apart from these third-party sources, we have our in-house library of qualitative and quantitative information. Our in-house database includes market data for various industry and domains. These data are updated on regular basis as per the changing market scenario. Our library includes, historic databases, internal audit reports and archives.
Sometimes there are instances where there is no metadata or raw data available for any domain specific market. For those cases, we use our expertise to forecast and estimate the market size in order to generate comprehensive data sets. Our analyst team adopt a robust research technique in order to produce the estimates:
Data Synthesis: This stage involves the analysis & mapping of all the information obtained from the previous step. It also involves in scrutinizing the data for any discrepancy observed while data gathering related to the market. The data is collected with consideration to the heterogeneity of sources. Robust scientific techniques are in place for synthesizing disparate data sets and provide the essential contextual information that can orient market strategies. The Brainy Insights has extensive experience in data synthesis where the data passes through various stages:


Market Deduction & Formulation: The final stage comprises of assigning data points at appropriate market spaces so as to deduce feasible conclusions. Analyst perspective & subject matter expert based holistic form of market sizing coupled with industry analysis also plays a crucial role in this stage.
This stage involves in finalization of the market size and numbers that we have collected from data integration step. With data interpolation, it is made sure that there is no gap in the market data. Successful trend analysis is done by our analysts using extrapolation techniques, which provide the best possible forecasts for the market.
Data Validation & Market Feedback: Validation is the most important step in the process. Validation & re-validation via an intricately designed process helps us finalize data-points to be used for final calculations.

The Brainy Insights interacts with leading companies and experts of the concerned domain to develop the analyst team’s market understanding and expertise. It improves and substantiates every single data presented in the market reports. The data validation interview and discussion panels are typically composed of the most experienced industry members. The participants include, however, are not limited to:
Moreover, we always validate our data and findings through primary respondents from all the major regions we are working on.


Free Customization
Fortune 500 Clients
Free Yearly Update On Purchase Of Multi/Corporate License
Companies Served Till Date