- +1-315-215-1633
- sales@thebrainyinsights.com

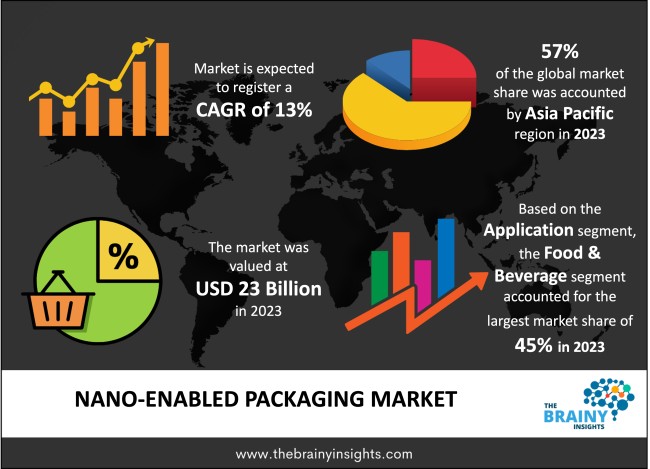
The global Nano-enabled Packaging market was valued at USD 23 billion in 2023 and growing at a CAGR of 13% from 2024 to 2033. The market is expected to reach USD 78 billion by 2033. Rising demand for packaged food and increasing demand for various end-user industries will potentially drive the growth of the Nano-enabled Packaging Market. Whereas, rapid technological advancements in the Nano-enabled Packaging and rapidly growing environmental concerns in the global market may drive the growth of the Nano-enabled Packaging Market in the period forecasted.
Nano-enabled Packaging involves utilizing Nano-based packaging in diverse end-user industries to shield the internal product from external factors. This technology not only extends the product's shelf life but also preserves its overall texture, color, and taste.
Due to its widespread adoption across multiple end-user sectors such as Food & Beverages, Pharmaceuticals, Personal Care & Cosmetics, Consumer Electronics, and others, Nano-enabled Packaging comes in two primary forms: Intelligent and Smart Packaging, and Active Packaging solutions.
Get an overview of this study by requesting a free sample
• In December 2021, Sealed Air Singapore experienced a significant technological breakthrough, enabling manufacturers to offer a multitude of packaging solutions to end-users. With this advancement, manufacturers are poised to not only provide dynamic solutions to end-users but also to capture a larger share of the global market.
Rising demand for packaged food – The surge in demand for packaged food has significantly propelled the expansion of Nano-enabled Packaging in the global market. This innovative technology not only extends shelf life but also offers consumers enhanced food protection, shields against external environmental factors, and contributes to mitigating food scarcity issues.
High costs associated with Nano-enabled Packaging – One major factor that may hamper the growth of Nano-enabled Packaging is the high costs associated with the same. Increasing raw material costs and rising operation costs have hampered the growth of the market players in the competitive market, which is an area of improvement.
Rapid technological advancements in Nano-enabled Packaging- The swift pace of technological progress in Nano-enabled Packaging holds the potential to fuel market growth, particularly with its expanding application in biodegradable solutions. In today's fiercely competitive market, there's a notable emphasis on adopting environmentally friendly practices. This trend not only presents vast opportunities but also addresses customer demands adeptly by offering dynamic solutions that minimize environmental impact over time
APAC has emerged as the predominant force in the global Nano-enabled Packaging market, commanding a significant 57% share, driven by heightened food and beverage consumption in the region. With populous nations like India and China leading the pack, the demand for food and beverages remains robust. Meanwhile, North America is poised to witness the most rapid growth within the region, propelled by accelerated technological innovations in the global market landscape.
APAC Region Nano-enabled Packaging Market Share in 2023 - 57%
www.thebrainyinsights.com
Check the geographical analysis of this market by requesting a free sample
The food & beverage industry has dominated the market accounting for 45% of the total market. Owing to rapid technological advances in Nano-enabled packaging solutions, rising research & development expenditures, and increased shelf life of the product in the market. Whereas the pharmaceutical industry is expected to provide a lucrative growth rate in the future, owing to increased spending in the pharmaceutical industry.
Active Packaging has dominated the Nano-enabled Packaging market. Thereby acquiring 48.2% in the year 2023. Further, it is expected to be the fastest-growing in the market, owing to the increasing need for higher protection in the food & beverages industry, rising shelf life, and increased safety of the food products.
| Attribute | Description |
|---|---|
| Market Size | Revenue (USD Billion) |
| Market size value in 2023 | USD 23 Billion |
| Market size value in 2033 | USD 78 Billion |
| CAGR (2024 to 2033) | 13% |
| Historical data | 2020-2022 |
| Base Year | 2023 |
| Forecast | 2024-2033 |
| Region | The regions analyzed for the market are Asia Pacific, Europe, South America, North America, and Middle East & Africa. Furthermore, the regions are further analyzed at the country level. |
| Segments | Application, Technology |
As per The Brainy Insights, the size of the nano-enabled packaging market was valued at USD 23 billion in 2023 to USD 78 billion by 2033.
The global nano-enabled packaging market is growing at a CAGR of 13% during the forecast period 2024-2033.
The APAC region emerged as the largest market for the Nano-enabled Packaging.
The rising demand for packaged food will influence the market's growth.
1. Introduction
1.1. Objectives of the Study
1.2. Market Definition
1.3. Research Scope
1.4. Currency
1.5. Key Target Audience
2. Research Methodology and Assumptions
3. Executive Summary
4. Premium Insights
4.1. Porter’s Five Forces Analysis
4.2. Value Chain Analysis
4.3. Top Investment Pockets
4.3.1. Market Attractiveness Analysis by Application
4.3.2. Market Attractiveness Analysis by Technology
4.3.3. Market Attractiveness Analysis by Region
4.4. Industry Trends
5. Market Dynamics
5.1. Market Evaluation
5.2. Drivers
5.2.1. Rising demand for packaged food
5.2.2. Increasing demand for various end-user industries
5.3. Restraints
5.3.1. High costs associated with Nano-enabled Packaging
5.4. Opportunities
5.4.1. Rapid technological advancements in the Nano-enabled Packaging
5.4.2. Rapidly growing environmental concerns in the global market
5.5. Challenges
5.5.1. Lower awareness in the Nano-enabled Packaging
6. Global Nano-enabled Packaging Market Analysis and Forecast, By Application
6.1. Segment Overview
6.2. Food & Beverages
6.3. Pharmaceuticals
6.4. Personal Care & Cosmetics
6.5. Consumer Electronics
6.6. Others
7. Global Nano-enabled Packaging Market Analysis and Forecast, By Technology
7.1. Segment Overview
7.2. Intelligent & Smart Packaging
7.3. Active Packaging
8. Global Nano-enabled Packaging Market Analysis and Forecast, By Regional Analysis
8.1. Segment Overview
8.2. North America
8.2.1. U.S.
8.2.2. Canada
8.2.3. Mexico
8.3. Europe
8.3.1. Germany
8.3.2. France
8.3.3. U.K.
8.3.4. Italy
8.3.5. Spain
8.4. Asia-Pacific
8.4.1. Japan
8.4.2. China
8.4.3. India
8.5. South America
8.5.1. Brazil
8.6. Middle East and Africa
8.6.1. UAE
8.6.2. South Africa
9. Global Nano-enabled Packaging Market-Competitive Landscape
9.1. Overview
9.2. Market Share of Key Players in Global Nano-enabled Packaging Market
9.2.1. Global Company Market Share
9.2.2. North America Company Market Share
9.2.3. Europe Company Market Share
9.2.4. APAC Company Market Share
9.3. Competitive Situations and Trends
9.3.1. Application Launches and Developments
9.3.2. Partnerships, Collaborations, and Agreements
9.3.3. Mergers & Acquisitions
9.3.4. Expansions
10. Company Profiles
10.1. Amcor
10.1.1. Business Overview
10.1.2. Company Snapshot
10.1.3. Company Market Share Analysis
10.1.4. Company Application Portfolio
10.1.5. Recent Developments
10.1.6. SWOT Analysis
10.2. Klockner Pentaplast
10.2.1. Business Overview
10.2.2. Company Snapshot
10.2.3. Company Market Share Analysis
10.2.4. Company Application Portfolio
10.2.5. Recent Developments
10.2.6. SWOT Analysis
10.3. Sealed Air
10.3.1. Business Overview
10.3.2. Company Snapshot
10.3.3. Company Market Share Analysis
10.3.4. Company Application Portfolio
10.3.5. Recent Developments
10.3.6. SWOT Analysis
10.4. Tetra Pak International S.A.
10.4.1. Business Overview
10.4.2. Company Snapshot
10.4.3. Company Market Share Analysis
10.4.4. Company Application Portfolio
10.4.5. Recent Developments
10.4.6. SWOT Analysis
10.5. Sonoco Products Co.
10.5.1. Business Overview
10.5.2. Company Snapshot
10.5.3. Company Market Share Analysis
10.5.4. Company Application Portfolio
10.5.5. Recent Developments
10.5.6. SWOT Analysis
10.6. CCL Industries Inc
10.6.1. Business Overview
10.6.2. Company Snapshot
10.6.3. Company Market Share Analysis
10.6.4. Company Application Portfolio
10.6.5. Recent Developments
10.6.6. SWOT Analysis
10.7. BASF SE
10.7.1. Business Overview
10.7.2. Company Snapshot
10.7.3. Company Market Share Analysis
10.7.4. Company Application Portfolio
10.7.5. Recent Developments
10.7.6. SWOT Analysis
10.8. DuPont Teijin Films
10.8.1. Business Overview
10.8.2. Company Snapshot
10.8.3. Company Market Share Analysis
10.8.4. Company Application Portfolio
10.8.5. Recent Developments
10.8.6. SWOT Analysis
10.9. Avery Dennison
10.9.1. Business Overview
10.9.2. Company Snapshot
10.9.3. Company Market Share Analysis
10.9.4. Company Application Portfolio
10.9.5. Recent Developments
10.9.6. SWOT Analysis
10.10. Checkpoint Systems Inc
10.10.1. Business Overview
10.10.2. Company Snapshot
10.10.3. Company Market Share Analysis
10.10.4. Company Application Portfolio
10.10.5. Recent Developments
10.10.6. SWOT Analysis
List of Table
1. Global Nano-enabled Packaging Market, By Application, 2020-2033 (USD Billion)
2. Global Food & Beverages, Nano-enabled Packaging Market, By Region, 2020-2033 (USD Billion)
3. Global Pharmaceuticals, Nano-enabled Packaging Market, By Region, 2020-2033 (USD Billion)
4. Global Personal Care & Cosmetics, Nano-enabled Packaging Market, By Region, 2020-2033 (USD Billion)
5. Global Consumer Electronics, Nano-enabled Packaging Market, By Region, 2020-2033 (USD Billion)
6. Global Others, Nano-enabled Packaging Market, By Region, 2020-2033 (USD Billion)
7. Global Nano-enabled Packaging Market, By Technology, 2020-2033 (USD Billion)
8. Global Intelligent & Smart Packaging, Nano-enabled Packaging Market, By Region, 2020-2033 (USD Billion)
9. Global Active Packaging, Nano-enabled Packaging Market, By Region, 2020-2033 (USD Billion)
10. Global Nano-enabled Packaging Market, By Region, 2020-2033 (USD Billion)
11. North America Nano-enabled Packaging Market, By Application, 2020-2033 (USD Billion)
12. North America Nano-enabled Packaging Market, By Technology, 2020-2033 (USD Billion)
13. U.S. Nano-enabled Packaging Market, By Application, 2020-2033 (USD Billion)
14. U.S. Nano-enabled Packaging Market, By Technology, 2020-2033 (USD Billion)
15. Canada Nano-enabled Packaging Market, By Application, 2020-2033 (USD Billion)
16. Canada Nano-enabled Packaging Market, By Technology, 2020-2033 (USD Billion)
17. Mexico Nano-enabled Packaging Market, By Application, 2020-2033 (USD Billion)
18. Mexico Nano-enabled Packaging Market, By Technology, 2020-2033 (USD Billion)
19. Europe Nano-enabled Packaging Market, By Application, 2020-2033 (USD Billion)
20. Europe Nano-enabled Packaging Market, By Technology, 2020-2033 (USD Billion)
21. Germany Nano-enabled Packaging Market, By Application, 2020-2033 (USD Billion)
22. Germany Nano-enabled Packaging Market, By Technology, 2020-2033 (USD Billion)
23. France Nano-enabled Packaging Market, By Application, 2020-2033 (USD Billion)
24. France Nano-enabled Packaging Market, By Technology, 2020-2033 (USD Billion)
25. U.K. Nano-enabled Packaging Market, By Application, 2020-2033 (USD Billion)
26. U.K. Nano-enabled Packaging Market, By Technology, 2020-2033 (USD Billion)
27. Italy Nano-enabled Packaging Market, By Application, 2020-2033 (USD Billion)
28. Italy Nano-enabled Packaging Market, By Technology, 2020-2033 (USD Billion)
29. Spain Nano-enabled Packaging Market, By Application, 2020-2033 (USD Billion)
30. Spain Nano-enabled Packaging Market, By Technology, 2020-2033 (USD Billion)
31. Asia Pacific Nano-enabled Packaging Market, By Application, 2020-2033 (USD Billion)
32. Asia Pacific Nano-enabled Packaging Market, By Technology, 2020-2033 (USD Billion)
33. Japan Nano-enabled Packaging Market, By Application, 2020-2033 (USD Billion)
34. Japan Nano-enabled Packaging Market, By Technology, 2020-2033 (USD Billion)
35. China Nano-enabled Packaging Market, By Application, 2020-2033 (USD Billion)
36. China Nano-enabled Packaging Market, By Technology, 2020-2033 (USD Billion)
37. India Nano-enabled Packaging Market, By Application, 2020-2033 (USD Billion)
38. India Nano-enabled Packaging Market, By Technology, 2020-2033 (USD Billion)
39. South America Nano-enabled Packaging Market, By Application, 2020-2033 (USD Billion)
40. South America Nano-enabled Packaging Market, By Technology, 2020-2033 (USD Billion)
41. Brazil Nano-enabled Packaging Market, By Application, 2020-2033 (USD Billion)
42. Brazil Nano-enabled Packaging Market, By Technology, 2020-2033 (USD Billion)
43. Middle East and Africa Nano-enabled Packaging Market, By Application, 2020-2033 (USD Billion)
44. Middle East and Africa Nano-enabled Packaging Market, By Technology, 2020-2033 (USD Billion)
45. UAE Nano-enabled Packaging Market, By Application, 2020-2033 (USD Billion)
46. UAE Nano-enabled Packaging Market, By Technology, 2020-2033 (USD Billion)
47. South Africa Nano-enabled Packaging Market, By Application, 2020-2033 (USD Billion)
48. South Africa Nano-enabled Packaging Market, By Technology, 2020-2033 (USD Billion)
List of Figures
1. Global Nano-enabled Packaging Market Segmentation
2. Global Nano-enabled Packaging Market: Research Methodology
3. Market Size Estimation Methodology: Bottom-Up Approach
4. Market Size Estimation Methodology: Top-Down Approach
5. Data Triangulation
6. Porter’s Five Forces Analysis
7. Value Chain Analysis
8. Global Nano-enabled Packaging Market Attractiveness Analysis by Application
9. Global Nano-enabled Packaging Market Attractiveness Analysis by Technology
10. Global Nano-enabled Packaging Market Attractiveness Analysis by Region
11. Global Nano-enabled Packaging Market: Dynamics
12. Global Nano-enabled Packaging Market Share by Application (2023 & 2033)
13. Global Nano-enabled Packaging Market Share by Technology (2023 & 2033)
14. Global Nano-enabled Packaging Market Share by Regions (2023 & 2033)
15. Global Nano-enabled Packaging Market Share by Company (2023)
This study forecasts revenue at global, regional, and country levels from 2020 to 2033. The Brainy Insights has segmented the global nano-enabled packaging market based on below-mentioned segments:
Global Nano-enabled Packaging Market by Application:
Global Nano-enabled Packaging Market by Technology:
Global Nano-enabled Packaging Market by Region:
Research has its special purpose to undertake marketing efficiently. In this competitive scenario, businesses need information across all industry verticals; the information about customer wants, market demand, competition, industry trends, distribution channels etc. This information needs to be updated regularly because businesses operate in a dynamic environment. Our organization, The Brainy Insights incorporates scientific and systematic research procedures in order to get proper market insights and industry analysis for overall business success. The analysis consists of studying the market from a miniscule level wherein we implement statistical tools which helps us in examining the data with accuracy and precision.
Our research reports feature both; quantitative and qualitative aspects for any market. Qualitative information for any market research process are fundamental because they reveal the customer needs and wants, usage and consumption for any product/service related to a specific industry. This in turn aids the marketers/investors in knowing certain perceptions of the customers. Qualitative research can enlighten about the different product concepts and designs along with unique service offering that in turn, helps define marketing problems and generate opportunities. On the other hand, quantitative research engages with the data collection process through interviews, e-mail interactions, surveys and pilot studies. Quantitative aspects for the market research are useful to validate the hypotheses generated during qualitative research method, explore empirical patterns in the data with the help of statistical tools, and finally make the market estimations.
The Brainy Insights offers comprehensive research and analysis, based on a wide assortment of factual insights gained through interviews with CXOs and global experts and secondary data from reliable sources. Our analysts and industry specialist assume vital roles in building up statistical tools and analysis models, which are used to analyse the data and arrive at accurate insights with exceedingly informative research discoveries. The data provided by our organization have proven precious to a diverse range of companies, facilitating them to address issues such as determining which products/services are the most appealing, whether or not customers use the product in the manner anticipated, the purchasing intentions of the market and many others.
Our research methodology encompasses an idyllic combination of primary and secondary initiatives. Key phases involved in this process are listed below:

The phase involves the gathering and collecting of market data and its related information with the help of different sources & research procedures.

The data procurement stage involves in data gathering and collecting through various data sources.
This stage involves in extensive research. These data sources includes:
Purchased Database: Purchased databases play a crucial role in estimating the market sizes irrespective of the domain. Our purchased database includes:
Primary Research: The Brainy Insights interacts with leading companies and experts of the concerned domain to develop the analyst team’s market understanding and expertise. It improves and substantiates every single data presented in the market reports. Primary research mainly involves in telephonic interviews, E-mail interactions and face-to-face interviews with the raw material providers, manufacturers/producers, distributors, & independent consultants. The interviews that we conduct provides valuable data on market size and industry growth trends prevailing in the market. Our organization also conducts surveys with the various industry experts in order to gain overall insights of the industry/market. For instance, in healthcare industry we conduct surveys with the pharmacists, doctors, surgeons and nurses in order to gain insights and key information of a medical product/device/equipment which the customers are going to usage. Surveys are conducted in the form of questionnaire designed by our own analyst team. Surveys plays an important role in primary research because surveys helps us to identify the key target audiences of the market. Additionally, surveys helps to identify the key target audience engaged with the market. Our survey team conducts the survey by targeting the key audience, thus gaining insights from them. Based on the perspectives of the customers, this information is utilized to formulate market strategies. Moreover, market surveys helps us to understand the current competitive situation of the industry. To be precise, our survey process typically involve with the 360 analysis of the market. This analytical process begins by identifying the prospective customers for a product or service related to the market/industry to obtain data on how a product/service could fit into customers’ lives.

Secondary Research: The secondary data sources includes information published by the on-profit organizations such as World bank, WHO, company fillings, investor presentations, annual reports, national government documents, statistical databases, blogs, articles, white papers and others. From the annual report, we analyse a company’s revenue to understand the key segment and market share of that organization in a particular region. We analyse the company websites and adopt the product mapping technique which is important for deriving the segment revenue. In the product mapping method, we select and categorize the products offered by the companies catering to domain specific market, deduce the product revenue for each of the companies so as to get overall estimation of the market size. We also source data and analyses trends based on information received from supply side and demand side intermediaries in the value chain. The supply side denotes the data gathered from supplier, distributor, wholesaler and the demand side illustrates the data gathered from the end customers for respective market domain.

The supply side for a domain specific market is analysed by:
The demand side for the market is estimated through:
In-house Library: Apart from these third-party sources, we have our in-house library of qualitative and quantitative information. Our in-house database includes market data for various industry and domains. These data are updated on regular basis as per the changing market scenario. Our library includes, historic databases, internal audit reports and archives.
Sometimes there are instances where there is no metadata or raw data available for any domain specific market. For those cases, we use our expertise to forecast and estimate the market size in order to generate comprehensive data sets. Our analyst team adopt a robust research technique in order to produce the estimates:
Data Synthesis: This stage involves the analysis & mapping of all the information obtained from the previous step. It also involves in scrutinizing the data for any discrepancy observed while data gathering related to the market. The data is collected with consideration to the heterogeneity of sources. Robust scientific techniques are in place for synthesizing disparate data sets and provide the essential contextual information that can orient market strategies. The Brainy Insights has extensive experience in data synthesis where the data passes through various stages:


Market Deduction & Formulation: The final stage comprises of assigning data points at appropriate market spaces so as to deduce feasible conclusions. Analyst perspective & subject matter expert based holistic form of market sizing coupled with industry analysis also plays a crucial role in this stage.
This stage involves in finalization of the market size and numbers that we have collected from data integration step. With data interpolation, it is made sure that there is no gap in the market data. Successful trend analysis is done by our analysts using extrapolation techniques, which provide the best possible forecasts for the market.
Data Validation & Market Feedback: Validation is the most important step in the process. Validation & re-validation via an intricately designed process helps us finalize data-points to be used for final calculations.

The Brainy Insights interacts with leading companies and experts of the concerned domain to develop the analyst team’s market understanding and expertise. It improves and substantiates every single data presented in the market reports. The data validation interview and discussion panels are typically composed of the most experienced industry members. The participants include, however, are not limited to:
Moreover, we always validate our data and findings through primary respondents from all the major regions we are working on.


Free Customization
Fortune 500 Clients
Free Yearly Update On Purchase Of Multi/Corporate License
Companies Served Till Date