- +1-315-215-1633
- sales@thebrainyinsights.com

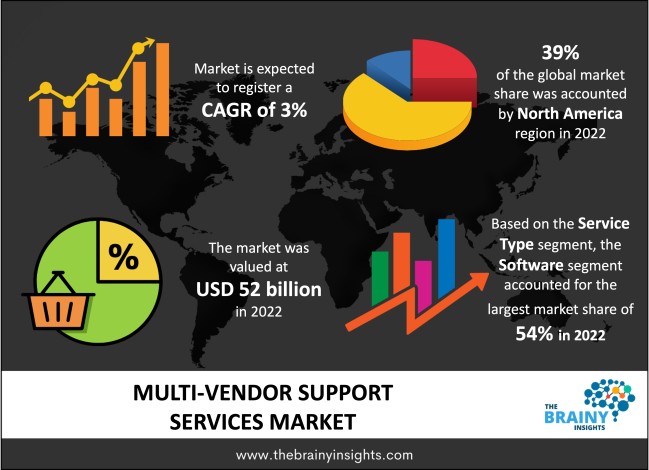
The global multi-vendor support services market is expected to grow from USD 52 billion in 2022 to USD 69.88 billion by 2032, at a CAGR of 3% from 2023-2032. The expanding IT infrastructure and services will augment the growth of the global multi-vendor support services market.
As businesses grow and their operations expand, along with increasing vendors, clients, employees, and databases, it becomes difficult for the company to manage these vast numbers of moving parts efficiently. The need to efficiently manage all the assets, customers, vendors, and employees facilitates the adoption of multi-vendor support services. Multi-vendor support services allow the company to integrate their storage, customer relations, asset and vendor management in one place. They handle all the company components at their end and offer a singular point of grievance redressal for the hiring company. A multi-vendor support service simplifies administration by switching from numerous vendor contracts to a single vendor. They have the knowledge to maintain all of the company's infrastructure. They bring expert services and personnel which improves efficiency by offering fast problem detection and quicker solutions. They offer hardware and software, and Remote Technical Support (RTS), technical assistance across the globe, 24 hours a day, seven days a week while collaborating directly with the clients. Multi-vendor support services assist in controlling the expense and complexity associated with maintaining the products and services from several OEMs and vendors. They employ cutting-edge analytics, AI-powered insights, and automation which help streamline operations, cut down inefficiencies and optimize asset management.
Get an overview of this study by requesting a free sample
March 2023 – 3i Infotech announced that the company had been chosen to supply several government departments with annual maintenance contracts. According to 3i Infotech, it is committed to generating business value across several industry sectors. It has become a key player in advancing the current wave of digital transformation initiatives, with deep domain expertise across the BFSI (banking, financial service, and insurance) and government sectors, as well as healthcare, manufacturing, education, telecom, media, and entertainment. The company claimed it has successfully transformed the business operations of over 1,200 customers across 50 countries using a digital and cloud-first approach, a variety of IT services, and solutions encompassing fifth-generation mobile system (5G) in Edge Computing, Cognitive AI/ML, Data Science and Analytics, and Blockchain.
The expanding and ever-changing IT landscape – The increasing digitization, automation, ownership of smart connected devices, and access to the internet has contributed to the IT sector's expansion. Technological advancements, product innovations, and the increasing number of market players have made the IT sector highly fragmented. The highly fragmented IT market has increased competition. The increased competition demands reduced downtime costs, better productivity, and efficiency and the regular introduction of new products and upgrades to retain customers and acquire new ones. However, the expanse of IT services like managing company assets, data storage, customers, and multiple vendors all by the company increases the risk of low efficiency and productivity, increased downtime and grievance redressals, and shifting valuable company resources from core activities of research and development. Therefore, the popularity of multi-vendor support services has increased with the expanding and changing IT landscape.
High cost of multi-vendor support services – Multi-vendor support services offer a wide range of support services, from asset management to customer relationship management. They bring in expertise and ensure enhanced productivity and efficiency. However, the high cost of multi-vendor support services will hamper the market's growth as a significant portion of market players with low capital cannot afford it. Furthermore, small and medium enterprises prefer operating all their functions through company personnel.
The growing innovation in multi-vendor support services – The use of AI, AR, big data, and other automated systems have expanded due to the expanding digitalization and automation in the world. These technologies are being used in many different economic areas to increase production and efficiency and produce quicker and more accurate results. These technological advancements to improve multi-vendor support services will offer lucrative opportunities to the market players.
The expanding scope of support services offered by multi-vendor support services – With the rising demand for support services, the providers are looking to expand their product and service offerings. The growing customization according to the needs and objectives of the clients and the integration of new technologies will positively impact the market's growth.
Lax data security and privacy laws – Companies hiring multi-vendor support services give limited exposure of the company's assets to the vendors. The propriety data, client information, IT assets, and technical and operational knowledge must be exchanged. The risk of this information leaking or being misused is high without a stringent regulatory framework. Therefore, lax data security and privacy laws will challenge the market's growth.
Lack of standardization in the services offered – The range of services required by the companies differs from one market player to another. While there is some set of standard services that are required by the majority of the companies, the details are specific to the needs, objectives and goals of each market player. The lack of standardization makes monitor, control and regulation difficult for the market. It also increases the costs of these support services, thereby challenging the market's growth in the forecast period.
The regions analyzed for the market include North America, Europe, South America, Asia Pacific, the Middle East, and Africa. North America emerged as the largest global multi-vendor support services market, with a 39% market revenue share in 2022. Significant tech giants and new emerging market players are headquartered in the region. The USA dominates the North American region, given the rapid pace of technological advancement and innovation in the country across domains. The increasing capital expenditure towards developing high-end technological devices, systems and processes to stay ahead in the competitive market has contributed positively to the regional multi-vendor support services market’s growth. The need to focus on advancing solutions rather than maintenance of services and regular operations has encouraged the market players to hire MVSS to reduce operational costs, save time and focus more core activities of the company.
North America Region Multi-Vendor Support Services Market Share in 2022 - 39%
www.thebrainyinsights.com
Check the geographical analysis of this market by requesting a free sample
The service type is divided into hardware and software. The software segment dominated the market with a market share of around 54% in 2022. Software support services offer users technical product help and guidance. Remote troubleshooting capabilities, installation assistance, and IT maintenance support are typical components of software support services. The increasing use of Cloud platform services for IT and software support will augment the segment's growth. The global automation and digitization of economic units will propel the segment's development. The rising technological capabilities enabling remote control of business operations and monitoring services have increased the use of software support services in the BFSI, IT, Telecom and manufacturing sectors.
The organization type is divided into small and medium enterprises and large enterprises. The large enterprises' segment dominated the market with a market share of around 58% in 2022. Large firms are defined by different criteria in each state. However, a company is classified as a large enterprise or corporation based on key factors. An organization qualifies as a major enterprise if it employs many people, has a significant market presence, and generates a sizable number of sales or money each year. They have a wider audience as well as more clients and customers. These enterprises have the capital to hire a third party to keep their non-core activities running without utilizing the fundamental effort and time of company resources that can be used in the core activities. The wide range and scope of operations make hiring experts a better alternative than managing everything through the company. Therefore, its dominance in the market will be driven by the rising need, willingness, and capabilities of large organizations to utilize multi-vendor support services to optimize their company resources and enhance work efficiency.
The application is divided into financial and accounting, supply chain, sales and marketing, human resource, IT operations, production, research and development, legal services, and others. The sales and marketing segment dominated the market with a market share of around 34% in 2022. The company's sales and marketing section decides where to sell and how much to charge. This entails making a decision about the employment of intermediaries by the company. The departments of sales and marketing are essential to every company. They are connected and act as a catalyst for generating revenue, which is the main objective and a requirement to keep the business afloat. Sales convert prospective customers into paying customers, whereas marketing focuses on spreading awareness of a company's products and services. Any organization's sales and marketing divisions must function well for the company to be successful. To fill the gap between the needs of potential customers and the products and services available, sales and marketing play a unique and important role in acquiring new customers and maintaining existing ones. Given their knowledge in the field, the multi-vendor support service improves sales by improving consumer interaction. Employing multi-vendor support services helps organizations to concentrate on creating products or other core business operations.
The industry vertical is divided into BFSI, retail and consumer goods, travel and logistics, government and defence, energy and utilities, healthcare and life sciences, manufacturing, telecom and IT, media and entertainment, automotive, education, building and construction, recreational services and others. The telecom and IT segment dominated the market with a market share of around 26% in 2022. Telecommunications offers technology-assisted communication, and information technology is data interchange utilizing computers. The rapid pace of changes and upgrades in the telecom and IT sector has increased the need for the market players to stay competitive with new products, software, technologies, systems and hardware. Focusing on their core research and development, product innovation, and regular technological upgradation is vital for retaining a competitive edge in the market. Therefore, they hire multi-vendor support services to oversee their already established infrastructure, services, customer grievances etc. The decentralization enhances efficiency, improves productivity, and saves valuable time and money for the company. Hiring multi-vendor support services allows flexibility as well.
| Attribute | Description |
|---|---|
| Market Size | Revenue (USD Billion) |
| Market size value in 2022 | USD 52 Billion |
| Market size value in 2032 | USD 69.88 Billion |
| CAGR (2023 to 2032) | 3% |
| Historical data | 2019-2021 |
| Base Year | 2022 |
| Forecast | 2023-2032 |
| Regional Segments | The regions examined for the market are Europe, Asia Pacific, North America, South America, and Middle East & Africa. |
| Segments | The research segment is based on service type, organization type, application and industry vertical. |
As per The Brainy Insights, the size of the global multi-vendor support services market was valued at USD 52 billion in 2022 to USD 69.88 billion by 2032.
Global multi-vendor support services market is growing at a CAGR of 3% during the forecast period 2023-2032.
The market's growth will be influenced by the expanding and ever-changing IT landscape.
High cost of multi-vendor support services could hamper the market growth.
1. Introduction
1.1. Objectives of the Study
1.2. Market Definition
1.3. Research Scope
1.4. Currency
1.5. Key Target Audience
2. Research Methodology and Assumptions
3. Executive Summary
4. Premium Insights
4.1. Porter’s Five Forces Analysis
4.2. Value Chain Analysis
4.3. Top Investment Pockets
4.3.1. Market Attractiveness Analysis by Service Type
4.3.2. Market Attractiveness Analysis by Organization Type
4.3.3. Market Attractiveness Analysis by Application
4.3.4. Market Attractiveness Analysis by Industry Vertical
4.3.5. Market Attractiveness Analysis by Region
4.4. Industry Trends
5. Market Dynamics
5.1. Market Evaluation
5.2. Drivers
5.2.1. The expanding and ever-changing IT landscape
5.3. Restraints
5.3.1. High cost of multi-vendor support services
5.4. Opportunities
5.4.1. The growing innovation in multi-vendor support services
5.4.2. The expanding scope of support services offered by multi-vendor support services
5.5. Challenges
5.5.1. Lax data security and privacy laws
5.5.2. Lack of standardisation in the services offered
6. Global Multi-Vendor Support Services Market Analysis and Forecast, By Service Type
6.1. Segment Overview
6.2. Hardware
6.3. Software
7. Global Multi-Vendor Support Services Market Analysis and Forecast, By Organization Type
7.1. Segment Overview
7.2. Small and Medium Enterprises
7.3. Large Enterprises
8. Global Multi-Vendor Support Services Market Analysis and Forecast, By Application
8.1. Segment Overview
8.2. Financial and Accounting
8.3. Supply Chain
8.4. Sales and Marketing
8.5. Human Resource
8.6. IT Operations
8.7. Production
8.8. Research and Development
8.9. Legal Services
8.10. Others
9. Global Multi-Vendor Support Services Market Analysis and Forecast, By Industry Vertical
9.1. Segment Overview
9.2. BFSI
9.3. Retail and Consumer Goods
9.4. Travel and Logistics
9.5. Government and Defence
9.6. Energy and Utilities
9.7. Healthcare and Life Sciences
9.8. Manufacturing
9.9. Telecom and IT
9.10. Media and Entertainment
9.11. Automotive
9.12. Education
9.13. Building and Construction
9.14. Recreational Services
9.15. Others
10. Global Multi-Vendor Support Services Market Analysis and Forecast, By Regional Analysis
10.1. Segment Overview
10.2. North America
10.2.1. U.S.
10.2.2. Canada
10.2.3. Mexico
10.3. Europe
10.3.1. Germany
10.3.2. France
10.3.3. U.K.
10.3.4. Italy
10.3.5. Spain
10.4. Asia-Pacific
10.4.1. Japan
10.4.2. China
10.4.3. India
10.5. South America
10.5.1. Brazil
10.6. Middle East and Africa
10.6.1. UAE
10.6.2. South Africa
11. Global Multi-Vendor Support Services Market-Competitive Landscape
11.1. Overview
11.2. Market Share of Key Players in the Multi-Vendor Support Services Market
11.2.1. Global Company Market Share
11.2.2. North America Company Market Share
11.2.3. Europe Company Market Share
11.2.4. APAC Company Market Share
11.3. Competitive Situations and Trends
11.3.1. Product Launches and Developments
11.3.2. Partnerships, Collaborations, and Agreements
11.3.3. Mergers & Acquisitions
11.3.4. Expansions
12. Company Profiles
12.1. Dell Technologies Inc.
12.1.1. Business Overview
12.1.2. Company Snapshot
12.1.3. Company Market Share Analysis
12.1.4. Company Product Portfolio
12.1.5. Recent Developments
12.1.6. SWOT Analysis
12.2. Fujitsu Ltd.
12.2.1. Business Overview
12.2.2. Company Snapshot
12.2.3. Company Market Share Analysis
12.2.4. Company Product Portfolio
12.2.5. Recent Developments
12.2.6. SWOT Analysis
12.3. Hitachi Limited
12.3.1. Business Overview
12.3.2. Company Snapshot
12.3.3. Company Market Share Analysis
12.3.4. Company Product Portfolio
12.3.5. Recent Developments
12.3.6. SWOT Analysis
12.4. HP
12.4.1. Business Overview
12.4.2. Company Snapshot
12.4.3. Company Market Share Analysis
12.4.4. Company Product Portfolio
12.4.5. Recent Developments
12.4.6. SWOT Analysis
12.5. IBM Corporation
12.5.1. Business Overview
12.5.2. Company Snapshot
12.5.3. Company Market Share Analysis
12.5.4. Company Product Portfolio
12.5.5. Recent Developments
12.5.6. SWOT Analysis
12.6. Lenovo Group Limited
12.6.1. Business Overview
12.6.2. Company Snapshot
12.6.3. Company Market Share Analysis
12.6.4. Company Product Portfolio
12.6.5. Recent Developments
12.6.6. SWOT Analysis
12.7. Microsoft Corporation
12.7.1. Business Overview
12.7.2. Company Snapshot
12.7.3. Company Market Share Analysis
12.7.4. Company Product Portfolio
12.7.5. Recent Developments
12.7.6. SWOT Analysis
12.8. NEC Corporation
12.8.1. Business Overview
12.8.2. Company Snapshot
12.8.3. Company Market Share Analysis
12.8.4. Company Product Portfolio
12.8.5. Recent Developments
12.8.6. SWOT Analysis
12.9. Oracle Corporation
12.9.1. Business Overview
12.9.2. Company Snapshot
12.9.3. Company Market Share Analysis
12.9.4. Company Product Portfolio
12.9.5. Recent Developments
12.9.6. SWOT Analysis
12.10. Symantec
12.10.1. Business Overview
12.10.2. Company Snapshot
12.10.3. Company Market Share Analysis
12.10.4. Company Product Portfolio
12.10.5. Recent Developments
12.10.6. SWOT Analysis
List of Table
1. Global Multi-Vendor Support Services Market, By Service Type, 2019-2032 (USD Billion)
2. Global Hardware Multi-Vendor Support Services Market, By Region, 2019-2032 (USD Billion)
3. Global Software Multi-Vendor Support Services Market, By Region, 2019-2032 (USD Billion)
4. Global Multi-Vendor Support Services Market, By Organization Type, 2019-2032 (USD Billion)
5. Global Small and Medium Enterprises Multi-Vendor Support Services Market, By Region, 2019-2032 (USD Billion)
6. Global Large Enterprises Multi-Vendor Support Services Market, By Region, 2019-2032 (USD Billion)
7. Global Multi-Vendor Support Services Market, By Application, 2019-2032 (USD Billion)
8. Global Financial and Accounting Multi-Vendor Support Services Market, By Region, 2019-2032 (USD Billion)
9. Global Supply Chain Multi-Vendor Support Services Market, By Region, 2019-2032 (USD Billion)
10. Global Sales and Marketing Multi-Vendor Support Services Market, By Region, 2019-2032 (USD Billion)
11. Global Human Resource Multi-Vendor Support Services Market, By Region, 2019-2032 (USD Billion)
12. Global IT Operations Multi-Vendor Support Services Market, By Region, 2019-2032 (USD Billion)
13. Global Production Multi-Vendor Support Services Market, By Region, 2019-2032 (USD Billion)
14. Global Research and Development Multi-Vendor Support Services Market, By Region, 2019-2032 (USD Billion)
15. Global Legal Services Multi-Vendor Support Services Market, By Region, 2019-2032 (USD Billion)
16. Global Others Multi-Vendor Support Services Market, By Region, 2019-2032 (USD Billion)
17. Global Multi-Vendor Support Services Market, By Industry Vertical, 2019-2032 (USD Billion)
18. Global BFSI Multi-Vendor Support Services Market, By Region, 2019-2032 (USD Billion)
19. Global Retail and Consumer Goods Multi-Vendor Support Services Market, By Region, 2019-2032 (USD Billion)
20. Global Travel and Logistics Multi-Vendor Support Services Market, By Region, 2019-2032 (USD Billion)
21. Global Government and Defence Multi-Vendor Support Services Market, By Region, 2019-2032 (USD Billion)
22. Global Energy and Utilities Multi-Vendor Support Services Market, By Region, 2019-2032 (USD Billion)
23. Global Healthcare and Life Sciences Multi-Vendor Support Services Market, By Region, 2019-2032 (USD Billion)
24. Global Manufacturing Multi-Vendor Support Services Market, By Region, 2019-2032 (USD Billion)
25. Global Telecom and IT Multi-Vendor Support Services Market, By Region, 2019-2032 (USD Billion)
26. Global Media and Entertainment Multi-Vendor Support Services Market, By Region, 2019-2032 (USD Billion)
27. Global Automotive Multi-Vendor Support Services Market, By Region, 2019-2032 (USD Billion)
28. Global Education Multi-Vendor Support Services Market, By Region, 2019-2032 (USD Billion)
29. Global Building and Construction Multi-Vendor Support Services Market, By Region, 2019-2032 (USD Billion)
30. Global Recreational Services Multi-Vendor Support Services Market, By Region, 2019-2032 (USD Billion)
31. Global Others Multi-Vendor Support Services Market, By Region, 2019-2032 (USD Billion)
32. Global Multi-Vendor Support Services Market, By Region, 2019-2032 (USD Billion)
33. North America Multi-Vendor Support Services Market, By Service Type, 2019-2032 (USD Billion)
34. North America Multi-Vendor Support Services Market, By Organization Type, 2019-2032 (USD Billion)
35. North America Multi-Vendor Support Services Market, By Application, 2019-2032 (USD Billion)
36. North America Multi-Vendor Support Services Market, By Industry Vertical, 2019-2032 (USD Billion)
37. U.S. Multi-Vendor Support Services Market, By Service Type, 2019-2032 (USD Billion)
38. U.S. Multi-Vendor Support Services Market, By Organization Type, 2019-2032 (USD Billion)
39. U.S. Multi-Vendor Support Services Market, By Application, 2019-2032 (USD Billion)
40. U.S. Multi-Vendor Support Services Market, By Industry Vertical, 2019-2032 (USD Billion)
41. Canada Multi-Vendor Support Services Market, By Service Type, 2019-2032 (USD Billion)
42. Canada Multi-Vendor Support Services Market, By Organization Type, 2019-2032 (USD Billion)
43. Canada Multi-Vendor Support Services Market, By Application, 2019-2032 (USD Billion)
44. Canada Multi-Vendor Support Services Market, By Industry Vertical, 2019-2032 (USD Billion)
45. Mexico Multi-Vendor Support Services Market, By Service Type, 2019-2032 (USD Billion)
46. Mexico Multi-Vendor Support Services Market, By Organization Type, 2019-2032 (USD Billion)
47. Mexico Multi-Vendor Support Services Market, By Application, 2019-2032 (USD Billion)
48. Mexico Multi-Vendor Support Services Market, By Industry Vertical, 2019-2032 (USD Billion)
49. Europe Multi-Vendor Support Services Market, By Service Type, 2019-2032 (USD Billion)
50. Europe Multi-Vendor Support Services Market, By Organization Type, 2019-2032 (USD Billion)
51. Europe Multi-Vendor Support Services Market, By Application, 2019-2032 (USD Billion)
52. Europe Multi-Vendor Support Services Market, By Industry Vertical, 2019-2032 (USD Billion)
53. Germany Multi-Vendor Support Services Market, By Service Type, 2019-2032 (USD Billion)
54. Germany Multi-Vendor Support Services Market, By Organization Type, 2019-2032 (USD Billion)
55. Germany Multi-Vendor Support Services Market, By Application, 2019-2032 (USD Billion)
56. Germany Multi-Vendor Support Services Market, By Industry Vertical, 2019-2032 (USD Billion)
57. France Multi-Vendor Support Services Market, By Service Type, 2019-2032 (USD Billion)
58. France Multi-Vendor Support Services Market, By Organization Type, 2019-2032 (USD Billion)
59. France Multi-Vendor Support Services Market, By Application, 2019-2032 (USD Billion)
60. France Multi-Vendor Support Services Market, By Industry Vertical, 2019-2032 (USD Billion)
61. U.K. Multi-Vendor Support Services Market, By Service Type, 2019-2032 (USD Billion)
62. U.K. Multi-Vendor Support Services Market, By Organization Type, 2019-2032 (USD Billion)
63. U.K. Multi-Vendor Support Services Market, By Application, 2019-2032 (USD Billion)
64. U.K. Multi-Vendor Support Services Market, By Industry Vertical, 2019-2032 (USD Billion)
65. Italy Multi-Vendor Support Services Market, By Service Type, 2019-2032 (USD Billion)
66. Italy Multi-Vendor Support Services Market, By Organization Type, 2019-2032 (USD Billion)
67. Italy Multi-Vendor Support Services Market, By Application, 2019-2032 (USD Billion)
68. Italy Multi-Vendor Support Services Market, By Industry Vertical, 2019-2032 (USD Billion)
69. Spain Multi-Vendor Support Services Market, By Service Type, 2019-2032 (USD Billion)
70. Spain Multi-Vendor Support Services Market, By Organization Type, 2019-2032 (USD Billion)
71. Spain Multi-Vendor Support Services Market, By Application, 2019-2032 (USD Billion)
72. Spain Multi-Vendor Support Services Market, By Industry Vertical, 2019-2032 (USD Billion)
73. Asia Pacific Multi-Vendor Support Services Market, By Service Type, 2019-2032 (USD Billion)
74. Asia Pacific Multi-Vendor Support Services Market, By Organization Type, 2019-2032 (USD Billion)
75. Asia Pacific Multi-Vendor Support Services Market, By Application, 2019-2032 (USD Billion)
76. Asia Pacific Multi-Vendor Support Services Market, By Industry Vertical, 2019-2032 (USD Billion)
77. Japan Multi-Vendor Support Services Market, By Service Type, 2019-2032 (USD Billion)
78. Japan Multi-Vendor Support Services Market, By Organization Type, 2019-2032 (USD Billion)
79. Japan Multi-Vendor Support Services Market, By Application, 2019-2032 (USD Billion)
80. Japan Multi-Vendor Support Services Market, By Industry Vertical, 2019-2032 (USD Billion)
81. China Multi-Vendor Support Services Market, By Service Type, 2019-2032 (USD Billion)
82. China Multi-Vendor Support Services Market, By Organization Type, 2019-2032 (USD Billion)
83. China Multi-Vendor Support Services Market, By Application, 2019-2032 (USD Billion)
84. China Multi-Vendor Support Services Market, By Industry Vertical, 2019-2032 (USD Billion)
85. India Multi-Vendor Support Services Market, By Service Type, 2019-2032 (USD Billion)
86. India Multi-Vendor Support Services Market, By Organization Type, 2019-2032 (USD Billion)
87. India Multi-Vendor Support Services Market, By Application, 2019-2032 (USD Billion)
88. India Multi-Vendor Support Services Market, By Industry Vertical, 2019-2032 (USD Billion)
89. South America Multi-Vendor Support Services Market, By Service Type, 2019-2032 (USD Billion)
90. South America Multi-Vendor Support Services Market, By Organization Type, 2019-2032 (USD Billion)
91. South America Multi-Vendor Support Services Market, By Application, 2019-2032 (USD Billion)
92. South America Multi-Vendor Support Services Market, By Industry Vertical, 2019-2032 (USD Billion)
93. Brazil Multi-Vendor Support Services Market, By Service Type, 2019-2032 (USD Billion)
94. Brazil Multi-Vendor Support Services Market, By Organization Type, 2019-2032 (USD Billion)
95. Brazil Multi-Vendor Support Services Market, By Application, 2019-2032 (USD Billion)
96. Brazil Multi-Vendor Support Services Market, By Industry Vertical, 2019-2032 (USD Billion)
97. Middle East and Africa Multi-Vendor Support Services Market, By Service Type, 2019-2032 (USD Billion)
98. Middle East and Africa Multi-Vendor Support Services Market, By Organization Type, 2019-2032 (USD Billion)
99. Middle East and Africa Multi-Vendor Support Services Market, By Application, 2019-2032 (USD Billion)
100. Middle East and Africa Multi-Vendor Support Services Market, By Industry Vertical, 2019-2032 (USD Billion)
101. UAE Multi-Vendor Support Services Market, By Service Type, 2019-2032 (USD Billion)
102. UAE Multi-Vendor Support Services Market, By Organization Type, 2019-2032 (USD Billion)
103. UAE Multi-Vendor Support Services Market, By Application, 2019-2032 (USD Billion)
104. UAE Multi-Vendor Support Services Market, By Industry Vertical, 2019-2032 (USD Billion)
105. South Africa Multi-Vendor Support Services Market, By Service Type, 2019-2032 (USD Billion)
106. South Africa Multi-Vendor Support Services Market, By Organization Type, 2019-2032 (USD Billion)
107. South Africa Multi-Vendor Support Services Market, By Application, 2019-2032 (USD Billion)
108. South Africa Multi-Vendor Support Services Market, By Industry Vertical, 2019-2032 (USD Billion)
List of Figures
1. Global Multi-Vendor Support Services Market Segmentation
2. Multi-Vendor Support Services Market: Research Methodology
3. Market Size Estimation Methodology: Bottom-Up Approach
4. Market Size Estimation Methodology: Top-Down Approach
5. Data Triangulation
6. Porter’s Five Forces Analysis
7. Value Chain Analysis
8. Global Multi-Vendor Support Services Market Attractiveness Analysis by Service Type
9. Global Multi-Vendor Support Services Market Attractiveness Analysis by Organization Type
10. Global Multi-Vendor Support Services Market Attractiveness Analysis by Application
11. Global Multi-Vendor Support Services Market Attractiveness Analysis by Industry Vertical
12. Global Multi-Vendor Support Services Market Attractiveness Analysis by Region
13. Global Multi-Vendor Support Services Market: Dynamics
14. Global Multi-Vendor Support Services Market Share by Service Type (2022 & 2032)
15. Global Multi-Vendor Support Services Market Share by Organization Type (2022 & 2032)
16. Global Multi-Vendor Support Services Market Share by Application (2022 & 2032)
17. Global Multi-Vendor Support Services Market Share by Industry Vertical (2022 & 2032)
18. Global Multi-Vendor Support Services Market Share by Regions (2022 & 2032)
19. Global Multi-Vendor Support Services Market Share by Company (2022)
This study forecasts revenue at global, regional, and country levels from 2019 to 2032. The Brainy Insights has segmented the global multi-vendor support services market based on below mentioned segments:
Global Multi-Vendor Support Services Market by Service Type:
Global Multi-Vendor Support Services Market by Organization Type:
Global Multi-Vendor Support Services Market by Application:
Global Multi-Vendor Support Services Market by Industry Vertical:
Global Multi-Vendor Support Services Market by Region:
Research has its special purpose to undertake marketing efficiently. In this competitive scenario, businesses need information across all industry verticals; the information about customer wants, market demand, competition, industry trends, distribution channels etc. This information needs to be updated regularly because businesses operate in a dynamic environment. Our organization, The Brainy Insights incorporates scientific and systematic research procedures in order to get proper market insights and industry analysis for overall business success. The analysis consists of studying the market from a miniscule level wherein we implement statistical tools which helps us in examining the data with accuracy and precision.
Our research reports feature both; quantitative and qualitative aspects for any market. Qualitative information for any market research process are fundamental because they reveal the customer needs and wants, usage and consumption for any product/service related to a specific industry. This in turn aids the marketers/investors in knowing certain perceptions of the customers. Qualitative research can enlighten about the different product concepts and designs along with unique service offering that in turn, helps define marketing problems and generate opportunities. On the other hand, quantitative research engages with the data collection process through interviews, e-mail interactions, surveys and pilot studies. Quantitative aspects for the market research are useful to validate the hypotheses generated during qualitative research method, explore empirical patterns in the data with the help of statistical tools, and finally make the market estimations.
The Brainy Insights offers comprehensive research and analysis, based on a wide assortment of factual insights gained through interviews with CXOs and global experts and secondary data from reliable sources. Our analysts and industry specialist assume vital roles in building up statistical tools and analysis models, which are used to analyse the data and arrive at accurate insights with exceedingly informative research discoveries. The data provided by our organization have proven precious to a diverse range of companies, facilitating them to address issues such as determining which products/services are the most appealing, whether or not customers use the product in the manner anticipated, the purchasing intentions of the market and many others.
Our research methodology encompasses an idyllic combination of primary and secondary initiatives. Key phases involved in this process are listed below:

The phase involves the gathering and collecting of market data and its related information with the help of different sources & research procedures.

The data procurement stage involves in data gathering and collecting through various data sources.
This stage involves in extensive research. These data sources includes:
Purchased Database: Purchased databases play a crucial role in estimating the market sizes irrespective of the domain. Our purchased database includes:
Primary Research: The Brainy Insights interacts with leading companies and experts of the concerned domain to develop the analyst team’s market understanding and expertise. It improves and substantiates every single data presented in the market reports. Primary research mainly involves in telephonic interviews, E-mail interactions and face-to-face interviews with the raw material providers, manufacturers/producers, distributors, & independent consultants. The interviews that we conduct provides valuable data on market size and industry growth trends prevailing in the market. Our organization also conducts surveys with the various industry experts in order to gain overall insights of the industry/market. For instance, in healthcare industry we conduct surveys with the pharmacists, doctors, surgeons and nurses in order to gain insights and key information of a medical product/device/equipment which the customers are going to usage. Surveys are conducted in the form of questionnaire designed by our own analyst team. Surveys plays an important role in primary research because surveys helps us to identify the key target audiences of the market. Additionally, surveys helps to identify the key target audience engaged with the market. Our survey team conducts the survey by targeting the key audience, thus gaining insights from them. Based on the perspectives of the customers, this information is utilized to formulate market strategies. Moreover, market surveys helps us to understand the current competitive situation of the industry. To be precise, our survey process typically involve with the 360 analysis of the market. This analytical process begins by identifying the prospective customers for a product or service related to the market/industry to obtain data on how a product/service could fit into customers’ lives.

Secondary Research: The secondary data sources includes information published by the on-profit organizations such as World bank, WHO, company fillings, investor presentations, annual reports, national government documents, statistical databases, blogs, articles, white papers and others. From the annual report, we analyse a company’s revenue to understand the key segment and market share of that organization in a particular region. We analyse the company websites and adopt the product mapping technique which is important for deriving the segment revenue. In the product mapping method, we select and categorize the products offered by the companies catering to domain specific market, deduce the product revenue for each of the companies so as to get overall estimation of the market size. We also source data and analyses trends based on information received from supply side and demand side intermediaries in the value chain. The supply side denotes the data gathered from supplier, distributor, wholesaler and the demand side illustrates the data gathered from the end customers for respective market domain.

The supply side for a domain specific market is analysed by:
The demand side for the market is estimated through:
In-house Library: Apart from these third-party sources, we have our in-house library of qualitative and quantitative information. Our in-house database includes market data for various industry and domains. These data are updated on regular basis as per the changing market scenario. Our library includes, historic databases, internal audit reports and archives.
Sometimes there are instances where there is no metadata or raw data available for any domain specific market. For those cases, we use our expertise to forecast and estimate the market size in order to generate comprehensive data sets. Our analyst team adopt a robust research technique in order to produce the estimates:
Data Synthesis: This stage involves the analysis & mapping of all the information obtained from the previous step. It also involves in scrutinizing the data for any discrepancy observed while data gathering related to the market. The data is collected with consideration to the heterogeneity of sources. Robust scientific techniques are in place for synthesizing disparate data sets and provide the essential contextual information that can orient market strategies. The Brainy Insights has extensive experience in data synthesis where the data passes through various stages:


Market Deduction & Formulation: The final stage comprises of assigning data points at appropriate market spaces so as to deduce feasible conclusions. Analyst perspective & subject matter expert based holistic form of market sizing coupled with industry analysis also plays a crucial role in this stage.
This stage involves in finalization of the market size and numbers that we have collected from data integration step. With data interpolation, it is made sure that there is no gap in the market data. Successful trend analysis is done by our analysts using extrapolation techniques, which provide the best possible forecasts for the market.
Data Validation & Market Feedback: Validation is the most important step in the process. Validation & re-validation via an intricately designed process helps us finalize data-points to be used for final calculations.

The Brainy Insights interacts with leading companies and experts of the concerned domain to develop the analyst team’s market understanding and expertise. It improves and substantiates every single data presented in the market reports. The data validation interview and discussion panels are typically composed of the most experienced industry members. The participants include, however, are not limited to:
Moreover, we always validate our data and findings through primary respondents from all the major regions we are working on.


Free Customization
Fortune 500 Clients
Free Yearly Update On Purchase Of Multi/Corporate License
Companies Served Till Date