- +1-315-215-1633
- sales@thebrainyinsights.com

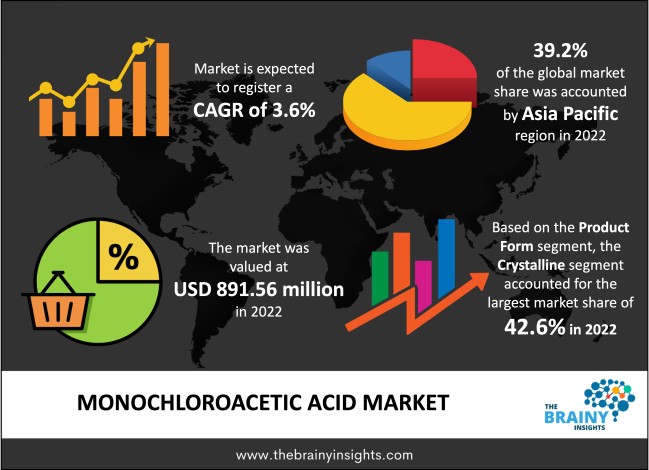
The global monochloroacetic acid market is expected to reach USD 1,269.84 million by 2032, at a CAGR of 3.6% during the forecast period 2023 to 2032. North America is expected to grow the fastest during the forecast period.
A carboxylic acid, monochloroacetic acid, originates from acetic acid's chlorination and trichloroethylene's hydrolysis. It has a pungent smell, is colourless and crystalline, and is highly soluble in organic solvents and water. In addition to pesticides, drugs, dyes, and thickening agents like carboxymethyl starch and carboxymethyl cellulose, it is also used to synthesize various other derivatives, including surfactants, plastic stabilizers, drilling fluids, herbicides, and pharmaceuticals. The personal care and cosmetic industry rely heavily on mono-chloroacetic acid (MCA), as it makes betaines, which are amphoteric surfactants. Because of its foaming properties, MCA is used in hair shampoos. There are a variety of treatments that use mono-chloroacetic acid to treat skin lesions, verrucae, and atherosclerosis. MCAAs are also precursors to adrenaline, a stress hormone known as a treatment. Monochloroacetic acid market growth is also influenced by rapid industrialization, a surge in investments, and the use of agrochemicals such as insecticides, pesticides, herbicides, and fungicides. In addition, the growing population and the rising purchasing power parity of the market will provide profitable opportunities to market players in the forecast period. Furthermore, the fluctuation in the raw material prices of acetic acid is expected to hinder the market's development. At the same time, concerns regarding the harmful effects of MCA exposure could challenge the monochloroacetic acid (MCA) market in the future.
Get an overview of this study by requesting a free sample
Changing fashion trends- There has been a surge in demand for clothing and textiles in emerging nations due to the growing population and evolving fashion sense. The textile industry uses monochloroacetic acid as an intermediate in the fusion of indigo dyes, which is expected to positively affect the overall mono-chloroacetic acid industry.
Availability of alternatives in the market- There are several alternatives for monochloroacetic acid, which reduces the sale of original products, thus restraining the market's growth. Price fluctuations and volatile raw material supplies also hinder the market growth.
Increased demand for agrochemicals- In the agricultural industry, technological advancements, limited arable land availability, environmental concerns, and improvements in plant breeding and management expertise have led to increased use of agrochemicals worldwide. Almost $40 billion is lost to U.S. plants and forest crop production each year to pests and pathogens, according to a finding in Proceedings of the National Academy of Sciences (PNAS).
High operation and maintenance cost- The high maintenance and operational costs involved with the MCA route are challenging for factories operating by that route because of the MCA's corrosive nature. As a result, the production of synthesis by this route represents a significant challenge for producers of monochloroacetic acid globally.
The regions analyzed for the market include North America, Europe, South America, Asia Pacific, the Middle East, and Africa. Asia Pacific emerged as the most significant global monochloroacetic acid market, with a 39.2% market revenue share in 2022.
Asia Pacific dominates the monochloroacetic acid market with a 39.2% market revenue share in 2022. Due to increasing demand from various end-user industries such as personal care and pharmaceuticals, agrochemicals, and others, the Asia-Pacific region dominated the global market share. Due to increased concerns about hygiene and cleanliness, the demand for detergents, personal care products, and washing soaps has increased, leading to a rise in MCA demand since it is needed to produce these products.
North America is expected to witness the fastest growth during the forecast period due to the growing agriculture spending in Mexico, the U.S. and Canada. Furthermore, people's worries about hygiene and cleanliness have grown, and so has the demand for personal care products, detergents, and washing soaps. As MCA is required to produce various personal care items, demand for it is expected to rise.
Asia Pacific Region Monochloroacetic Acid Market Share in 2022 - 39.2%
www.thebrainyinsights.com
Check the geographical analysis of this market by requesting a free sample
The product form segment is divided into flakes, crystalline and liquid. The crystalline segment dominated the market, with a share of around 42.6% in 2022. As a result of its ease of production process and low cost, the crystalline product form segment held the largest market share during the forecasted period. On the other hand, liquid segments are expected to grow significantly due to their easy miscibility as easy and effective processes.
The application segment is divided into agrochemicals, thioglycolic acid, carboxymethylcellulose, surfactants and others. The carboxymethylcellulose segment dominated the market, with a market share of around 29.6% in 2022. Due to its widespread use in various end-use businesses like oil and gas, material, paints and coatings, food, and drink, carboxymethylcellulose (CMC) is the largest consumer of monochloroacetic acid. Increasing demand for surfactants in detergents, frothing specialists, emulsifiers, wetting specialists, and dispersants, which are used for individual consideration items, will drive the market.
| Attribute | Description |
|---|---|
| Market Size | Revenue (USD Billion) |
| Market size value in 2022 | USD 891.56 million |
| Market size value in 2032 | USD 1,269.84 million |
| CAGR (2023 to 2032) | 3.6% |
| Historical data | 2019-2021 |
| Base Year | 2022 |
| Forecast | 2023-2032 |
| Regional Segments | North America, Asia Pacific, Europe, Latin America, Middle East and Africa |
| Segments | Product Form, Application |
As per The Brainy Insights, the size of the monochloroacetic acid market was valued at USD 891.56 million in 2022 to USD 1,269.84 million by 2032.
The global monochloroacetic acid market is growing at a CAGR of 3.6% during the forecast period 2023-2032.
Asia Pacific emerged as the largest monochloroacetic acid market.
1. Introduction
1.1. Objectives of the Study
1.2. Market Definition
1.3. Research Scope
1.4. Currency
1.5. Key Target Audience
2. Research Methodology and Assumptions
3. Executive Summary
4. Premium Insights
4.1. Porter’s Five Forces Analysis
4.2. Value Chain Analysis
4.3. Top Investment Pockets
4.3.1. Market Attractiveness Analysis by Product Form
4.3.2. Market Attractiveness Analysis by Application
4.3.3. Market Attractiveness Analysis by Region
4.4. Industry Trends
5. Market Dynamics
5.1. Market Evaluation
5.2. Drivers
5.2.1. Changing fashion trends
5.3. Restraints
5.3.1. Availability of alternatives in the market
5.4. Opportunities
5.4.1. Increased demand for agrochemicals
5.5. Challenges
5.5.1. High operation and maintenance cost
6. Global Monochloroacetic Acid Market Analysis and Forecast, By Product Form
6.1. Segment Overview
6.2. Flakes
6.3. Crystalline
6.4. Liquid
7. Global Monochloroacetic Acid Market Analysis and Forecast, By Application
7.1. Segment Overview
7.2. Agrochemicals
7.3. Thioglycolic Acid
7.4. Carboxymethylcellulose
7.5. Surfactants
7.6. Others
8. Global Monochloroacetic Acid Market Analysis and Forecast, By Regional Analysis
8.1. Segment Overview
8.2. North America
8.2.1. U.S.
8.2.2. Canada
8.2.3. Mexico
8.3. Europe
8.3.1. Germany
8.3.2. France
8.3.3. U.K.
8.3.4. Italy
8.3.5. Spain
8.4. Asia-Pacific
8.4.1. Japan
8.4.2. China
8.4.3. India
8.5. South America
8.5.1. Brazil
8.6. Middle East and Africa
8.6.1. UAE
8.6.2. South Africa
9. Global Monochloroacetic Acid Market-Competitive Landscape
9.1. Overview
9.2. Market Share of Key Players in Global Monochloroacetic Acid Market
9.2.1. Global Company Market Share
9.2.2. North America Company Market Share
9.2.3. Europe Company Market Share
9.2.4. APAC Company Market Share
9.3. Competitive Situations and Trends
9.3.1. Product Launches and Developments
9.3.2. Partnerships, Collaborations, and Agreements
9.3.3. Mergers & Acquisitions
9.3.4. Expansions
10. Company Profiles
10.1. IOL Chemicals And Pharmaceuticals
10.1.1. Business Overview
10.1.2. Company Snapshot
10.1.3. Company Market Share Analysis
10.1.4. Company Product Portfolio
10.1.5. Recent Developments
10.1.6. SWOT Analysis
10.2. Shijiazhuang Banglong Chemical
10.2.1. Business Overview
10.2.2. Company Snapshot
10.2.3. Company Market Share Analysis
10.2.4. Company Product Portfolio
10.2.5. Recent Developments
10.2.6. SWOT Analysis
10.3. CABB
10.3.1. Business Overview
10.3.2. Company Snapshot
10.3.3. Company Market Share Analysis
10.3.4. Company Product Portfolio
10.3.5. Recent Developments
10.3.6. SWOT Analysis
10.4. Chongqing Seayo Chemical Industry
10.4.1. Business Overview
10.4.2. Company Snapshot
10.4.3. Company Market Share Analysis
10.4.4. Company Product Portfolio
10.4.5. Recent Developments
10.4.6. SWOT Analysis
10.5. Dow
10.5.1. Business Overview
10.5.2. Company Snapshot
10.5.3. Company Market Share Analysis
10.5.4. Company Product Portfolio
10.5.5. Recent Developments
10.5.6. SWOT Analysis
10.6. Shri Chlochem
10.6.1. Business Overview
10.6.2. Company Snapshot
10.6.3. Company Market Share Analysis
10.6.4. Company Product Portfolio
10.6.5. Recent Developments
10.6.6. SWOT Analysis
10.7. Luzhou Hepu Chemical
10.7.1. Business Overview
10.7.2. Company Snapshot
10.7.3. Company Market Share Analysis
10.7.4. Company Product Portfolio
10.7.5. Recent Developments
10.7.6. SWOT Analysis
10.8. Daicel
10.8.1. Business Overview
10.8.2. Company Snapshot
10.8.3. Company Market Share Analysis
10.8.4. Company Product Portfolio
10.8.5. Recent Developments
10.8.6. SWOT Analysis
10.9. Gold Power
10.9.1. Business Overview
10.9.2. Company Snapshot
10.9.3. Company Market Share Analysis
10.9.4. Company Product Portfolio
10.9.5. Recent Developments
10.9.6. SWOT Analysis
10.10. Yichang Jinxin Chemical
10.10.1. Business Overview
10.10.2. Company Snapshot
10.10.3. Company Market Share Analysis
10.10.4. Company Product Portfolio
10.10.5. Recent Developments
10.10.6. SWOT Analysis
10.11. Meridian
10.11.1. Business Overview
10.11.2. Company Snapshot
10.11.3. Company Market Share Analysis
10.11.4. Company Product Portfolio
10.11.5. Recent Developments
10.11.6. SWOT Analysis
10.12. China Pingmei Shenma Group
10.12.1. Business Overview
10.12.2. Company Snapshot
10.12.3. Company Market Share Analysis
10.12.4. Company Product Portfolio
10.12.5. Recent Developments
10.12.6. SWOT Analysis
10.13. PCC SE
10.13.1. Business Overview
10.13.2. Company Snapshot
10.13.3. Company Market Share Analysis
10.13.4. Company Product Portfolio
10.13.5. Recent Developments
10.13.6. SWOT Analysis
List of Table
1. Global Monochloroacetic Acid Market, By Product Form, 2019-2032 (USD Million)
2. Global Flakes, Monochloroacetic Acid Market, By Region, 2019-2032 (USD Million)
3. Global Crystalline, Monochloroacetic Acid Market, By Region, 2019-2032 (USD Million)
4. Global Liquid, Monochloroacetic Acid Market, By Region, 2019-2032 (USD Million)
5. Global Monochloroacetic Acid Market, By Application, 2019-2032 (USD Million)
6. Global Agrochemicals, Monochloroacetic Acid Market, By Region, 2019-2032 (USD Million)
7. Global Thioglycolic Acid, Monochloroacetic Acid Market, By Region, 2019-2032 (USD Million)
8. Global Carboxymethylcellulose, Monochloroacetic Acid Market, By Region, 2019-2032 (USD Million)
9. Global Surfactants, Monochloroacetic Acid Market, By Region, 2019-2032 (USD Million)
10. Global Others, Monochloroacetic Acid Market, By Region, 2019-2032 (USD Million)
11. North America Monochloroacetic Acid Market, By Product Form, 2019-2032 (USD Million)
12. North America Monochloroacetic Acid Market, By Application, 2019-2032 (USD Million)
13. U.S. Monochloroacetic Acid Market, By Product Form, 2019-2032 (USD Million)
14. U.S. Monochloroacetic Acid Market, By Application, 2019-2032 (USD Million)
15. Canada Monochloroacetic Acid Market, By Product Form, 2019-2032 (USD Million)
16. Canada Monochloroacetic Acid Market, By Application, 2019-2032 (USD Million)
17. Mexico Monochloroacetic Acid Market, By Product Form, 2019-2032 (USD Million)
18. Mexico Monochloroacetic Acid Market, By Application, 2019-2032 (USD Million)
19. Europe Monochloroacetic Acid Market, By Product Form, 2019-2032 (USD Million)
20. Europe Monochloroacetic Acid Market, By Application, 2019-2032 (USD Million)
21. Germany Monochloroacetic Acid Market, By Product Form, 2019-2032 (USD Million)
22. Germany Monochloroacetic Acid Market, By Application, 2019-2032 (USD Million)
23. France Monochloroacetic Acid Market, By Product Form, 2019-2032 (USD Million)
24. France Monochloroacetic Acid Market, By Application, 2019-2032 (USD Million)
25. U.K. Monochloroacetic Acid Market, By Product Form, 2019-2032 (USD Million)
26. U.K. Monochloroacetic Acid Market, By Application, 2019-2032 (USD Million)
27. Italy Monochloroacetic Acid Market, By Product Form, 2019-2032 (USD Million)
28. Italy Monochloroacetic Acid Market, By Application, 2019-2032 (USD Million)
29. Spain Monochloroacetic Acid Market, By Product Form, 2019-2032 (USD Million)
30. Spain Monochloroacetic Acid Market, By Application, 2019-2032 (USD Million)
31. Asia Pacific Monochloroacetic Acid Market, By Product Form, 2019-2032 (USD Million)
32. Asia Pacific Monochloroacetic Acid Market, By Application, 2019-2032 (USD Million)
33. Japan Monochloroacetic Acid Market, By Product Form, 2019-2032 (USD Million)
34. Japan Monochloroacetic Acid Market, By Application, 2019-2032 (USD Million)
35. China Monochloroacetic Acid Market, By Product Form, 2019-2032 (USD Million)
36. China Monochloroacetic Acid Market, By Application, 2019-2032 (USD Million)
37. India Monochloroacetic Acid Market, By Product Form, 2019-2032 (USD Million)
38. India Monochloroacetic Acid Market, By Application, 2019-2032 (USD Million)
39. South America Monochloroacetic Acid Market, By Product Form, 2019-2032 (USD Million)
40. South America Monochloroacetic Acid Market, By Application, 2019-2032 (USD Million)
41. Brazil Monochloroacetic Acid Market, By Product Form, 2019-2032 (USD Million)
42. Brazil Monochloroacetic Acid Market, By Application, 2019-2032 (USD Million)
43. Middle East and Africa Monochloroacetic Acid Market, By Product Form, 2019-2032 (USD Million)
44. Middle East and Africa Monochloroacetic Acid Market, By Application, 2019-2032 (USD Million)
45. UAE Monochloroacetic Acid Market, By Product Form, 2019-2032 (USD Million)
46. UAE Monochloroacetic Acid Market, By Application, 2019-2032 (USD Million)
47. South Africa Monochloroacetic Acid Market, By Product Form, 2019-2032 (USD Million)
48. South Africa Monochloroacetic Acid Market, By Application, 2019-2032 (USD Million)
List of Figures
1. Global Monochloroacetic Acid Market Segmentation
2. Global Monochloroacetic Acid Market: Research Methodology
3. Market Size Estimation Methodology: Bottom-Up Approach
4. Market Size Estimation Methodology: Top-Down Approach
5. Data Triangulation
6. Porter’s Five Forces Analysis
7. Value Chain Analysis
8. Global Monochloroacetic Acid Market Attractiveness Analysis by Product Form
9. Global Monochloroacetic Acid Market Attractiveness Analysis by Application
10. Global Monochloroacetic Acid Market Attractiveness Analysis by Region
11. Global Monochloroacetic Acid Market: Dynamics
12. Global Monochloroacetic Acid Market Share by Product Form (2023 & 2032)
13. Global Monochloroacetic Acid Market Share by Application (2023 & 2032)
14. Global Monochloroacetic Acid Market Share by Regions (2023 & 2032)
15. Global Monochloroacetic Acid Market Share by Company (2022)
This study forecasts global, regional, and country revenue from 2019 to 2032. The Brainy Insights has segmented the global monochloroacetic acid market based on the below-mentioned segments:
Global Monochloroacetic Acid Market By Product Form:
Global Monochloroacetic Acid Market By Application:
Global Monochloroacetic Acid Market By Region:
Research has its special purpose to undertake marketing efficiently. In this competitive scenario, businesses need information across all industry verticals; the information about customer wants, market demand, competition, industry trends, distribution channels etc. This information needs to be updated regularly because businesses operate in a dynamic environment. Our organization, The Brainy Insights incorporates scientific and systematic research procedures in order to get proper market insights and industry analysis for overall business success. The analysis consists of studying the market from a miniscule level wherein we implement statistical tools which helps us in examining the data with accuracy and precision.
Our research reports feature both; quantitative and qualitative aspects for any market. Qualitative information for any market research process are fundamental because they reveal the customer needs and wants, usage and consumption for any product/service related to a specific industry. This in turn aids the marketers/investors in knowing certain perceptions of the customers. Qualitative research can enlighten about the different product concepts and designs along with unique service offering that in turn, helps define marketing problems and generate opportunities. On the other hand, quantitative research engages with the data collection process through interviews, e-mail interactions, surveys and pilot studies. Quantitative aspects for the market research are useful to validate the hypotheses generated during qualitative research method, explore empirical patterns in the data with the help of statistical tools, and finally make the market estimations.
The Brainy Insights offers comprehensive research and analysis, based on a wide assortment of factual insights gained through interviews with CXOs and global experts and secondary data from reliable sources. Our analysts and industry specialist assume vital roles in building up statistical tools and analysis models, which are used to analyse the data and arrive at accurate insights with exceedingly informative research discoveries. The data provided by our organization have proven precious to a diverse range of companies, facilitating them to address issues such as determining which products/services are the most appealing, whether or not customers use the product in the manner anticipated, the purchasing intentions of the market and many others.
Our research methodology encompasses an idyllic combination of primary and secondary initiatives. Key phases involved in this process are listed below:

The phase involves the gathering and collecting of market data and its related information with the help of different sources & research procedures.

The data procurement stage involves in data gathering and collecting through various data sources.
This stage involves in extensive research. These data sources includes:
Purchased Database: Purchased databases play a crucial role in estimating the market sizes irrespective of the domain. Our purchased database includes:
Primary Research: The Brainy Insights interacts with leading companies and experts of the concerned domain to develop the analyst team’s market understanding and expertise. It improves and substantiates every single data presented in the market reports. Primary research mainly involves in telephonic interviews, E-mail interactions and face-to-face interviews with the raw material providers, manufacturers/producers, distributors, & independent consultants. The interviews that we conduct provides valuable data on market size and industry growth trends prevailing in the market. Our organization also conducts surveys with the various industry experts in order to gain overall insights of the industry/market. For instance, in healthcare industry we conduct surveys with the pharmacists, doctors, surgeons and nurses in order to gain insights and key information of a medical product/device/equipment which the customers are going to usage. Surveys are conducted in the form of questionnaire designed by our own analyst team. Surveys plays an important role in primary research because surveys helps us to identify the key target audiences of the market. Additionally, surveys helps to identify the key target audience engaged with the market. Our survey team conducts the survey by targeting the key audience, thus gaining insights from them. Based on the perspectives of the customers, this information is utilized to formulate market strategies. Moreover, market surveys helps us to understand the current competitive situation of the industry. To be precise, our survey process typically involve with the 360 analysis of the market. This analytical process begins by identifying the prospective customers for a product or service related to the market/industry to obtain data on how a product/service could fit into customers’ lives.

Secondary Research: The secondary data sources includes information published by the on-profit organizations such as World bank, WHO, company fillings, investor presentations, annual reports, national government documents, statistical databases, blogs, articles, white papers and others. From the annual report, we analyse a company’s revenue to understand the key segment and market share of that organization in a particular region. We analyse the company websites and adopt the product mapping technique which is important for deriving the segment revenue. In the product mapping method, we select and categorize the products offered by the companies catering to domain specific market, deduce the product revenue for each of the companies so as to get overall estimation of the market size. We also source data and analyses trends based on information received from supply side and demand side intermediaries in the value chain. The supply side denotes the data gathered from supplier, distributor, wholesaler and the demand side illustrates the data gathered from the end customers for respective market domain.

The supply side for a domain specific market is analysed by:
The demand side for the market is estimated through:
In-house Library: Apart from these third-party sources, we have our in-house library of qualitative and quantitative information. Our in-house database includes market data for various industry and domains. These data are updated on regular basis as per the changing market scenario. Our library includes, historic databases, internal audit reports and archives.
Sometimes there are instances where there is no metadata or raw data available for any domain specific market. For those cases, we use our expertise to forecast and estimate the market size in order to generate comprehensive data sets. Our analyst team adopt a robust research technique in order to produce the estimates:
Data Synthesis: This stage involves the analysis & mapping of all the information obtained from the previous step. It also involves in scrutinizing the data for any discrepancy observed while data gathering related to the market. The data is collected with consideration to the heterogeneity of sources. Robust scientific techniques are in place for synthesizing disparate data sets and provide the essential contextual information that can orient market strategies. The Brainy Insights has extensive experience in data synthesis where the data passes through various stages:


Market Deduction & Formulation: The final stage comprises of assigning data points at appropriate market spaces so as to deduce feasible conclusions. Analyst perspective & subject matter expert based holistic form of market sizing coupled with industry analysis also plays a crucial role in this stage.
This stage involves in finalization of the market size and numbers that we have collected from data integration step. With data interpolation, it is made sure that there is no gap in the market data. Successful trend analysis is done by our analysts using extrapolation techniques, which provide the best possible forecasts for the market.
Data Validation & Market Feedback: Validation is the most important step in the process. Validation & re-validation via an intricately designed process helps us finalize data-points to be used for final calculations.

The Brainy Insights interacts with leading companies and experts of the concerned domain to develop the analyst team’s market understanding and expertise. It improves and substantiates every single data presented in the market reports. The data validation interview and discussion panels are typically composed of the most experienced industry members. The participants include, however, are not limited to:
Moreover, we always validate our data and findings through primary respondents from all the major regions we are working on.


Free Customization
Fortune 500 Clients
Free Yearly Update On Purchase Of Multi/Corporate License
Companies Served Till Date