- +1-315-215-1633
- sales@thebrainyinsights.com

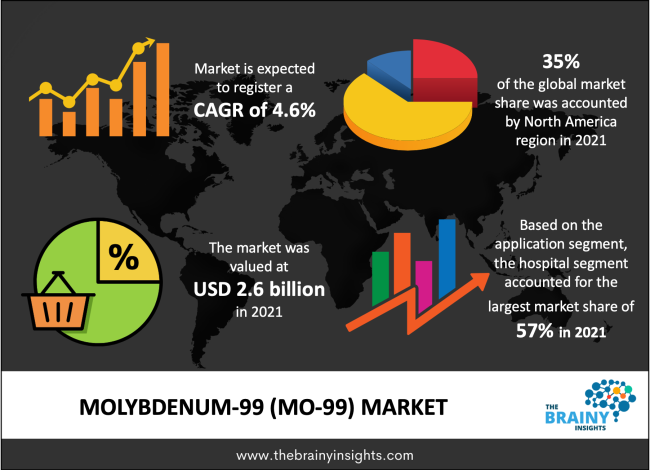
The Molybdenum-99 (Mo-99) market was estimated at around 2.6 billion in 2021, growing at a CAGR of nearly 4.6% during 2022-2030. The market is projected to reach approximately USD 6 billion by 2030.
Nuclear medicine, which has been used for more than three decades, has had a significant influence on medical diagnostic processes. Molybdenum-99 (99Mo) is one of the extensively used radioisotopes responsible for the bulk of nuclear diagnostic medicine operations. It is simple to use, portable, and reasonably affordable. Molybdenum-99 is now predicted to grow globally at a rate slightly below 5%. However, acquiring 99Mo has been more challenging recently. This is caused by a number of things, including the shutdown of several nuclear reactors and doubts about stable operating conditions. Nevertheless, the market participants will receive significant financial incentives because to rising investments in production infrastructure and new approvals of 99Mo and products generated from it.
Innovations are inevitable, but before they can reach their full market potential, any new procedures that have the potential to affect product quality relative to their existing equivalents must be licenced and proven.
Get an overview of this study by requesting a free sample
The most current COVID-19 epidemic started in Wuhan (China) in December 2019, and it has since quickly expanded throughout the world. In terms of confirmed cases and reported deaths as of March 2020, China, Italy, Iran, Spain, the Republic of Korea, France, Germany, and the US are among the nation’s most severely impacted. The healthcare industry was one of the most positively impacted sector during the COVID-19 pandemic. The Molybdenum-99 is usually used in the medicine in order to diagnose the heart disease and others related diseases. The increase in heart patients in the pandemic has increased rapidly due to the fear of the covid symptoms during the pandemic, which has in turn, positively impacted on the growth of the Molybdenum-99 products market.
Rising penetration of radio-therapeutics demand to accelerate the market’s growth
The primary driver of the global market is anticipated to be the increasing use of radio-therapeutics. With approximately 13% of the nuclear medicine market, radiotherapeutics is already being hailed as the future of medicine. The demand for efficient treatment and medical innovation is at an all-time high as a result of rising rates of prostate and bone malignancies. This is also the main driver of radio therapeutics investment, which is good news for the molybdenum-99 market. According to studies, prostate cancer is the second biggest reason for cancer-related fatalities in the US. Despite a dramatic drop in fatalities over the past few of years and improvements in screening and treatment, the disease has continued to claim valuable human lives.
Thus, the entry of radio-therapeutics into the cancer diagnostic market is regarded as a revolutionary step. Therefore, the introduction of molybdenum-99 for the treatment of prostate and bone cancer is seen as a crucial step in medicine.
Greater finds are anticipated in the upcoming years, particularly as top players continue to spend in developments. For instance, GE Healthcare launched revolutionary radio-therapeutics in response to the demand for effective tumour treatment.
There are two main application segments: SPECT and gamma cameras. Nuclear medicine is used by the gama camera, also known as the scintillation camera, to provide accurate assessments of critical human organs such the thyroid, heart, and lungs. It operates on the gamma rays that radio emits when it is put into the human body. In contrast, SPECT is an overly sensitive method for identifying parathyroid adenomas in people. In the upcoming years, demand seen in all sectors will contribute equally to market expansion. However, SPECT currently hold most of the market share. The market can be divided into hospitals and diagnostic centers based on the end user.
Most of the global market share of these is held by hospitals. Throughout the predicted period, the trend is likely to hold steady. Hospitals will continue to dominate, particularly considering the increased healthcare spending seen globally. It is also true that medical and technical advancements will increase the demand felt by diagnostic centers and hospitals alike. Affordable healthcare is a priority for new governments. For the market participants, this decision has been of the utmost importance. Demand from both end-use groups is anticipated to increase in the coming years because to the focus on lowering the cost of cancer treatment.
Molybdenum-99 is known to have a significant market in North America. In response to the rising prevalence of chronic non-communicable diseases, the region has seen increasing consumption of 99Mo. High demand in the U.S. and advantageous healthcare reimbursement policies in that nation support the region's growth. In North America, governments frequently provide assistance through managed care programmes and all-inclusive healthcare support. This has increased the demand for 99Mo, which is very strong in North America. Additionally, it is anticipated that the distribution of government healthcare money will open up realistic chances for healthcare research and development. These regulations have helped to foster an atmosphere that is conducive to the market's expansion in North America.
Additionally helpful has been the existence of an advanced healthcare network that includes hospitals and diagnostic facilities with cutting-edge infrastructure. The majority of demand seen in the North American market will mostly come from the United States.
The global Molybdenum-99 (Mo-99) market is segmented as follows:
By Type
By Application
By Region/Geography
| Attribute | Description |
|---|---|
| Base Year | 2021 |
| Forecast period | 2022-2030 |
| Report Coverage | Revenue estimation and forecast, company profile, competitive landscape, growth factors, and recent trends |
| Regional scope | North America, Europe, Asia Pacific, Middle East & Africa, and Latin America |
| Market Size(unit) | USD Billion |
| CAGR (2022 to 2030) | 4.6% |
| Segments Covered |
By Type |
1. Introduction
1.1. Objectives of the Study
1.2. Market Definition
1.3. Research Scope
2. Research Methodology and Assumptions
3. Executive Summary
4. Premium Insights
4.1. Porter’s Five Forces Analysis
4.2. Value Chain Analysis
4.3. Top Investment Pockets
4.3.1. Market Attractiveness Analysis By Origin
4.3.2. Market Attractiveness Analysis By Application
4.4. Industry Trends
5. Market Dynamics
5.1. Market Evaluation
5.2. Drivers
5.2.1. Increasing population to accelerate the market’s growth
5.2.2. Better yield than conventional ones
5.3. Restrains
5.3.1. Availability of substitute materials would hamper the market
5.4. Opportunities
5.4.1. Increasing Urbanization
6. Global Moringa Ingredients Market Analysis and Forecast, By Origin
6.1. Segment Overview
6.2. Organic
6.3. Conventional
7. Global Moringa Ingredients Market Analysis and Forecast, By Application
7.1. Segment Overview
7.2. Food & Beverages
7.3. Pharmaceuticals
7.4. Others
8. Global Moringa Ingredients Market Analysis and Forecast, By Regional Analysis
8.1. Segment Overview
8.2. North America
8.2.1. U.S.
8.2.2. Canada
8.2.3. Mexico
8.3. Europe
8.3.1. Germany
8.3.2. France
8.3.3. U.K.
8.3.4. Italy
8.3.5. Spain
8.3.6. Rest of Europe
8.4. Asia-Pacific
8.4.1. Japan
8.4.2. China
8.4.3. India
8.4.4. Australia
8.4.5. South Korea
8.4.6. Rest of Asia-Pacific
8.5. South America
8.5.1. Brazil
8.5.2. Argentina
8.5.3. Rest of South America
8.6. Middle East and Africa
8.6.1. UAE
8.6.2. South Africa
8.6.3. Egypt
8.6.4. Kuwait
8.6.5. Saudi Arabia
8.6.6. Rest of Middle East & Africa
9. Global Moringa Ingredients Market-Competitive Landscape
9.1. Overview
9.2. Market Share of Key Players in the Moringa Ingredients market
9.2.1. Global Company Market Share
9.2.2. North America Company Market Share
9.2.3. Europe Company Market Share
9.2.4. APAC Company Market Share
9.3. Competitive Situations and Trends
9.3.1. Origin Launches and Developments
9.3.2. Partnerships, Collaborations, and Agreements
9.3.3. Mergers & Acquisitions
9.3.4. Expansions
10. Company Profiles
10.1. Organic India Pvt Ltd
10.1.1. Business Overview
10.1.2. Company Snapshot
10.1.3. Company Market Share Analysis
10.1.4. Company Application Portfolio
10.1.5. Recent Developments
10.1.6. SWOT Analysis
10.2. Earth Expo Company
10.2.1. Business Overview
10.2.2. Company Snapshot
10.2.3. Company Market Share Analysis
10.2.4. Company Application Portfolio
10.2.5. Recent Developments
10.2.6. SWOT Analysis
10.3. Kulikuli Inc.
10.3.1. Business Overview
10.3.2. Company Snapshot
10.3.3. Company Market Share Analysis
10.3.4. Company Application Portfolio
10.3.5. Recent Developments
10.3.6. SWOT Analysis
10.4. Grenera Nutrients Pvt
10.4.1. Business Overview
10.4.2. Company Snapshot
10.4.3. Company Market Share Analysis
10.4.4. Company Application Portfolio
10.4.5. Recent Developments
10.4.6. SWOT Analysis
10.5. Botanica Natural Products
10.5.1. Business Overview
10.5.2. Company Snapshot
10.5.3. Company Market Share Analysis
10.5.4. Company Application Portfolio
10.5.5. Recent Developments
10.5.6. SWOT Analysis
10.6. Aayuritz Phytonutrients Pvt Ltd.
10.6.1. Business Overview
10.6.2. Company Snapshot
10.6.3. Company Market Share Analysis
10.6.4. Company Application Portfolio
10.6.5. Recent Developments
10.6.6. SWOT Analysis
10.7. Herbs & Crops Overseas
10.7.1. Business Overview
10.7.2. Company Snapshot
10.7.3. Company Market Share Analysis
10.7.4. Company Application Portfolio
10.7.5. Recent Developments
10.7.6. SWOT Analysis
10.8. Dominate Industries
10.8.1. Business Overview
10.8.2. Company Snapshot
10.8.3. Company Market Share Analysis
10.8.4. Company Application Portfolio
10.8.5. Recent Developments
10.8.6. SWOT Analysis
10.9. Moringa Initiative Ltd.
10.9.1. Business Overview
10.9.2. Company Snapshot
10.9.3. Company Market Share Analysis
10.9.4. Company Application Portfolio
10.9.5. Recent Developments
10.9.6. SWOT Analysis
10.10. Green Virgin Products LLC
10.10.1. Business Overview
10.10.2. Company Snapshot
10.10.3. Company Market Share Analysis
10.10.4. Company Application Portfolio
10.10.5. Recent Developments
10.10.6. SWOT Analysis
List of Table
1. Global Moringa Ingredients Market, By Origin, 2022-2030(USD Billion)
2. Global Organic Moringa Ingredients Market, By Region, 2022-2030(USD Billion)
3. Global Conventional Moringa Ingredients Market, By Region, 2022-2030(USD Billion)
4. Global Moringa Ingredients Market, By Application, 2022-2030(USD Billion)
5. Global Food & Beverages Moringa Ingredients Market, By Region, 2022-2030(USD Billion)
6. Global Pharmaceuticals Moringa Ingredients Market, By Region, 2022-2030(USD Billion)
7. Global Others Moringa Ingredients Market, By Region, 2022-2030(USD Billion)
8. Global Moringa Ingredients Market, By Region, 2022-2030(USD Billion)
9. Global Moringa Ingredients Market, By North America, 2022-2030(USD Billion)
10. North America Moringa Ingredients Market, By Origin, 2022-2030(USD Billion)
11. North America Moringa Ingredients Market, By Application, 2022-2030(USD Billion)
12. U.S. Moringa Ingredients Market, By Origin, 2022-2030(USD Billion)
13. U.S. Moringa Ingredients Market, By Application, 2022-2030(USD Billion)
14. Canada Moringa Ingredients Market, By Origin, 2022-2030(USD Billion)
15. Canada Moringa Ingredients Market, By Application, 2022-2030(USD Billion)
16. Mexico Moringa Ingredients Market, By Origin, 2022-2030(USD Billion)
17. Mexico Moringa Ingredients Market, By Application, 2022-2030(USD Billion)
18. Europe Moringa Ingredients Market, By Origin, 2022-2030(USD Billion)
19. Europe Moringa Ingredients Market, By Application, 2022-2030(USD Billion)
20. Germany Moringa Ingredients Market, By Origin, 2022-2030(USD Billion)
21. Germany Moringa Ingredients Market, By Application, 2022-2030(USD Billion)
22. France Moringa Ingredients Market, By Origin, 2022-2030(USD Billion)
23. France Moringa Ingredients Market, By Application, 2022-2030(USD Billion)
24. U.K. Moringa Ingredients Market, By Origin, 2022-2030(USD Billion)
25. U.K. Moringa Ingredients Market, By Application, 2022-2030(USD Billion)
26. Italy Moringa Ingredients Market, By Origin, 2022-2030(USD Billion)
27. Italy Moringa Ingredients Market, By Application, 2022-2030(USD Billion)
28. Spain Moringa Ingredients Market, By Origin, 2022-2030(USD Billion)
29. Spain Moringa Ingredients Market, By Application, 2022-2030(USD Billion)
30. Rest of Europe Moringa Ingredients Market, By Origin, 2022-2030(USD Billion)
31. Rest of Europe Moringa Ingredients Market, By Application, 2022-2030(USD Billion)
32. Asia Pacific Moringa Ingredients Market, By Origin, 2022-2030(USD Billion)
33. Asia Pacific Moringa Ingredients Market, By Application, 2022-2030(USD Billion)
34. Japan Moringa Ingredients Market, By Origin, 2022-2030(USD Billion)
35. Japan Moringa Ingredients Market, By Application, 2022-2030(USD Billion)
36. China Moringa Ingredients Market, By Origin, 2022-2030(USD Billion)
37. China Moringa Ingredients Market, By Application, 2022-2030(USD Billion)
38. India Moringa Ingredients Market, By Origin, 2022-2030(USD Billion)
39. India Moringa Ingredients Market, By Application, 2022-2030(USD Billion)
40. Australia Moringa Ingredients Market, By Origin, 2022-2030(USD Billion)
41. Australia Moringa Ingredients Market, By Application, 2022-2030(USD Billion)
42. South Korea Moringa Ingredients Market, By Origin, 2022-2030(USD Billion)
43. South Korea Moringa Ingredients Market, By Application, 2022-2030(USD Billion)
44. Rest of Asia-Pacific Moringa Ingredients Market, By Origin, 2022-2030(USD Billion)
45. Rest of Asia-Pacific Moringa Ingredients Market, By Application, 2022-2030(USD Billion)
46. South America Moringa Ingredients Market, By Origin, 2022-2030(USD Billion)
47. South America Moringa Ingredients Market, By Application, 2022-2030(USD Billion)
48. Brazil Moringa Ingredients Market, By Origin, 2022-2030(USD Billion)
49. Brazil Moringa Ingredients Market, By Application, 2022-2030(USD Billion)
50. Argentina Moringa Ingredients Market, By Origin, 2022-2030(USD Billion)
51. Argentina Moringa Ingredients Market, By Application, 2022-2030(USD Billion)
52. Rest of Latin America Moringa Ingredients Market, By Origin, 2022-2030(USD Billion)
53. Rest of Latin America Moringa Ingredients Market, By Application, 2022-2030(USD Billion)
54. Middle East and Africa Moringa Ingredients Market, By Origin, 2022-2030(USD Billion)
55. Middle East and Africa Moringa Ingredients Market, By Application, 2022-2030(USD Billion)
56. UAE Moringa Ingredients Market, By Origin, 2022-2030(USD Billion)
57. UAE Moringa Ingredients Market, By Application, 2022-2030(USD Billion)
58. South Africa Moringa Ingredients Market, By Origin, 2022-2030(USD Billion)
59. South Africa Moringa Ingredients Market, By Application, 2022-2030(USD Billion)
60. Egypt Moringa Ingredients Market, By Origin, 2022-2030(USD Billion)
61. Egypt Moringa Ingredients Market, By Application, 2022-2030(USD Billion)
62. Kuwait Moringa Ingredients Market, By Origin, 2022-2030(USD Billion)
63. Kuwait Moringa Ingredients Market, By Application, 2022-2030(USD Billion)
64. Saudi Arabia Moringa Ingredients Market, By Origin, 2022-2030(USD Billion)
65. Saudi Arabia Moringa Ingredients Market, By Application, 2022-2030(USD Billion)
66. Rest of Middle East Moringa Ingredients Market, By Origin, 2022-2030(USD Billion)
67. Rest of Middle East Moringa Ingredients Market, By Application, 2022-2030(USD Billion)
List of Figures
1. Global Moringa Ingredients Market Segmentation
2. Moringa Ingredients Market: Research Methodology
3. Market Size Estimation Methodology: Bottom-Up Approach
4. Market Size Estimation Methodology: Top-Down Approach
5. Data Triangulation
6. Porter’s Five Forces Analysis
7. Value Chain Analysis
8. Global Moringa Ingredients Market Attractiveness Analysis By Origin
9. Global Moringa Ingredients Market Attractiveness Analysis By Application
10. Global Moringa Ingredients Market Attractiveness Analysis By Region
11. Global Moringa Ingredients Market: Dynamics
12. Global Moringa Ingredients Market Share By Origin(2022 & 2030)
13. Global Moringa Ingredients Market Share By Application(2022 & 2030)
14. Global Moringa Ingredients Market Share by Regions (2022 & 2030)
15. Global Moringa Ingredients Market Share by Company (2021)
By Type
By Application
By Region/Geography
Research has its special purpose to undertake marketing efficiently. In this competitive scenario, businesses need information across all industry verticals; the information about customer wants, market demand, competition, industry trends, distribution channels etc. This information needs to be updated regularly because businesses operate in a dynamic environment. Our organization, The Brainy Insights incorporates scientific and systematic research procedures in order to get proper market insights and industry analysis for overall business success. The analysis consists of studying the market from a miniscule level wherein we implement statistical tools which helps us in examining the data with accuracy and precision.
Our research reports feature both; quantitative and qualitative aspects for any market. Qualitative information for any market research process are fundamental because they reveal the customer needs and wants, usage and consumption for any product/service related to a specific industry. This in turn aids the marketers/investors in knowing certain perceptions of the customers. Qualitative research can enlighten about the different product concepts and designs along with unique service offering that in turn, helps define marketing problems and generate opportunities. On the other hand, quantitative research engages with the data collection process through interviews, e-mail interactions, surveys and pilot studies. Quantitative aspects for the market research are useful to validate the hypotheses generated during qualitative research method, explore empirical patterns in the data with the help of statistical tools, and finally make the market estimations.
The Brainy Insights offers comprehensive research and analysis, based on a wide assortment of factual insights gained through interviews with CXOs and global experts and secondary data from reliable sources. Our analysts and industry specialist assume vital roles in building up statistical tools and analysis models, which are used to analyse the data and arrive at accurate insights with exceedingly informative research discoveries. The data provided by our organization have proven precious to a diverse range of companies, facilitating them to address issues such as determining which products/services are the most appealing, whether or not customers use the product in the manner anticipated, the purchasing intentions of the market and many others.
Our research methodology encompasses an idyllic combination of primary and secondary initiatives. Key phases involved in this process are listed below:

The phase involves the gathering and collecting of market data and its related information with the help of different sources & research procedures.

The data procurement stage involves in data gathering and collecting through various data sources.
This stage involves in extensive research. These data sources includes:
Purchased Database: Purchased databases play a crucial role in estimating the market sizes irrespective of the domain. Our purchased database includes:
Primary Research: The Brainy Insights interacts with leading companies and experts of the concerned domain to develop the analyst team’s market understanding and expertise. It improves and substantiates every single data presented in the market reports. Primary research mainly involves in telephonic interviews, E-mail interactions and face-to-face interviews with the raw material providers, manufacturers/producers, distributors, & independent consultants. The interviews that we conduct provides valuable data on market size and industry growth trends prevailing in the market. Our organization also conducts surveys with the various industry experts in order to gain overall insights of the industry/market. For instance, in healthcare industry we conduct surveys with the pharmacists, doctors, surgeons and nurses in order to gain insights and key information of a medical product/device/equipment which the customers are going to usage. Surveys are conducted in the form of questionnaire designed by our own analyst team. Surveys plays an important role in primary research because surveys helps us to identify the key target audiences of the market. Additionally, surveys helps to identify the key target audience engaged with the market. Our survey team conducts the survey by targeting the key audience, thus gaining insights from them. Based on the perspectives of the customers, this information is utilized to formulate market strategies. Moreover, market surveys helps us to understand the current competitive situation of the industry. To be precise, our survey process typically involve with the 360 analysis of the market. This analytical process begins by identifying the prospective customers for a product or service related to the market/industry to obtain data on how a product/service could fit into customers’ lives.

Secondary Research: The secondary data sources includes information published by the on-profit organizations such as World bank, WHO, company fillings, investor presentations, annual reports, national government documents, statistical databases, blogs, articles, white papers and others. From the annual report, we analyse a company’s revenue to understand the key segment and market share of that organization in a particular region. We analyse the company websites and adopt the product mapping technique which is important for deriving the segment revenue. In the product mapping method, we select and categorize the products offered by the companies catering to domain specific market, deduce the product revenue for each of the companies so as to get overall estimation of the market size. We also source data and analyses trends based on information received from supply side and demand side intermediaries in the value chain. The supply side denotes the data gathered from supplier, distributor, wholesaler and the demand side illustrates the data gathered from the end customers for respective market domain.

The supply side for a domain specific market is analysed by:
The demand side for the market is estimated through:
In-house Library: Apart from these third-party sources, we have our in-house library of qualitative and quantitative information. Our in-house database includes market data for various industry and domains. These data are updated on regular basis as per the changing market scenario. Our library includes, historic databases, internal audit reports and archives.
Sometimes there are instances where there is no metadata or raw data available for any domain specific market. For those cases, we use our expertise to forecast and estimate the market size in order to generate comprehensive data sets. Our analyst team adopt a robust research technique in order to produce the estimates:
Data Synthesis: This stage involves the analysis & mapping of all the information obtained from the previous step. It also involves in scrutinizing the data for any discrepancy observed while data gathering related to the market. The data is collected with consideration to the heterogeneity of sources. Robust scientific techniques are in place for synthesizing disparate data sets and provide the essential contextual information that can orient market strategies. The Brainy Insights has extensive experience in data synthesis where the data passes through various stages:


Market Deduction & Formulation: The final stage comprises of assigning data points at appropriate market spaces so as to deduce feasible conclusions. Analyst perspective & subject matter expert based holistic form of market sizing coupled with industry analysis also plays a crucial role in this stage.
This stage involves in finalization of the market size and numbers that we have collected from data integration step. With data interpolation, it is made sure that there is no gap in the market data. Successful trend analysis is done by our analysts using extrapolation techniques, which provide the best possible forecasts for the market.
Data Validation & Market Feedback: Validation is the most important step in the process. Validation & re-validation via an intricately designed process helps us finalize data-points to be used for final calculations.

The Brainy Insights interacts with leading companies and experts of the concerned domain to develop the analyst team’s market understanding and expertise. It improves and substantiates every single data presented in the market reports. The data validation interview and discussion panels are typically composed of the most experienced industry members. The participants include, however, are not limited to:
Moreover, we always validate our data and findings through primary respondents from all the major regions we are working on.


Free Customization
Fortune 500 Clients
Free Yearly Update On Purchase Of Multi/Corporate License
Companies Served Till Date