- +1-315-215-1633
- sales@thebrainyinsights.com

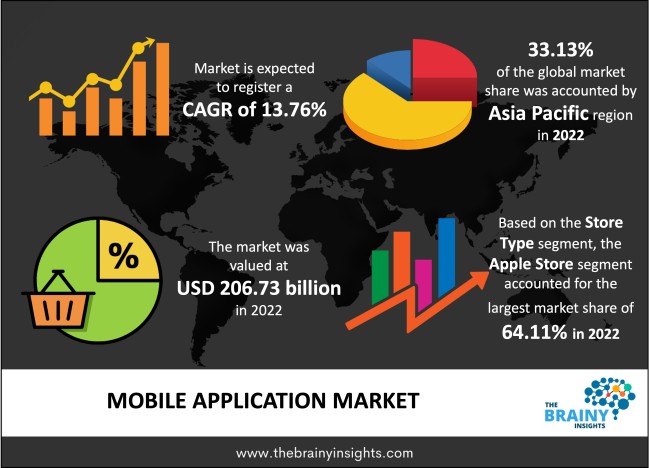
The global Mobile Application market was valued at USD 206.73 Billion in 2022 and growing at a CAGR of 13.76% from 2023 to 2032. The market is expected to reach USD 750.41 Billion by 2032. This market growth is attributed to the growing mobile developer population. It has led to an increase in the number of apps in the market. The mobile app industry is big and is growing significantly. Also, the mobile app industries are generating good revenue, and it is further skyrocketing. The trend suggests that the hybrid monetization model, like the in-app purchases and in-app ads, is becoming popular globally.
Mobile applications are broadly used in smartphones, and this market is the fastest-growing sector in the mobile industry. The popularity of mobile apps is growing, and several OS providers and device vendors are launching their application stores. Mobile is overpowering the position of the desktop. Based on one of the articles of 2022, the surge in the number of digital users has led mobile apps to capture around 65% of the digital media time. It is eventually driving the mobile application market. Based on another study of 2018, the number of users in 2018 was 4.021 billion globally, which was a 7% increase compared to the previous year. Similarly, the number of social media users in 2018 was 3.196 billion globally, which was an increase of 13% in comparison to the previous year. Similarly, mobile phone users were 5.135 billion globally in 2018, which is a 4% increase compared to 2017. Also, another source suggests that global smartphone users downloaded around 60% more apps in 2017 compared to 2015, which means around two apps were downloaded monthly by one human being on Earth. These sources easily suggest that mobile application apps are growing quickly. The growing adoption of digital-first business mobility solutions is driving tech leaders to bring advancement in mobile technologies. Presently, people prefer to use mobile devices in comparison to traditional systems, and hence, businesses are transitioning to mobile-first software solutions. Based on another article, the number of smartphone users was 3.6 Billion in 2016 and recently, in 2022, it became around 6.6 billion smartphone subscriptions, and it was estimated that it would reach around 7.7 Billion subscriptions by 2027. Also, mobile app downloads increased by 11% in 2022 compared to 2021, which shows that people's interest in mobile apps is growing fast. All these factors are eventually driving the mobile application market.
Get an overview of this study by requesting a free sample
Growing demand for apps– The mobile app market is growing, and consumer spending on the apps is also growing. It has been observed that the user consumes media around 7.5 hours a day on average, including video streaming. In 2021, video streaming and social video apps were in high demand. Augmented and virtual reality will also be the trend in the future. Hence, new AV and AR apps will reach the market. The trend suggests that AI is enhancing the experience of mobile users for apps and making the smartphone smarter. The Internet of Things (IoT) is also improving with the advancement in technology, and people are using apps on their phones to switch on or off some appliances, the function of security cams in their homes, etc. IoT is also being used in transportation, healthcare, security, e-commerce, etc., and hence, there is a need for quality apps in these fields. All these factors are driving the Mobile Application market.
Low internet accessibility – Based on one of the studies, at the time of the pandemic, a decent internet connection was difficult for around 90% of the people in low and middle-income countries. Less than half of the population in low and middle-income countries had access to basic internet connectivity, which was insufficient to access essential education, health and employment services. The low internet accessibility reduces productivity in merging and developing countries. All these factors eventually act as restraints for the mobile application market, as slow loading and downloading times lead to app abandonment.
Increasing time spent on mobile Apps – It has been observed that with increasing years, the time spent on mobile applications by users is increasing. The average time spent on the mobile was more than 5 hours in 2022 for the mobile-first market, which was 9% more than the pandemic time of 2020. It suggests that the mobile apps sector is growing significantly, and there is no sign of a decrease in the growth rate. The countries with the highest average time spent on mobile devices in a day per user are Brazil, Indonesia, Singapore, Saudi Arabia, South Korea, and Mexico. TikTok, Facebook and Instagram were the most downloaded apps in 2022, which shows the demand for social media apps. Some apps with the highest consumer spending are YouTube, TikTok, and Tinder. Based on another article, the leading mobile app market based on downloads was China, with more than 110 billion downloads in 2022, which was half of the total downloads globally. India and the US, with 28 billion and 12 billion downloads, respectively, were second and third. All these factors will eventually drive the mobile application market in the forecasting period.
The regions analyzed for the market include North America, Europe, South America, Asia Pacific, the Middle East, and Africa. Asia Pacific emerged as the largest market for the global Mobile Application market, with a 33.13% share of the market revenue in 2022. This lion's share is attributed to the growing use of mobile apps in the Asia Pacific. There is a surge in the penetration of smartphones and accessibility of the Internet. The leading mobile app market download-wise was China, with more than 110 billion downloads in 2022, and the second is India, with around 28 billion downloads. This factor is due to the growing middle-class population, which drives the use of mobile apps in the region. The mobile app use is growing with more focus on applications like e-commerce, gaming and social media. All these factors are driving the Mobile Application market in the region.
Asia Pacific Region Mobile Application Market Share in 2022 - 33.13%
www.thebrainyinsights.com
Check the geographical analysis of this market by requesting a free sample
The store type segment is divided into google store, apple store and others. The apple store segment dominated the market, with a market share of around 64.11% in 2022. This high market share is attributed to a higher monetisation rate by the iOS apps for the revenue created by premium apps and in-app purchases. Also, the number of users of Apple smartphones is increasing globally, contributing to the segment growth.
The application segment is divided into gaming, music & entertainment, social networking, health & fitness, retail & e-commerce and others. The gaming segment dominated the market, with a market share of around 45.22% in 2022. This market share is attributed to the surge in the gaming population, which eventually increased the download and use of mobile gaming applications, especially in emerging economies like India and China. Based on one of the studies in 2021, the mobile gaming application user base increased by 3 billion new players, with more than half of them from the Asia Pacific region.
| Attribute | Description |
|---|---|
| Market Size | Revenue (USD Billion) |
| Market size value in 2022 | USD 206.73 Billion |
| Market size value in 2032 | USD 750.41 Billion |
| CAGR (2023 to 2032) | 13.76% |
| Historical data | 2019-2021 |
| Base Year | 2022 |
| Forecast | 2023-2032 |
| Region | The regions analyzed for the market are Asia Pacific, Europe, South America, North America, and Middle East & Africa. Furthermore, the regions are further analyzed at the country level |
| Segments | Store Type and Application |
Asia Pacific region emerged as the largest market for the Mobile Application.
The market's growth will be influenced by growing demand for apps.
Low internet accessibility could hamper the market growth.
Increasing time spent on mobile Apps will provide huge opportunities to the market.
Key players are Practo, Gameloft SE, Microsoft Corporation, Google LLC, Amazon Inc., Xiaomi Corp., Netflix Inc., Cure.fit, Apple Inc. and Ubisoft Entertainment among others.
This study forecasts revenue at global, regional, and country levels from 2019 to 2032. The Brainy Insights has segmented the global Mobile Application market based on below mentioned segments:
Global Mobile Application Market by Store Type:
Global Mobile Application Market by Application:
Global Mobile Application by Region:
Research has its special purpose to undertake marketing efficiently. In this competitive scenario, businesses need information across all industry verticals; the information about customer wants, market demand, competition, industry trends, distribution channels etc. This information needs to be updated regularly because businesses operate in a dynamic environment. Our organization, The Brainy Insights incorporates scientific and systematic research procedures in order to get proper market insights and industry analysis for overall business success. The analysis consists of studying the market from a miniscule level wherein we implement statistical tools which helps us in examining the data with accuracy and precision.
Our research reports feature both; quantitative and qualitative aspects for any market. Qualitative information for any market research process are fundamental because they reveal the customer needs and wants, usage and consumption for any product/service related to a specific industry. This in turn aids the marketers/investors in knowing certain perceptions of the customers. Qualitative research can enlighten about the different product concepts and designs along with unique service offering that in turn, helps define marketing problems and generate opportunities. On the other hand, quantitative research engages with the data collection process through interviews, e-mail interactions, surveys and pilot studies. Quantitative aspects for the market research are useful to validate the hypotheses generated during qualitative research method, explore empirical patterns in the data with the help of statistical tools, and finally make the market estimations.
The Brainy Insights offers comprehensive research and analysis, based on a wide assortment of factual insights gained through interviews with CXOs and global experts and secondary data from reliable sources. Our analysts and industry specialist assume vital roles in building up statistical tools and analysis models, which are used to analyse the data and arrive at accurate insights with exceedingly informative research discoveries. The data provided by our organization have proven precious to a diverse range of companies, facilitating them to address issues such as determining which products/services are the most appealing, whether or not customers use the product in the manner anticipated, the purchasing intentions of the market and many others.
Our research methodology encompasses an idyllic combination of primary and secondary initiatives. Key phases involved in this process are listed below:

The phase involves the gathering and collecting of market data and its related information with the help of different sources & research procedures.

The data procurement stage involves in data gathering and collecting through various data sources.
This stage involves in extensive research. These data sources includes:
Purchased Database: Purchased databases play a crucial role in estimating the market sizes irrespective of the domain. Our purchased database includes:
Primary Research: The Brainy Insights interacts with leading companies and experts of the concerned domain to develop the analyst team’s market understanding and expertise. It improves and substantiates every single data presented in the market reports. Primary research mainly involves in telephonic interviews, E-mail interactions and face-to-face interviews with the raw material providers, manufacturers/producers, distributors, & independent consultants. The interviews that we conduct provides valuable data on market size and industry growth trends prevailing in the market. Our organization also conducts surveys with the various industry experts in order to gain overall insights of the industry/market. For instance, in healthcare industry we conduct surveys with the pharmacists, doctors, surgeons and nurses in order to gain insights and key information of a medical product/device/equipment which the customers are going to usage. Surveys are conducted in the form of questionnaire designed by our own analyst team. Surveys plays an important role in primary research because surveys helps us to identify the key target audiences of the market. Additionally, surveys helps to identify the key target audience engaged with the market. Our survey team conducts the survey by targeting the key audience, thus gaining insights from them. Based on the perspectives of the customers, this information is utilized to formulate market strategies. Moreover, market surveys helps us to understand the current competitive situation of the industry. To be precise, our survey process typically involve with the 360 analysis of the market. This analytical process begins by identifying the prospective customers for a product or service related to the market/industry to obtain data on how a product/service could fit into customers’ lives.

Secondary Research: The secondary data sources includes information published by the on-profit organizations such as World bank, WHO, company fillings, investor presentations, annual reports, national government documents, statistical databases, blogs, articles, white papers and others. From the annual report, we analyse a company’s revenue to understand the key segment and market share of that organization in a particular region. We analyse the company websites and adopt the product mapping technique which is important for deriving the segment revenue. In the product mapping method, we select and categorize the products offered by the companies catering to domain specific market, deduce the product revenue for each of the companies so as to get overall estimation of the market size. We also source data and analyses trends based on information received from supply side and demand side intermediaries in the value chain. The supply side denotes the data gathered from supplier, distributor, wholesaler and the demand side illustrates the data gathered from the end customers for respective market domain.

The supply side for a domain specific market is analysed by:
The demand side for the market is estimated through:
In-house Library: Apart from these third-party sources, we have our in-house library of qualitative and quantitative information. Our in-house database includes market data for various industry and domains. These data are updated on regular basis as per the changing market scenario. Our library includes, historic databases, internal audit reports and archives.
Sometimes there are instances where there is no metadata or raw data available for any domain specific market. For those cases, we use our expertise to forecast and estimate the market size in order to generate comprehensive data sets. Our analyst team adopt a robust research technique in order to produce the estimates:
Data Synthesis: This stage involves the analysis & mapping of all the information obtained from the previous step. It also involves in scrutinizing the data for any discrepancy observed while data gathering related to the market. The data is collected with consideration to the heterogeneity of sources. Robust scientific techniques are in place for synthesizing disparate data sets and provide the essential contextual information that can orient market strategies. The Brainy Insights has extensive experience in data synthesis where the data passes through various stages:


Market Deduction & Formulation: The final stage comprises of assigning data points at appropriate market spaces so as to deduce feasible conclusions. Analyst perspective & subject matter expert based holistic form of market sizing coupled with industry analysis also plays a crucial role in this stage.
This stage involves in finalization of the market size and numbers that we have collected from data integration step. With data interpolation, it is made sure that there is no gap in the market data. Successful trend analysis is done by our analysts using extrapolation techniques, which provide the best possible forecasts for the market.
Data Validation & Market Feedback: Validation is the most important step in the process. Validation & re-validation via an intricately designed process helps us finalize data-points to be used for final calculations.

The Brainy Insights interacts with leading companies and experts of the concerned domain to develop the analyst team’s market understanding and expertise. It improves and substantiates every single data presented in the market reports. The data validation interview and discussion panels are typically composed of the most experienced industry members. The participants include, however, are not limited to:
Moreover, we always validate our data and findings through primary respondents from all the major regions we are working on.


Free Customization
Fortune 500 Clients
Free Yearly Update On Purchase Of Multi/Corporate License
Companies Served Till Date