- +1-315-215-1633
- sales@thebrainyinsights.com

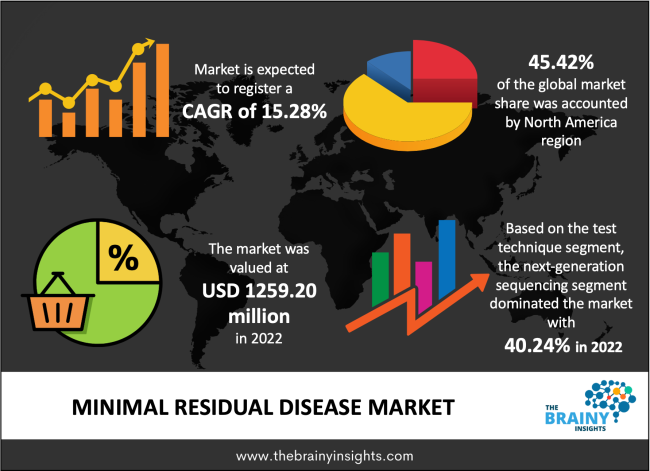
The global minimal residual disease market was valued at USD 1259.20 million in 2022, increasing at a CAGR of 15.28% from 2022 to 2030 and anticipated to reach USD 3927.60 million by 2030. The Asia Pacific is expected to grow the fastest during the forecast period. The increase in the number of patients with cancer is expected to drive market growth during the forecast period.
The most widely used tests to measure minimal residual disease are polymerase chain reaction (PCR), flow cytometry, and next-generation sequencing (NGS). These tests utilize samples of bone marrow cells (taken through aspiration) & peripheral blood cells (taken via a vein). Minimal residual disease testing is used in mantle cells, follicular, and diffuse large B-cell lymphoma (DLBCL). Doctors use MRD to measure treatment efficacy & forecast which patients are at risk of relapse. It can also assist doctors in confirming and monitoring remissions and possibly identifying an early cancer return.
Minimal residual disease (MRD) refers to the small number of cancer cells that remain in the body after treatment. The minimal residual disease can be found only by susceptible laboratory methods that can find one cancer cell among one million normal cells. Minimal residual disease testing is used mainly for blood cancers such as leukemia and lymphoma. Also called minimal residual disease and measurable residual disease. A minimal residual disease-positive test result means that residual disorder was detected. A negative impact means that residual disease was not detected. The minimal residual disease is a prognostic, postdiagnosis indicator that can be utilized for risk stratification and to guide therapeutic options when used alongside other molecular or clinical data. MRD can assist in identifying which patients are at higher risk for relapse, permitting additional or earlier treatments. Minimal residual disease testing utilizes highly sensitive methods. Next-generation sequencing (NGS), flow cytometry, and polymerase chain reaction (PCR) are the most widely used tests. PCR can recognize malignant cells based on their characteristic genetic abnormalities like mutations or chromosomal changes. NGS tests can rapidly analyze stretches of RNA or DNA. Next-generation sequencing can detect mutations and other genetic abnormalities in DNA extracted from a bone marrow aspirate sample. Flow cytometry is a technique that assesses individual cells by checking for the presence or the absence of specific protein markers on the cell surface. Minimal residual disease testing in myeloma utilizes flow cytometry, next-generation sequencing, and imaging tests.
Get an overview of this study by requesting a free sample
For example, in October 2021, Inivata Limited Company, a subsidiary of NeoGenomics, Inc., entered a clinical association with the Princess Margaret Cancer Center in Canada, Toronto, to use Inivata's InVisionFirst-Lung & RaDaR liquid biopsy assays in two different studies.
For example, in May 2021, Invivoscribe Company announced licensing of essential software and two new minimal residual disease clinical services. The firm's LymphoTrack Enterprise Software supported high-volume consumers to meet rising testing demands.
The high incidences of cancer worldwide: The increasing research funding from the National Cancer Institute, the rise in personalized medicines for treatment, and the increasing disposable income in emerging economies are the driving factor of the market growth. Cancer is a generic term for many disorders affecting any body part. Other terms utilized are neoplasms and malignant tumors. A correct cancer diagnosis is vital for effective and appropriate treatment because every cancer type needs a specific treatment regimen. Globally, cancer is one of the top causes of death. Environmental causes, genetics, and personal health impact each nation’s cancer rate. The nation with the lowest cancer mortality rate is India, where doctors stress the significance of early detection & research. The US has the highest cancer rate of all observed nations, possibly due to progressive screening tests. China is the country with the highest rate of cancer-related death. Lung cancer, in specific, is overall in China, likely due to risk factors like smoking and air pollution. In addition, the growing uses of NGS in clinical diagnosis, the increased R&D activities utilizing NGS technologies, and increased healthcare expenditure is also helping boost market growth.
The high cost of research and development activities: The R&D gives new products and increases industry leadership R&D represents the activities firms undertake to innovate and introduce new services or products or improve their existing offerings. Moreover, the healthcare, industrial, technological, and pharmaceutical sectors generally incur the highest research and development expenses. Further, despite considerable advancements to broaden next-generation sequencing applications from research to the clinic, next-generation sequencing still presents massive challenges in quality control management, processing, data storage, and interpretation, which slow the translation from the benchtop to the bedside. This factor is also hindering market growth.
The rise in personalized medicines for treatment: The development of efficient & advanced technology and the increasing government initiatives worldwide are the driving factor of the market growth. Personalized medicine is a novel & exciting topic in the medicine and healthcare industries. Personalized medicine focuses on exploring a person's genome, biometrical, social, environmental, and religious influencers & determining a treatment for the individual based on that data. In addition, the proliferation in the costs of developing advanced infrastructures and the increase in clinical trials for personalized medicine in neurology departments propel the market growth.
The regions analyzed for the market include Europe, South America, Asia Pacific, North America, the Middle East, and Africa. North America emerged as the largest market for the global minimal residual disease market, with a 45.42% share of the market revenue in 2022. North America dominates the minimal residual disease market due to the rise in disease prevalence. Further, the accelerated economic growth of many countries, the rising number of hospitals in developing regions, key pharmaceutical advancements, and proliferation in the number of emerging markets are also propelling the market growth in this region. The Asia Pacific is expected to grow the fastest during the forecast period due to the increasing prevalence of hematological malignancy & cancer. Further, the government initiatives & investments in large-scale genome sequencing projects to design targeted medicines also help to drive market growth. In addition, the presence of significant companies & industries, rapid proliferation in paternity testing, genealogy, and personal health awareness propel the market growth in this region during the forecast period.
North America Region Minimal Residual Disease Market Share in 2022 - 45.42%
www.thebrainyinsights.com
Check the geographical analysis of this market by requesting a free sample
The detection target segment is divided into lymphoma, leukemia, solid tumors, and others. The lymphoma segment dominated, with a market share of around 25.16% in 2022. This growth is attributed to the rising healthcare expenditure and the continuous innovation of therapies.
The test technique segment is divided into fluorescence in situ hybridization (FISH), polymerase chain reaction (PCR), and next-generation sequencing (NGS). In 2022, the next-generation sequencing (NGS) segment dominated the market with the largest market share of 40.24% and market revenue of 506.70 million. This growth is attributed to the increasing healthcare expenditure and the growing demand for early detection of cancer & infectious diseases. Next-generation sequencing has revolutionized the biological sciences, permitting labs to perform different applications & study biological systems at the last level. Next generation sequencing is a massively parallel sequencing technology that offers ultra-high throughput, speed, and scalability. The technology specifies the order of nucleotides in entire genomes or targeted regions of RNA or DNA.
The end-user segment is divided into hospitals, specialty clinics, and laboratory centers. In 2022, the hospital segment dominated the market with the largest market share of 41.11% and market revenue of 517.65 million. This growth is attributed to the increasing cost of medical services and the growing cancer incidence.
The test type segment is divided into RNA-based test, DNA-based test, and immunological test. In 2022, the DNA-based test segment dominated the market, accounting for around 42.15% of global revenue. This growth is attributed to increased awareness and acceptance of personalized medicines.
| Attribute | Description |
|---|---|
| Market Size | Revenue (USD Billion), Volume (Kg) |
| Market size value in 2022 | USD 1259.20 Million |
| Market size value in 2030 | USD 3927.60 Million |
| CAGR (2022 to 2030) | 10.34% |
| Historical data | 2019-2020 |
| Base Year | 2021 |
| Forecast | 2022-2030 |
| Segments | Key Segments are detection target, test technique, end-user, test type, and regions |
| Regional Segments | The key regions are Asia Pacific, North America, South America, Europe, and Middle East & Africa. |
As per The Brainy Insights, the size of the minimal residual disease market was valued at USD 1259.20 million in 2022 to USD 3927.60 million by 2030.
Global minimal residual disease market is growing at a CAGR of 15.28% during the forecast period 2022-2030.
The global minimal residual disease market has been segmented based on detection target, test technique, end-user, test type, and regions. The lymphoma segment led detection target segment in 2022.
North America region emerged as the largest market for the minimal residual disease.
1. Introduction
1.1. Objectives of the Study
1.2. Market Definition
1.3. Research Scope
1.4. Currency
1.5. Key Target Audience
2. Research Methodology and Assumptions
3. Executive Summary
4. Premium Insights
4.1. Porter’s Five Forces Analysis
4.2. Value Chain Analysis
4.3. Top Investment Pockets
4.3.1. Market Attractiveness Analysis By Detection Target
4.3.2. Market Attractiveness Analysis By Test Technique
4.3.3. Market Attractiveness Analysis By End-User
4.3.4. Market Attractiveness Analysis By Test Type
4.3.5. Market Attractiveness Analysis By Region
4.4. Industry Trends
5. Market Dynamics
5.1. Market Evaluation
5.2. Drivers
5.2.1. The increasing investment by government and private organizations in MRD research
5.2.2. The growing prevalence of different types of cancer worldwide
5.2.3. The increasing consumer awareness for tailored therapy
5.3. Restraints
5.3.1. The high cost of research and development activities
5.4. Opportunities
5.4.1. The rise in the personalized medicines for the treatment
5.4.2. The rise in the collaborations for product development
5.5. Challenges
5.5.1. The lack of trained professionals and unavailability centres
6. Global Minimal Residual Disease Market Analysis and Forecast, By Detection Target
6.1. Segment Overview
6.2. Lymphoma
6.3. Leukemia
6.4. Solid Tumors
6.5. Others
7. Global Minimal Residual Disease Market Analysis and Forecast, By Test Technique
7.1. Segment Overview
7.2. Fluorescence in Situ Hybridization (FISH)
7.3. Polymerase Chain Reaction (PCR)
7.4. Next Generation Sequencing (NGS)
8. Global Minimal Residual Disease Market Analysis and Forecast, By End-User
8.1. Segment Overview
8.2. Hospitals
8.3. Specialty Clinics
8.4. Laboratory Centers
9. Global Minimal Residual Disease Market Analysis and Forecast, By Test Type
9.1. Segment Overview
9.2. RNA-Based Test
9.3. DNA-Based Test
9.4. Immunological Test
10. Global Minimal Residual Disease Market Analysis and Forecast, By Regional Analysis
10.1. Segment Overview
10.2. North America
10.2.1. U.S.
10.2.2. Canada
10.2.3. Mexico
10.3. Europe
10.3.1. Germany
10.3.2. France
10.3.3. U.K.
10.3.4. Italy
10.3.5. Spain
10.4. Asia-Pacific
10.4.1. Japan
10.4.2. China
10.4.3. India
10.5. South America
10.5.1. Brazil
10.6. Middle East and Africa
10.6.1. UAE
10.6.2. South Africa
11. Global Minimal Residual Disease Market-Competitive Landscape
11.1. Overview
11.2. Market Share of Key Players in Global Minimal Residual Disease Market
11.2.1. Global Company Market Share
11.2.2. North America Company Market Share
11.2.3. Europe Company Market Share
11.2.4. APAC Company Market Share
11.3. Competitive Situations and Trends
11.3.1. Product Launches and Developments
11.3.2. Partnerships, Collaborations, and Agreements
11.3.3. Mergers & Acquisitions
11.3.4. Expansions
12. Company Profiles
12.1. Sysmex Corporation
12.1.1. Business Overview
12.1.2. Company Snapshot
12.1.3. Company Market Share Analysis
12.1.4. Company Product Portfolio
12.1.5. Recent Developments
12.1.6. SWOT Analysis
12.2. ArcherDX(Invitae)
12.2.1. Business Overview
12.2.2. Company Snapshot
12.2.3. Company Market Share Analysis
12.2.4. Company Product Portfolio
12.2.5. Recent Developments
12.2.6. SWOT Analysis
12.3. ICON plc
12.3.1. Business Overview
12.3.2. Company Snapshot
12.3.3. Company Market Share Analysis
12.3.4. Company Product Portfolio
12.3.5. Recent Developments
12.3.6. SWOT Analysis
12.4. Asuragen
12.4.1. Business Overview
12.4.2. Company Snapshot
12.4.3. Company Market Share Analysis
12.4.4. Company Product Portfolio
12.4.5. Recent Developments
12.4.6. SWOT Analysis
12.5. Mission Bio
12.5.1. Business Overview
12.5.2. Company Snapshot
12.5.3. Company Market Share Analysis
12.5.4. Company Product Portfolio
12.5.5. Recent Developments
12.5.6. SWOT Analysis
12.6. ARUP Laboratories
12.6.1. Business Overview
12.6.2. Company Snapshot
12.6.3. Company Market Share Analysis
12.6.4. Company Product Portfolio
12.6.5. Recent Developments
12.6.6. SWOT Analysis
12.7. Guardant Health
12.7.1. Business Overview
12.7.2. Company Snapshot
12.7.3. Company Market Share Analysis
12.7.4. Company Product Portfolio
12.7.5. Recent Developments
12.7.6. SWOT Analysis
12.8. Cergentis B.V.
12.8.1. Business Overview
12.8.2. Company Snapshot
12.8.3. Company Market Share Analysis
12.8.4. Company Product Portfolio
12.8.5. Recent Developments
12.8.6. SWOT Analysis
12.9. Invivoscribe
12.9.1. Business Overview
12.9.2. Company Snapshot
12.9.3. Company Market Share Analysis
12.9.4. Company Product Portfolio
12.9.5. Recent Developments
12.9.6. SWOT Analysis
12.10. NeoGenomics Laboratories
12.10.1. Business Overview
12.10.2. Company Snapshot
12.10.3. Company Market Share Analysis
12.10.4. Company Product Portfolio
12.10.5. Recent Developments
12.10.6. SWOT Analysis
12.11. Bio-Rad Laboratories
12.11.1. Business Overview
12.11.2. Company Snapshot
12.11.3. Company Market Share Analysis
12.11.4. Company Product Portfolio
12.11.5. Recent Developments
12.11.6. SWOT Analysis
12.12. Opko Health
12.12.1. Business Overview
12.12.2. Company Snapshot
12.12.3. Company Market Share Analysis
12.12.4. Company Product Portfolio
12.12.5. Recent Developments
12.12.6. SWOT Analysis
12.13. LabCorp
12.13.1. Business Overview
12.13.2. Company Snapshot
12.13.3. Company Market Share Analysis
12.13.4. Company Product Portfolio
12.13.5. Recent Developments
12.13.6. SWOT Analysis
12.14. Adaptive Biotechnologies
12.14.1. Business Overview
12.14.2. Company Snapshot
12.14.3. Company Market Share Analysis
12.14.4. Company Product Portfolio
12.14.5. Recent Developments
12.14.6. SWOT Analysis
12.15. Natera
12.15.1. Business Overview
12.15.2. Company Snapshot
12.15.3. Company Market Share Analysis
12.15.4. Company Product Portfolio
12.15.5. Recent Developments
12.15.6. SWOT Analysis
12.16. Inivata
12.16.1. Business Overview
12.16.2. Company Snapshot
12.16.3. Company Market Share Analysis
12.16.4. Company Product Portfolio
12.16.5. Recent Developments
12.16.6. SWOT Analysis
12.17. Sysmex Corporation
12.17.1. Business Overview
12.17.2. Company Snapshot
12.17.3. Company Market Share Analysis
12.17.4. Company Product Portfolio
12.17.5. Recent Developments
12.17.6. SWOT Analysis
12.18. Quest Diagnostics
12.18.1. Business Overview
12.18.2. Company Snapshot
12.18.3. Company Market Share Analysis
12.18.4. Company Product Portfolio
12.18.5. Recent Developments
12.18.6. SWOT Analysis
List of Table
1. Global Minimal Residual Disease Market, By Detection Target, 2019-2030 (USD Million)
2. Global Lymphoma, Minimal Residual Disease Market, By Region, 2019-2030 (USD Million)
3. Global Leukemia, Minimal Residual Disease Market, By Region, 2019-2030 (USD Million)
4. Global Solid Tumors, Minimal Residual Disease Market, By Region, 2019-2030 (USD Million)
5. Global Others, Minimal Residual Disease Market, By Region, 2019-2030 (USD Million)
6. Global Minimal Residual Disease Market, By Test Technique, 2019-2030 (USD Million)
7. Global Fluorescence in Situ Hybridization (FISH), Minimal Residual Disease Market, By Region, 2019-2030 (USD Million)
8. Global Polymerase Chain Reaction (PCR), Minimal Residual Disease Market, By Region, 2019-2030 (USD Million)
9. Global Next Generation Sequencing (NGS), Minimal Residual Disease Market, By Region, 2019-2030 (USD Million)
10. Global Minimal Residual Disease Market, By End-User, 2019-2030 (USD Million)
11. Global Hospitals, Minimal Residual Disease Market, By Region, 2019-2030 (USD Million)
12. Global Specialty Clinics, Minimal Residual Disease Market, By Region, 2019-2030 (USD Million)
13. Global Laboratory Centers, Minimal Residual Disease Market, By Region, 2019-2030 (USD Million)
14. Global Minimal Residual Disease Market, By Test Type, 2019-2030 (USD Million)
15. Global RNA-Based Test, Minimal Residual Disease Market, By Region, 2019-2030 (USD Million)
16. Global DNA-Based Test, Minimal Residual Disease Market, By Region, 2019-2030 (USD Million)
17. Global Immunological Test, Minimal Residual Disease Market, By Region, 2019-2030 (USD Million)
18. North America Minimal Residual Disease Market, By Detection Target, 2019-2030 (USD Million)
19. North America Minimal Residual Disease Market, By Test Technique, 2019-2030 (USD Million)
20. North America Minimal Residual Disease Market, By End-User, 2019-2030 (USD Million)
21. North America Minimal Residual Disease Market, By Test Type, 2019-2030 (USD Million)
22. U.S. Minimal Residual Disease Market, By Detection Target, 2019-2030 (USD Million)
23. U.S. Minimal Residual Disease Market, By Test Technique, 2019-2030 (USD Million)
24. U.S. Minimal Residual Disease Market, By End-User, 2019-2030 (USD Million)
25. U.S. Minimal Residual Disease Market, By Test Type, 2019-2030 (USD Million)
26. Canada Minimal Residual Disease Market, By Detection Target, 2019-2030 (USD Million)
27. Canada Minimal Residual Disease Market, By Test Technique, 2019-2030 (USD Million)
28. Canada Minimal Residual Disease Market, By End-User, 2019-2030 (USD Million)
29. Canada Minimal Residual Disease Market, By Test Type, 2019-2030 (USD Million)
30. Mexico Minimal Residual Disease Market, By Detection Target, 2019-2030 (USD Million)
31. Mexico Minimal Residual Disease Market, By Test Technique, 2019-2030 (USD Million)
32. Mexico Minimal Residual Disease Market, By End-User, 2019-2030 (USD Million)
33. Mexico Minimal Residual Disease Market, By Test Type, 2019-2030 (USD Million)
34. Europe Minimal Residual Disease Market, By Detection Target, 2019-2030 (USD Million)
35. Europe Minimal Residual Disease Market, By Test Technique, 2019-2030 (USD Million)
36. Europe Minimal Residual Disease Market, By End-User, 2019-2030 (USD Million)
37. Europe Minimal Residual Disease Market, By Test Type, 2019-2030 (USD Million)
38. Germany Minimal Residual Disease Market, By Detection Target, 2019-2030 (USD Million)
39. Germany Minimal Residual Disease Market, By Test Technique, 2019-2030 (USD Million)
40. Germany Minimal Residual Disease Market, By End-User, 2019-2030 (USD Million)
41. Germany Minimal Residual Disease Market, By Test Type, 2019-2030 (USD Million)
42. France Minimal Residual Disease Market, By Detection Target, 2019-2030 (USD Million)
43. France Minimal Residual Disease Market, By Test Technique, 2019-2030 (USD Million)
44. France Minimal Residual Disease Market, By End-User, 2019-2030 (USD Million)
45. France Minimal Residual Disease Market, By Test Type, 2019-2030 (USD Million)
46. U.K. Minimal Residual Disease Market, By Detection Target, 2019-2030 (USD Million)
47. U.K. Minimal Residual Disease Market, By Test Technique, 2019-2030 (USD Million)
48. U.K. Minimal Residual Disease Market, By End-User, 2019-2030 (USD Million)
49. U.K. Minimal Residual Disease Market, By Test Type, 2019-2030 (USD Million)
50. Italy Minimal Residual Disease Market, By Detection Target, 2019-2030 (USD Million)
51. Italy Minimal Residual Disease Market, By Test Technique, 2019-2030 (USD Million)
52. Italy Minimal Residual Disease Market, By End-User, 2019-2030 (USD Million)
53. Italy Minimal Residual Disease Market, By Test Type, 2019-2030 (USD Million)
54. Spain Minimal Residual Disease Market, By Detection Target, 2019-2030 (USD Million)
55. Spain Minimal Residual Disease Market, By Test Technique, 2019-2030 (USD Million)
56. Spain Minimal Residual Disease Market, By End-User, 2019-2030 (USD Million)
57. Spain Minimal Residual Disease Market, By Test Type, 2019-2030 (USD Million)
58. Asia Pacific Minimal Residual Disease Market, By Detection Target, 2019-2030 (USD Million)
59. Asia Pacific Minimal Residual Disease Market, By Test Technique, 2019-2030 (USD Million)
60. Asia Pacific Minimal Residual Disease Market, By End-User, 2019-2030 (USD Million)
61. Asia Pacific Minimal Residual Disease Market, By Test Type, 2019-2030 (USD Million)
62. Japan Minimal Residual Disease Market, By Detection Target, 2019-2030 (USD Million)
63. Japan Minimal Residual Disease Market, By Test Technique, 2019-2030 (USD Million)
64. Japan Minimal Residual Disease Market, By End-User, 2019-2030 (USD Million)
65. Japan Minimal Residual Disease Market, By Test Type, 2019-2030 (USD Million)
66. China Minimal Residual Disease Market, By Detection Target, 2019-2030 (USD Million)
67. China Minimal Residual Disease Market, By Test Technique, 2019-2030 (USD Million)
68. China Minimal Residual Disease Market, By End-User, 2019-2030 (USD Million)
69. China Minimal Residual Disease Market, By Test Type, 2019-2030 (USD Million)
70. India Minimal Residual Disease Market, By Detection Target, 2019-2030 (USD Million)
71. India Minimal Residual Disease Market, By Test Technique, 2019-2030 (USD Million)
72. India Minimal Residual Disease Market, By End-User, 2019-2030 (USD Million)
73. India Minimal Residual Disease Market, By Test Type, 2019-2030 (USD Million)
74. South America Minimal Residual Disease Market, By Detection Target, 2019-2030 (USD Million)
75. South America Minimal Residual Disease Market, By Test Technique, 2019-2030 (USD Million)
76. South America Minimal Residual Disease Market, By End-User, 2019-2030 (USD Million)
77. South America Minimal Residual Disease Market, By Test Type, 2019-2030 (USD Million)
78. Brazil Minimal Residual Disease Market, By Detection Target, 2019-2030 (USD Million)
79. Brazil Minimal Residual Disease Market, By Test Technique, 2019-2030 (USD Million)
80. Brazil Minimal Residual Disease Market, By End-User, 2019-2030 (USD Million)
81. Brazil Minimal Residual Disease Market, By Test Type, 2019-2030 (USD Million)
82. Middle East and Africa Minimal Residual Disease Market, By Detection Target, 2019-2030 (USD Million)
83. Middle East and Africa Minimal Residual Disease Market, By Test Technique, 2019-2030 (USD Million)
84. Middle East and Africa Minimal Residual Disease Market, By End-User, 2019-2030 (USD Million)
85. Middle East and Africa Minimal Residual Disease Market, By Test Type, 2019-2030 (USD Million)
86. UAE Minimal Residual Disease Market, By Detection Target, 2019-2030 (USD Million)
87. UAE Minimal Residual Disease Market, By Test Technique, 2019-2030 (USD Million)
88. UAE Minimal Residual Disease Market, By End-User, 2019-2030 (USD Million)
89. UAE Minimal Residual Disease Market, By Test Type, 2019-2030 (USD Million)
90. South Africa Minimal Residual Disease Market, By Detection Target, 2019-2030 (USD Million)
91. South Africa Minimal Residual Disease Market, By Test Technique, 2019-2030 (USD Million)
92. South Africa Minimal Residual Disease Market, By End-User, 2019-2030 (USD Million)
93. South Africa Minimal Residual Disease Market, By Test Type, 2019-2030 (USD Million)
List of Figures
1. Global Minimal Residual Disease Market Segmentation
2. Global Minimal Residual Disease Market: Research Methodology
3. Market Size Estimation Methodology: Bottom-Up Approach
4. Market Size Estimation Methodology: Top-Down Approach
5. Data Triangulation
6. Porter’s Five Forces Analysis
7. Value Chain Analysis
8. Global Minimal Residual Disease Market Attractiveness Analysis By Detection Target
9. Global Minimal Residual Disease Market Attractiveness Analysis By Test Technique
10. Global Minimal Residual Disease Market Attractiveness Analysis By End-User
11. Global Minimal Residual Disease Market Attractiveness Analysis By Test Type
12. Global Minimal Residual Disease Market Attractiveness Analysis By Region
13. Global Minimal Residual Disease Market: Dynamics
14. Global Minimal Residual Disease Market Share By Detection Target (2022 & 2030)
15. Global Minimal Residual Disease Market Share By Test Technique (2022 & 2030)
16. Global Minimal Residual Disease Market Share By End-User (2022 & 2030)
17. Global Minimal Residual Disease Market Share By Test Type (2022 & 2030)
18. Global Minimal Residual Disease Market Share By Regions (2022 & 2030)
19. Global Minimal Residual Disease Market Share By Company (2021)
This study forecasts revenue at global, regional, and country levels from 2019 to 2030. The Brainy Insights has segmented the global minimal residual disease based on below mentioned segments:
Global Minimal Residual Disease Market by Detection Target:
Global Minimal Residual Disease Market by Test Technique:
Global Minimal Residual Disease Market by End-User:
Global Minimal Residual Disease Market by Test Type:
Global Minimal Residual Disease by Region:
Research has its special purpose to undertake marketing efficiently. In this competitive scenario, businesses need information across all industry verticals; the information about customer wants, market demand, competition, industry trends, distribution channels etc. This information needs to be updated regularly because businesses operate in a dynamic environment. Our organization, The Brainy Insights incorporates scientific and systematic research procedures in order to get proper market insights and industry analysis for overall business success. The analysis consists of studying the market from a miniscule level wherein we implement statistical tools which helps us in examining the data with accuracy and precision.
Our research reports feature both; quantitative and qualitative aspects for any market. Qualitative information for any market research process are fundamental because they reveal the customer needs and wants, usage and consumption for any product/service related to a specific industry. This in turn aids the marketers/investors in knowing certain perceptions of the customers. Qualitative research can enlighten about the different product concepts and designs along with unique service offering that in turn, helps define marketing problems and generate opportunities. On the other hand, quantitative research engages with the data collection process through interviews, e-mail interactions, surveys and pilot studies. Quantitative aspects for the market research are useful to validate the hypotheses generated during qualitative research method, explore empirical patterns in the data with the help of statistical tools, and finally make the market estimations.
The Brainy Insights offers comprehensive research and analysis, based on a wide assortment of factual insights gained through interviews with CXOs and global experts and secondary data from reliable sources. Our analysts and industry specialist assume vital roles in building up statistical tools and analysis models, which are used to analyse the data and arrive at accurate insights with exceedingly informative research discoveries. The data provided by our organization have proven precious to a diverse range of companies, facilitating them to address issues such as determining which products/services are the most appealing, whether or not customers use the product in the manner anticipated, the purchasing intentions of the market and many others.
Our research methodology encompasses an idyllic combination of primary and secondary initiatives. Key phases involved in this process are listed below:

The phase involves the gathering and collecting of market data and its related information with the help of different sources & research procedures.

The data procurement stage involves in data gathering and collecting through various data sources.
This stage involves in extensive research. These data sources includes:
Purchased Database: Purchased databases play a crucial role in estimating the market sizes irrespective of the domain. Our purchased database includes:
Primary Research: The Brainy Insights interacts with leading companies and experts of the concerned domain to develop the analyst team’s market understanding and expertise. It improves and substantiates every single data presented in the market reports. Primary research mainly involves in telephonic interviews, E-mail interactions and face-to-face interviews with the raw material providers, manufacturers/producers, distributors, & independent consultants. The interviews that we conduct provides valuable data on market size and industry growth trends prevailing in the market. Our organization also conducts surveys with the various industry experts in order to gain overall insights of the industry/market. For instance, in healthcare industry we conduct surveys with the pharmacists, doctors, surgeons and nurses in order to gain insights and key information of a medical product/device/equipment which the customers are going to usage. Surveys are conducted in the form of questionnaire designed by our own analyst team. Surveys plays an important role in primary research because surveys helps us to identify the key target audiences of the market. Additionally, surveys helps to identify the key target audience engaged with the market. Our survey team conducts the survey by targeting the key audience, thus gaining insights from them. Based on the perspectives of the customers, this information is utilized to formulate market strategies. Moreover, market surveys helps us to understand the current competitive situation of the industry. To be precise, our survey process typically involve with the 360 analysis of the market. This analytical process begins by identifying the prospective customers for a product or service related to the market/industry to obtain data on how a product/service could fit into customers’ lives.

Secondary Research: The secondary data sources includes information published by the on-profit organizations such as World bank, WHO, company fillings, investor presentations, annual reports, national government documents, statistical databases, blogs, articles, white papers and others. From the annual report, we analyse a company’s revenue to understand the key segment and market share of that organization in a particular region. We analyse the company websites and adopt the product mapping technique which is important for deriving the segment revenue. In the product mapping method, we select and categorize the products offered by the companies catering to domain specific market, deduce the product revenue for each of the companies so as to get overall estimation of the market size. We also source data and analyses trends based on information received from supply side and demand side intermediaries in the value chain. The supply side denotes the data gathered from supplier, distributor, wholesaler and the demand side illustrates the data gathered from the end customers for respective market domain.

The supply side for a domain specific market is analysed by:
The demand side for the market is estimated through:
In-house Library: Apart from these third-party sources, we have our in-house library of qualitative and quantitative information. Our in-house database includes market data for various industry and domains. These data are updated on regular basis as per the changing market scenario. Our library includes, historic databases, internal audit reports and archives.
Sometimes there are instances where there is no metadata or raw data available for any domain specific market. For those cases, we use our expertise to forecast and estimate the market size in order to generate comprehensive data sets. Our analyst team adopt a robust research technique in order to produce the estimates:
Data Synthesis: This stage involves the analysis & mapping of all the information obtained from the previous step. It also involves in scrutinizing the data for any discrepancy observed while data gathering related to the market. The data is collected with consideration to the heterogeneity of sources. Robust scientific techniques are in place for synthesizing disparate data sets and provide the essential contextual information that can orient market strategies. The Brainy Insights has extensive experience in data synthesis where the data passes through various stages:


Market Deduction & Formulation: The final stage comprises of assigning data points at appropriate market spaces so as to deduce feasible conclusions. Analyst perspective & subject matter expert based holistic form of market sizing coupled with industry analysis also plays a crucial role in this stage.
This stage involves in finalization of the market size and numbers that we have collected from data integration step. With data interpolation, it is made sure that there is no gap in the market data. Successful trend analysis is done by our analysts using extrapolation techniques, which provide the best possible forecasts for the market.
Data Validation & Market Feedback: Validation is the most important step in the process. Validation & re-validation via an intricately designed process helps us finalize data-points to be used for final calculations.

The Brainy Insights interacts with leading companies and experts of the concerned domain to develop the analyst team’s market understanding and expertise. It improves and substantiates every single data presented in the market reports. The data validation interview and discussion panels are typically composed of the most experienced industry members. The participants include, however, are not limited to:
Moreover, we always validate our data and findings through primary respondents from all the major regions we are working on.


Free Customization
Fortune 500 Clients
Free Yearly Update On Purchase Of Multi/Corporate License
Companies Served Till Date