- +1-315-215-1633
- sales@thebrainyinsights.com

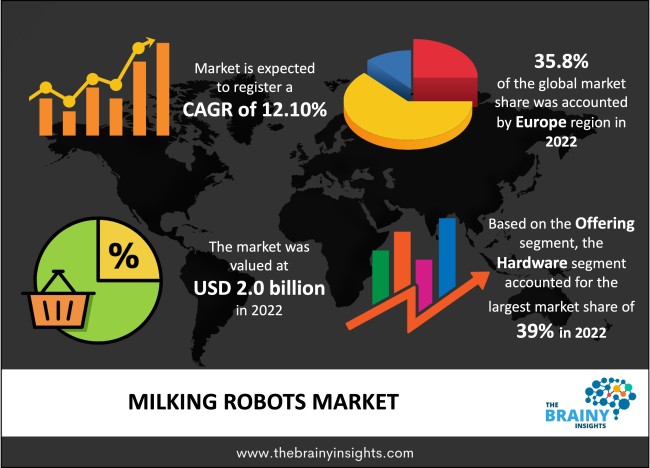
The global milking robots market was valued at USD 2.0 billion in 2022 and growing at a CAGR of 12.10% from 2023 to 2032. The market is expected to reach USD 6.2 billion by 2032. Increase in the dairy industry and the high demand for automatic milking systems solutions over standard milking procedures to enhance milk production at lesser labour costs significantly push market growth, which is further influenced by the growing demand for dairy products, including curd, butter, and milk, due to their multiple health advantages and healthy compositions. Other growth-inducing elements include the integration of self-contained controller (SCC) sensors and the start of robot framework monitors to examine milk flow and proactively detect mastitis early.
Milking robots are automatic machines where milk is obtained by using computers and special herd management software system.. The cows are milked throughout the day, including 1 or 2 h needed for cleaning the device. The average number of milkings per day is 2.5–3. The result is 10–15% higher production. Robotic milking technology was created in Europe to address labor problems in dairy farms. The technology was presented to Michigan in 2009 and the United States in 2000. Robotic milking is an essential link in the food chain; handling a farm with milking robots needs a different approach than conventional milking. The milking robot stores cow-related information unobtainable in a conventional case, making it possible to manage animals individually in the present scenario.. Automatic milking systems gather information on milk quality, quantity, and cow health, which allows farmers to better manage their herds. The foremost milking robots were established on commercial dairy farms in the Netherlands in 1992. The real breakthrough in automated milking came at the end of the 90s. Today there are around 1300 dairy farms globally milking their cows automatically. Over 95% of all dairy farms with automated milking systems are situated in northwestern Europe, with by far the most significant number in the Netherlands, the birthplace of robotic milking. Canada's first robotic milking system was established at the University of Guelph in the late 80s and stopped operation. Alberta is the fourth province to embrace robotic milking, with six working robots in 3 dairies. Ontario has nearly 55 robots in about 30 dairies, while Québec claims a comparable figure.
Get an overview of this study by requesting a free sample
The Automation of Dairy Farms Has Reduced Labour Costs- Milk production is labor-intensive. The labour and operating expenses are expected to increase due to the growing need for dairy products and the development of dairy farms globally. By enhancing milk output, milking automation technology, like milking robots, can majorly lower labour expenses on dairy farms. Not only do milking robots underestimate manual labour, but it also improves the number of times a single cow can be milked, raising the outcome.
High Investment Expenses- The initial expense of developing and maintaining these systems is the main factor hampering market growth. In nations with appropriate herd sizes, integration of these systems has yet to be a fact. In expansion, the functioning and usability of milking robots mainly depend on the cow activity presented on dairy farms. To enhance efficiency, cows must change and adjust to the systems. The primary activity is expected to be a crucial issue hindering the market.
Technical Advancement- Technological advancement and integrating different technologies are primary factors stimulating market development. The robots are incorporated with different sensors and measurement devices which serve the operational workflow and monitor the same. For example, in January 2019, GEA Group revealed a unique milking system engineered to improve the milking process and improve the on-farm efficiency. Further, the robot integrated with the SCC monitor sensor proactively examines milk flow constantly throughout the milking procedure.
The regions analyzed for the market include North America, Europe, South America, Asia Pacific, the Middle East, and Africa. Europe emerged as the largest market for the global milking robots’ market, with a 35.8% share of the market revenue in 2022.
Europe is dominating the market for milking robots. France and the Netherlands are the top countries in the region. Multiple dairy farms and the growing need for milk production in these nations are expanding the sales of milking robots in Europe. The larger herd size of dairy farms in European nations pushes market development.
Europe Region Milking Robots Market Share in 2022 - 35.8%
www.thebrainyinsights.com
Check the geographical analysis of this market by requesting a free sample
The offering segment is divided into software, hardware, and services. The hardware segment dominated the market, with a market share of around 39% in 2022. The growing importance of automated hardware and systems, the rising adoption of milking robots, the technical advances that critical players are creating to present innovative products, the increasing need for dairy products, and the following growth in dairy cows globally are some of the essential elements that are pushing demand for milking robots’ hardware.
The type segment is divided into a single-stall milking system, automated milking rotary, and multi-stall milking system. The automated milking rotary segment dominated the market, with a market share of around 37% in 2022. The fully automated milking system uses machines designed to apply a regular vacuum to the end of the teat to suck the milk out and transfer it to a suitable container.. The users have five hydraulic robots, individually designed for a particular objective, and users can do up to 1,700 automated milkings daily.
The herd size segment is divided into less than 100, between 100 to 1, 000 and more than 1, 000. Between 100 to 1, 000 segment dominated the market, with a market share of around 35% in 2022. Rising need for milk and milk products across the globe. Furthermore, medium-sized dairy farms install multi-stall milking or automated rotary robots to improve efficiency and productivity and achieve maximum profit via herds.
| Attribute | Description |
|---|---|
| Market Size | Revenue (USD Billion) |
| Market size value in 2022 | USD 2.0 Billion |
| Market size value in 2032 | USD 6.2 Billion |
| CAGR (2023 to 2032) | 12.10% |
| Historical data | 2019-2021 |
| Base Year | 2022 |
| Forecast | 2023-2032 |
| Regional Segments | The regions analyzed for the market are Asia Pacific, Europe, South America, North America, and Middle East & Africa. Furthermore, the regions are further analyzed at the country level. |
| Segments | Offering, Type, Herd Size |
As per The Brainy Insights, the size of the milking robots market was valued at USD 2.0 billion in 2022 to USD 6.2 billion by 2032.
Global milking robots market is growing at a CAGR of 12.10% during the forecast period 2023-2032.
Europe region emerged as the largest market for the milking robots market.
The automation of dairy farms has reduced labour costs which propels market growth.
1. Introduction
1.1. Objectives of the Study
1.2. Market Definition
1.3. Research Scope
1.4. Currency
1.5. Key Target Audience
2. Research Methodology and Assumptions
3. Executive Summary
4. Premium Insights
4.1. Porter’s Five Forces Analysis
4.2. Value Chain Analysis
4.3. Top Investment Pockets
4.3.1. Market Attractiveness Analysis by Offering
4.3.2. Market Attractiveness Analysis by Type
4.3.3. Market Attractiveness Analysis by Herd Size
4.3.4. Market Attractiveness Analysis by Region
4.4. Industry Trends
5. Market Dynamics
5.1. Market Evaluation
5.2. Drivers
5.2.1. The automation of dairy farms has reduced labour costs
5.3. Restraints
5.3.1. High investment expenses
5.4. Opportunities
5.4.1. Technical advancement are pushing market growth
6. Global Milking Robots Market Analysis and Forecast, By Offering:
6.1. Segment Overview
6.2. Software
6.3. Hardware
6.4. Services
7. Global Milking Robots Market Analysis and Forecast, By Type
7.1. Segment Overview
7.2. Single-stall Milking System
7.3. Automated Milking Rotary
7.4. Multi-stall Milking System
8. Global Milking Robots Market Analysis and Forecast, By Herd Size
8.1. Segment Overview
8.2. Less than 100
8.3. Between 100 to 1, 000
8.4. More than 1, 000
9. Global Milking Robots Market Analysis and Forecast, By Regional Analysis
9.1. Segment Overview
9.2. North America
9.2.1. U.S.
9.2.2. Canada
9.2.3. Mexico
9.3. Europe
9.3.1. Germany
9.3.2. France
9.3.3. U.K.
9.3.4. Italy
9.3.5. Spain
9.4. Asia-Pacific
9.4.1. Japan
9.4.2. China
9.4.3. India
9.5. South America
9.5.1. Brazil
9.6. Middle East and Africa
9.6.1. UAE
9.6.2. South Africa
10. Global Milking Robots Market-Competitive Landscape
10.1. Overview
10.2. Market Share of Key Players in the Milking Robots Market
10.2.1. Global Company Market Share
10.2.2. North America Company Market Share
10.2.3. Europe Company Market Share
10.2.4. APAC Company Market Share
10.3. Competitive Situations and Trends
10.3.1. Product Launches and Developments
10.3.2. Partnerships, Collaborations, and Agreements
10.3.3. Mergers & Acquisitions
10.3.4. Expansions
11. Company Profiles
11.1. Afimilk Ltd
11.1.1. Business Overview
11.1.2. Company Snapshot
11.1.3. Company Market Share Analysis
11.1.4. Company Product Portfolio
11.1.5. Recent Developments
11.1.6. SWOT Analysis
11.2. BouMatic.
11.2.1. Business Overview
11.2.2. Company Snapshot
11.2.3. Company Market Share Analysis
11.2.4. Company Product Portfolio
11.2.5. Recent Developments
11.2.6. SWOT Analysis
11.3. Dairymaster
11.3.1. Business Overview
11.3.2. Company Snapshot
11.3.3. Company Market Share Analysis
11.3.4. Company Product Portfolio
11.3.5. Recent Developments
11.3.6. SWOT Analysis
11.4. DeLaval.
11.4.1. Business Overview
11.4.2. Company Snapshot
11.4.3. Company Market Share Analysis
11.4.4. Company Product Portfolio
11.4.5. Recent Developments
11.4.6. SWOT Analysis
11.5. Fullwood Packo
11.5.1. Business Overview
11.5.2. Company Snapshot
11.5.3. Company Market Share Analysis
11.5.4. Company Product Portfolio
11.5.5. Recent Developments
11.5.6. SWOT Analysis
11.6. GEA Group Aktiengesellschaft
11.6.1. Business Overview
11.6.2. Company Snapshot
11.6.3. Company Market Share Analysis
11.6.4. Company Product Portfolio
11.6.5. Recent Developments
11.6.6. SWOT Analysis
11.7. Hokofarm Group.
11.7.1. Business Overview
11.7.2. Company Snapshot
11.7.3. Company Market Share Analysis
11.7.4. Company Product Portfolio
11.7.5. Recent Developments
11.7.6. SWOT Analysis
11.8. Lely
11.8.1. Business Overview
11.8.2. Company Snapshot
11.8.3. Company Market Share Analysis
11.8.4. Company Product Portfolio
11.8.5. Recent Developments
11.8.6. SWOT Analysis
11.9. Milkwell Milking Systems
11.9.1. Business Overview
11.9.2. Company Snapshot
11.9.3. Company Market Share Analysis
11.9.4. Company Product Portfolio
11.9.5. Recent Developments
11.9.6. SWOT Analysis
11.10. Paul Mueller Company
11.10.1. Business Overview
11.10.2. Company Snapshot
11.10.3. Company Market Share Analysis
11.10.4. Company Product Portfolio
11.10.5. Recent Developments
11.10.6. SWOT Analysis
11.11. Pearson International LLC
11.11.1. Business Overview
11.11.2. Company Snapshot
11.11.3. Company Market Share Analysis
11.11.4. Company Product Portfolio
11.11.5. Recent Developments
11.11.6. SWOT Analysis
11.12. Read Industrial Ltd,
11.12.1. Business Overview
11.12.2. Company Snapshot
11.12.3. Company Market Share Analysis
11.12.4. Company Product Portfolio
11.12.5. Recent Developments
11.12.6. SWOT Analysis
11.13. Rotec Engineering Ltd
11.13.1. Business Overview
11.13.2. Company Snapshot
11.13.3. Company Market Share Analysis
11.13.4. Company Product Portfolio
11.13.5. Recent Developments
11.13.6. SWOT Analysis
11.14. S.A. Christensen & Co.
11.14.1. Business Overview
11.14.2. Company Snapshot
11.14.3. Company Market Share Analysis
11.14.4. Company Product Portfolio
11.14.5. Recent Developments
11.14.6. SWOT Analysis
11.15. Spunhill
11.15.1. Business Overview
11.15.2. Company Snapshot
11.15.3. Company Market Share Analysis
11.15.4. Company Product Portfolio
11.15.5. Recent Developments
11.15.6. SWOT Analysis
11.16. Stellapps Technologies Pvt. Ltd.
11.16.1. Business Overview
11.16.2. Company Snapshot
11.16.3. Company Market Share Analysis
11.16.4. Company Product Portfolio
11.16.5. Recent Developments
11.16.6. SWOT Analysis
11.17. System Happel.
11.17.1. Business Overview
11.17.2. Company Snapshot
11.17.3. Company Market Share Analysis
11.17.4. Company Product Portfolio
11.17.5. Recent Developments
11.17.6. SWOT Analysis
List of Table
1. Global Milking Robots Market, By Offering, 2019-2032 (USD Billion)
2. Global Software Milking Robots Market, By Region, 2019-2032 (USD Billion)
3. Global Hardware Milking Robots Market, By Region, 2019-2032 (USD Billion)
4. Global Services Milking Robots Market, By Region, 2019-2032 (USD Billion)
5. Global Milking Robots Market, By Type, 2019-2032 (USD Billion)
6. Global Single-stall Milking System Milking Robots Market, By Region, 2019-2032 (USD Billion)
7. Global Automated Milking Rotary Milking Robots Market, By Region, 2019-2032 (USD Billion)
8. Global Multi-stall Milking System Milking Robots Market, By Region, 2019-2032 (USD Billion)
9. Global Milking Robots Market, By Herd Size, 2019-2032 (USD Billion)
10. Global Less than 100 Milking Robots Market, By Region, 2019-2032 (USD Billion)
11. Global Between 100 to 1, 000 Milking Robots Market, By Region, 2019-2032 (USD Billion)
12. Global More than 1, 000 Milking Robots Market, By Region, 2019-2032 (USD Billion)
13. North America Milking Robots Market, By Offering, 2019-2032 (USD Billion)
14. North America Milking Robots Market, By Type, 2019-2032 (USD Billion)
15. North America Milking Robots Market, By Herd Size, 2019-2032 (USD Billion)
16. U.S. Milking Robots Market, By Offering, 2019-2032 (USD Billion)
17. U.S. Milking Robots Market, By Type, 2019-2032 (USD Billion)
18. U.S. Milking Robots Market, By Herd Size, 2019-2032 (USD Billion)
19. Canada Milking Robots Market, By Offering, 2019-2032 (USD Billion)
20. Canada Milking Robots Market, By Type, 2019-2032 (USD Billion)
21. Canada Milking Robots Market, By Herd Size, 2019-2032 (USD Billion)
22. Mexico Milking Robots Market, By Offering, 2019-2032 (USD Billion)
23. Mexico Milking Robots Market, By Type, 2019-2032 (USD Billion)
24. Mexico Milking Robots Market, By Herd Size, 2019-2032 (USD Billion)
25. Europe Milking Robots Market, By Offering, 2019-2032 (USD Billion)
26. Europe Milking Robots Market, By Type, 2019-2032 (USD Billion)
27. Europe Milking Robots Market, By Herd Size, 2019-2032 (USD Billion)
28. Germany Milking Robots Market, By Offering, 2019-2032 (USD Billion)
29. Germany Milking Robots Market, By Type, 2019-2032 (USD Billion)
30. Germany Milking Robots Market, By Herd Size, 2019-2032 (USD Billion)
31. France Milking Robots Market, By Offering 2019-2032 (USD Billion)
32. France Milking Robots Market, By Type, 2019-2032 (USD Billion)
33. France Milking Robots Market, By Herd Size, 2019-2032 (USD Billion)
34. U.K. Milking Robots Market, By Offering, 2019-2032 (USD Billion)
35. U.K. Milking Robots Market, By Type, 2019-2032 (USD Billion)
36. U.K. Milking Robots Market, By Herd Size, 2019-2032 (USD Billion)
37. Italy Milking Robots Market, By Offering, 2019-2032 (USD Billion)
38. Italy Milking Robots Market, By Type, 2019-2032 (USD Billion)
39. Italy Milking Robots Market, By Herd Size, 2019-2032 (USD Billion)
40. Spain Milking Robots Market, By Offering, 2019-2032 (USD Billion)
41. Spain Milking Robots Market, By Type, 2019-2032 (USD Billion)
42. Spain Milking Robots Market, By Herd Size, 2019-2032 (USD Billion)
43. Asia Pacific Milking Robots Market, By Offering, 2019-2032 (USD Billion)
44. Asia Pacific Milking Robots Market, By Type, 2019-2032 (USD Billion)
45. Asia Pacific Milking Robots Market, By Herd Size, 2019-2032 (USD Billion)
46. Japan Milking Robots Market, By Offering, 2019-2032 (USD Billion)
47. Japan Milking Robots Market, By Type, 2019-2032 (USD Billion)
48. Japan Milking Robots Market, By Herd Size, 2019-2032 (USD Billion)
49. China Milking Robots Market, By Offering 2019-2032 (USD Billion)
50. China Milking Robots Market, By Type, 2019-2032 (USD Billion)
51. China Milking Robots Market, By Herd Size, 2019-2032 (USD Billion)
52. India Milking Robots Market, By Offering 2019-2032 (USD Billion)
53. India Milking Robots Market, By Type, 2019-2032 (USD Billion)
54. India Milking Robots Market, By Herd Size, 2019-2032 (USD Billion)
55. South America Milking Robots Market, By Offering, 2019-2032 (USD Billion)
56. South America Milking Robots Market, By Type, 2019-2032 (USD Billion)
57. South America Milking Robots Market, By Herd Size, 2019-2032 (USD Billion)
58. Brazil Milking Robots Market, By Offering 2019-2032 (USD Billion)
59. Brazil Milking Robots Market, By Type, 2019-2032 (USD Billion)
60. Brazil Milking Robots Market, By Herd Size, 2019-2032 (USD Billion)
61. Middle East and Africa Milking Robots Market, By Offering, 2019-2032 (USD Billion)
62. Middle East and Africa Milking Robots Market, By Type, 2019-2032 (USD Billion)
63. Middle East and Africa Milking Robots Market, By Herd Size, 2019-2032 (USD Billion)
64. UAE Milking Robots Market, By Offering, 2019-2032 (USD Billion)
65. UAE Milking Robots Market, By Type, 2019-2032 (USD Billion)
66. UAE Milking Robots Market, By Herd Size, 2019-2032 (USD Billion)
67. South Africa Milking Robots Market, By Offering 2019-2032 (USD Billion)
68. South Africa Milking Robots Market, By Type, 2019-2032 (USD Billion)
69. South Africa Milking Robots Market, By Herd Size, 2019-2032 (USD Billion)
List of Figures
1. Global Milking Robots Market Segmentation
2. Milking Robots Market: Research Methodology
3. Market Size Estimation Methodology: Bottom-Up Approach
4. Market Size Estimation Methodology: Top-Down Approach
5. Data Triangulation
6. Porter’s Five Forces Analysis
7. Value Chain Analysis
8. Global Milking Robots Market Attractiveness Analysis by Offering
9. Global Milking Robots Market Attractiveness Analysis by Type
10. Global Milking Robots Market Attractiveness Analysis by Herd Size
11. Global Milking Robots Market Attractiveness Analysis by Region
12. Global Milking Robots Market: Dynamics
13. Global Milking Robots Market Share by Offering (2022 & 2032)
14. Global Milking Robots Market Share by Type (2022 & 2032)
15. Global Milking Robots Market Share by Herd Size (2022 & 2032)
16. Global Milking Robots Market Share by Regions (2022 & 2032)
17. Global Milking Robots Market Share by Company (2022)
This study forecasts revenue at global, regional, and country levels from 2019 to 2032. The Brainy Insights has segmented the global milking robots market based on below mentioned segments:
Global Milking Robots Market Offering:
Global Milking Robots Market Type:
Global Milking Robots Market Herd Size:
Global Milking Robots Market by Region:
Research has its special purpose to undertake marketing efficiently. In this competitive scenario, businesses need information across all industry verticals; the information about customer wants, market demand, competition, industry trends, distribution channels etc. This information needs to be updated regularly because businesses operate in a dynamic environment. Our organization, The Brainy Insights incorporates scientific and systematic research procedures in order to get proper market insights and industry analysis for overall business success. The analysis consists of studying the market from a miniscule level wherein we implement statistical tools which helps us in examining the data with accuracy and precision.
Our research reports feature both; quantitative and qualitative aspects for any market. Qualitative information for any market research process are fundamental because they reveal the customer needs and wants, usage and consumption for any product/service related to a specific industry. This in turn aids the marketers/investors in knowing certain perceptions of the customers. Qualitative research can enlighten about the different product concepts and designs along with unique service offering that in turn, helps define marketing problems and generate opportunities. On the other hand, quantitative research engages with the data collection process through interviews, e-mail interactions, surveys and pilot studies. Quantitative aspects for the market research are useful to validate the hypotheses generated during qualitative research method, explore empirical patterns in the data with the help of statistical tools, and finally make the market estimations.
The Brainy Insights offers comprehensive research and analysis, based on a wide assortment of factual insights gained through interviews with CXOs and global experts and secondary data from reliable sources. Our analysts and industry specialist assume vital roles in building up statistical tools and analysis models, which are used to analyse the data and arrive at accurate insights with exceedingly informative research discoveries. The data provided by our organization have proven precious to a diverse range of companies, facilitating them to address issues such as determining which products/services are the most appealing, whether or not customers use the product in the manner anticipated, the purchasing intentions of the market and many others.
Our research methodology encompasses an idyllic combination of primary and secondary initiatives. Key phases involved in this process are listed below:

The phase involves the gathering and collecting of market data and its related information with the help of different sources & research procedures.

The data procurement stage involves in data gathering and collecting through various data sources.
This stage involves in extensive research. These data sources includes:
Purchased Database: Purchased databases play a crucial role in estimating the market sizes irrespective of the domain. Our purchased database includes:
Primary Research: The Brainy Insights interacts with leading companies and experts of the concerned domain to develop the analyst team’s market understanding and expertise. It improves and substantiates every single data presented in the market reports. Primary research mainly involves in telephonic interviews, E-mail interactions and face-to-face interviews with the raw material providers, manufacturers/producers, distributors, & independent consultants. The interviews that we conduct provides valuable data on market size and industry growth trends prevailing in the market. Our organization also conducts surveys with the various industry experts in order to gain overall insights of the industry/market. For instance, in healthcare industry we conduct surveys with the pharmacists, doctors, surgeons and nurses in order to gain insights and key information of a medical product/device/equipment which the customers are going to usage. Surveys are conducted in the form of questionnaire designed by our own analyst team. Surveys plays an important role in primary research because surveys helps us to identify the key target audiences of the market. Additionally, surveys helps to identify the key target audience engaged with the market. Our survey team conducts the survey by targeting the key audience, thus gaining insights from them. Based on the perspectives of the customers, this information is utilized to formulate market strategies. Moreover, market surveys helps us to understand the current competitive situation of the industry. To be precise, our survey process typically involve with the 360 analysis of the market. This analytical process begins by identifying the prospective customers for a product or service related to the market/industry to obtain data on how a product/service could fit into customers’ lives.

Secondary Research: The secondary data sources includes information published by the on-profit organizations such as World bank, WHO, company fillings, investor presentations, annual reports, national government documents, statistical databases, blogs, articles, white papers and others. From the annual report, we analyse a company’s revenue to understand the key segment and market share of that organization in a particular region. We analyse the company websites and adopt the product mapping technique which is important for deriving the segment revenue. In the product mapping method, we select and categorize the products offered by the companies catering to domain specific market, deduce the product revenue for each of the companies so as to get overall estimation of the market size. We also source data and analyses trends based on information received from supply side and demand side intermediaries in the value chain. The supply side denotes the data gathered from supplier, distributor, wholesaler and the demand side illustrates the data gathered from the end customers for respective market domain.

The supply side for a domain specific market is analysed by:
The demand side for the market is estimated through:
In-house Library: Apart from these third-party sources, we have our in-house library of qualitative and quantitative information. Our in-house database includes market data for various industry and domains. These data are updated on regular basis as per the changing market scenario. Our library includes, historic databases, internal audit reports and archives.
Sometimes there are instances where there is no metadata or raw data available for any domain specific market. For those cases, we use our expertise to forecast and estimate the market size in order to generate comprehensive data sets. Our analyst team adopt a robust research technique in order to produce the estimates:
Data Synthesis: This stage involves the analysis & mapping of all the information obtained from the previous step. It also involves in scrutinizing the data for any discrepancy observed while data gathering related to the market. The data is collected with consideration to the heterogeneity of sources. Robust scientific techniques are in place for synthesizing disparate data sets and provide the essential contextual information that can orient market strategies. The Brainy Insights has extensive experience in data synthesis where the data passes through various stages:


Market Deduction & Formulation: The final stage comprises of assigning data points at appropriate market spaces so as to deduce feasible conclusions. Analyst perspective & subject matter expert based holistic form of market sizing coupled with industry analysis also plays a crucial role in this stage.
This stage involves in finalization of the market size and numbers that we have collected from data integration step. With data interpolation, it is made sure that there is no gap in the market data. Successful trend analysis is done by our analysts using extrapolation techniques, which provide the best possible forecasts for the market.
Data Validation & Market Feedback: Validation is the most important step in the process. Validation & re-validation via an intricately designed process helps us finalize data-points to be used for final calculations.

The Brainy Insights interacts with leading companies and experts of the concerned domain to develop the analyst team’s market understanding and expertise. It improves and substantiates every single data presented in the market reports. The data validation interview and discussion panels are typically composed of the most experienced industry members. The participants include, however, are not limited to:
Moreover, we always validate our data and findings through primary respondents from all the major regions we are working on.


Free Customization
Fortune 500 Clients
Free Yearly Update On Purchase Of Multi/Corporate License
Companies Served Till Date