- +1-315-215-1633
- sales@thebrainyinsights.com

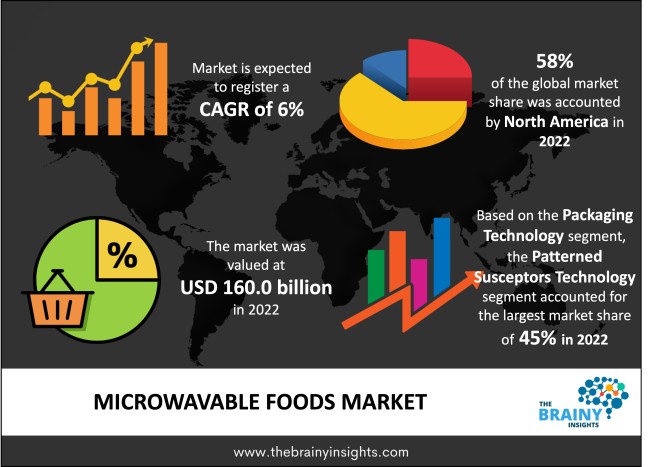
The global microwavable foods market was valued at USD 160.0 Billion in 2022, growing at a CAGR of 6% from 2023 to 2032. The market is expected to reach USD 286.5 Billion by 2032. Many market trends have evolved due to urbanization and a faster-paced lifestyle. Everyone wants to get more done in less time in today's fast-paced environment.
Individuals' fast-paced lifestyles have compelled them to seek convenient options such as microwavable dishes to replace conventional cooked meals. Microwavable dishes require little preparation and may be prepared in a standard microwave oven. Shelf stable, chilled and frozen meals (beef, pig, chicken, seafood, vegetarian meals, frozen & chilled pizza), and soups are included. These meals are considered nutritious because no extra fat is used in their preparation. The rise in demand for convenience is the primary driver of the microwavable meals business. Other reasons such as the increase in the number of nuclear families, the increase in the number of women working outside the home, the surge in disposable money, the improvement in the standard of life, and the quick expansion in the number of large retail chains all contribute to the market's growth. The growing popularity of fast food restaurants, often known as quick service restaurants (QSRs), drives the global microwavable foods market. Because of their vast population bases and expansion in the number of QSRs such as Mcdonald's, Burger King, Wendy's, Subway, and Dunkin' Donuts, China, India, and Brazil dominate regarding microwavable food consumption among emerging nations. The business of QSR chains in India is predicted to grow eightfold as disposable income rises and urbanization accelerates, leading to increased consumption of microwavable items. As a result, fast food restaurants' increasing popularity is likely to create a significant opportunity for manufacturers of microwavable items.
Get an overview of this study by requesting a free sample
In April 2020, Rich Products Corporation will launch 'Time Outs,' microwavable single-serve snacks. The frozen product assortment includes snacks, appetizers, and dinners made with plant-based meat and components.
In April 2020, Starkist introduced microwavable tuna with grains and veggies, which tastes excellent and can be served at room temperature for lunch, supper, or a healthy snack.
Rising Customer Desire- The growing customer desire for convenience foods indirectly supports the growing demand for microwavable foods because they need less time and effort to prepare than cooking from scratch. The hurried lifestyles of consumers have raised the demand for processed foods. As a result, demand for microwavable goods is increasing. Because it boosts consumer purchasing power, increased disposable income considerably impacts the expansion of the microwavable food sector.
Slow Growth Rate- The growing preference for fresh and natural food products, as well as the growing need for constant temperature monitoring, are expected to slow the growth rate of the microwavable foods market during the forecast period, while a lack of cold chain infrastructure in developing economies will pose a market challenge for microwavable foods.
Unexpected Breakdown- The unexpected breakdown of COVID-19 has significantly increased demand for microwavable foods, which have the advantage of retaining nutrition for a longer period of time and having a longer shelf life than other fresh fruits, vegetables, and meat, which are also expected to fuel market growth. Additionally, expanding retail digitalization and quickly rising processed food trade will open up new prospects for the microwavable foods market during the forecast period.
The regions analyzed for the market include North America, Europe, South America, Asia Pacific, the Middle East, and Africa. North America emerged as the largest global microwavable foods market, with a 58% market revenue share in 2022.
North America holds the greatest share of the global microwavable foods market because of the region's high desire for novel food solutions and simpler preparation techniques. The growing trend of processed RTE food products will add to the regional market's growth in the next years. Furthermore, due to the region's strong leadership in the food and beverage sector, various startups and large organizations are investing in establishing restaurants in the region, which will positively influence the growth of the regional market in the next years.
North America Region Microwavable Foods Market Share in 2022 - 58%
www.thebrainyinsights.com
Check the geographical analysis of this market by requesting a free sample
The product segment is divided into shelf stable microwavable food, chilled food, and microwavable food. The chilled food segment dominated the market, with a market share of around 39% in 2022. Due to the increased demand from the consumers. Consumers always choose healthier, easier-to-cook, and easier-to-digest meals, which are satisfied by frozen microwavable foods. Freezing the food can help to preserve its key components.
The packaging technology segment is divided into patterned susceptors technology, new tray-lidding methods, and new cook bag technique. The patterned susceptors technology segment dominated the market, with a market share of around 45% in 2022. The invention of patterned susceptor technology has resulted in a significant breakthrough in microwavable food packaging technology. Using a susceptor in microwavable food packaging allows the food to attain a high temperature, boosting crunchiness and browning it further.
| Attribute | Description |
|---|---|
| Market Size | Revenue (USD Billion) |
| Market size value in 2022 | USD 160.0 Billion |
| Market size value in 2032 | USD 286.5 Billion |
| CAGR (2023 to 2032) | 6% |
| Historical data | 2019-2021 |
| Base Year | 2022 |
| Forecast | 2023-2032 |
| Region | The regions analyzed for the market are Asia Pacific, Europe, South America, North America, and Middle East & Africa. Furthermore, the regions are further analyzed at the country level. |
| Segments | Product, Packaging Technology |
As per The Brainy Insights, the size of the microwavable foods market was valued at USD 160.0 billion in 2022 to USD 286.5 billion by 2032.
The global microwavable foods market is growing at a CAGR of 6% during the forecast period 2023-2032.
North America emerged as the largest microwavable foods market.
1. Introduction
1.1. Objectives of the Study
1.2. Market Definition
1.3. Research Scope
1.4. Currency
1.5. Key Target Audience
2. Research Methodology and Assumptions
3. Executive Summary
4. Premium Insights
4.1. Porter’s Five Forces Analysis
4.2. Value Chain Analysis
4.3. Top Investment Pockets
4.3.1. Market Attractiveness Analysis by Product
4.3.2. Market Attractiveness Analysis by Packaging Technology
4.3.3. Market Attractiveness Analysis by Region
4.4. Industry Trends
5. Market Dynamics
5.1. Market Evaluation
5.2. Drivers
5.2.1. Rising customer desire
5.3. Restraints
5.3.1. Slow growth rate
5.4. Opportunities
5.4.1. Unexpected breakdown
5.5. Challenges
5.5.1. Lack of specialists
6. Global Microwavable Foods Market Analysis and Forecast, By Product
6.1. Segment Overview
6.2. Shelf Stable Microwavable Food
6.3. Chilled Food
6.4. Microwavable Food
7. Global Microwavable Foods Market Analysis and Forecast, By Packaging Technology
7.1. Segment Overview
7.2. Patterned Susceptors Technology
7.3. New Tray-lidding Methods
7.4. New Cook Bag Technique
8. Global Microwavable Foods Market Analysis and Forecast, By Regional Analysis
8.1. Segment Overview
8.2. North America
8.2.1. U.S.
8.2.2. Canada
8.2.3. Mexico
8.3. Europe
8.3.1. Germany
8.3.2. France
8.3.3. U.K.
8.3.4. Italy
8.3.5. Spain
8.4. Asia-Pacific
8.4.1. Japan
8.4.2. China
8.4.3. India
8.5. South America
8.5.1. Brazil
8.6. Middle East and Africa
8.6.1. UAE
8.6.2. South Africa
9. Global Microwavable Foods Market-Competitive Landscape
9.1. Overview
9.2. Market Share of Key Players in Global Microwavable Foods Market
9.2.1. Global Company Market Share
9.2.2. North America Company Market Share
9.2.3. Europe Company Market Share
9.2.4. APAC Company Market Share
9.3. Competitive Situations and Trends
9.3.1. Product Launches and Developments
9.3.2. Partnerships, Collaborations, and Agreements
9.3.3. Mergers & Acquisitions
9.3.4. Expansions
10. Company Profiles
10.1. Pinnacle Foods Group LLC
10.1.1. Business Overview
10.1.2. Company Snapshot
10.1.3. Company Market Share Analysis
10.1.4. Company Product Portfolio
10.1.5. Recent Developments
10.1.6. SWOT Analysis
10.2. Bellisio Foods Inc.
10.2.1. Business Overview
10.2.2. Company Snapshot
10.2.3. Company Market Share Analysis
10.2.4. Company Product Portfolio
10.2.5. Recent Developments
10.2.6. SWOT Analysis
10.3. Beech-Nut Nutrition Corporation
10.3.1. Business Overview
10.3.2. Company Snapshot
10.3.3. Company Market Share Analysis
10.3.4. Company Product Portfolio
10.3.5. Recent Developments
10.3.6. SWOT Analysis
10.4. Campbell Soup Company
10.4.1. Business Overview
10.4.2. Company Snapshot
10.4.3. Company Market Share Analysis
10.4.4. Company Product Portfolio
10.4.5. Recent Developments
10.4.6. SWOT Analysis
10.5. Unilever Plc
10.5.1. Business Overview
10.5.2. Company Snapshot
10.5.3. Company Market Share Analysis
10.5.4. Company Product Portfolio
10.5.5. Recent Developments
10.5.6. SWOT Analysis
10.6. ConAgra Foods, Inc.
10.6.1. Business Overview
10.6.2. Company Snapshot
10.6.3. Company Market Share Analysis
10.6.4. Company Product Portfolio
10.6.5. Recent Developments
10.6.6. SWOT Analysis
10.7. General Mills Inc.
10.7.1. Business Overview
10.7.2. Company Snapshot
10.7.3. Company Market Share Analysis
10.7.4. Company Product Portfolio
10.7.5. Recent Developments
10.7.6. SWOT Analysis
10.8. Ajinomoto Windsor, Inc.
10.8.1. Business Overview
10.8.2. Company Snapshot
10.8.3. Company Market Share Analysis
10.8.4. Company Product Portfolio
10.8.5. Recent Developments
10.8.6. SWOT Analysis
10.9. Kellogg Company
10.9.1. Business Overview
10.9.2. Company Snapshot
10.9.3. Company Market Share Analysis
10.9.4. Company Product Portfolio
10.9.5. Recent Developments
10.9.6. SWOT Analysis
10.10. Nestle SA
10.10.1. Business Overview
10.10.2. Company Snapshot
10.10.3. Company Market Share Analysis
10.10.4. Company Product Portfolio
10.10.5. Recent Developments
10.10.6. SWOT Analysis
10.11. Pinnacle Food Inc.
10.11.1. Business Overview
10.11.2. Company Snapshot
10.11.3. Company Market Share Analysis
10.11.4. Company Product Portfolio
10.11.5. Recent Developments
10.11.6. SWOT Analysis
10.12. The Kraft Heinz Company
10.12.1. Business Overview
10.12.2. Company Snapshot
10.12.3. Company Market Share Analysis
10.12.4. Company Product Portfolio
10.12.5. Recent Developments
10.12.6. SWOT Analysis
10.13. McCain Foods
10.13.1. Business Overview
10.13.2. Company Snapshot
10.13.3. Company Market Share Analysis
10.13.4. Company Product Portfolio
10.13.5. Recent Developments
10.13.6. SWOT Analysis
List of Table
1. Global Microwavable Foods Market, By Product, 2019-2032 (USD Million)
2. Global Shelf Stable Microwavable Food, Microwavable Foods Market, By Region, 2019-2032 (USD Million)
3. Global Chilled Food, Microwavable Foods Market, By Region, 2019-2032 (USD Million)
4. Global Microwavable Food, Microwavable Foods Market, By Region, 2019-2032 (USD Million)
5. Global Microwavable Foods Market, By Packaging Technology, 2019-2032 (USD Million)
6. Global Patterned Susceptors Technology, Microwavable Foods Market, By Region, 2019-2032 (USD Million)
7. Global New Tray-lidding Methods, Microwavable Foods Market, By Region, 2019-2032 (USD Million)
8. Global New Cook Bag Technique, Microwavable Foods Market, By Region, 2019-2032 (USD Million)
9. North America Microwavable Foods Market, By Product, 2019-2032 (USD Million)
10. North America Microwavable Foods Market, By Packaging Technology, 2019-2032 (USD Million)
11. U.S. Microwavable Foods Market, By Product, 2019-2032 (USD Million)
12. U.S. Microwavable Foods Market, By Packaging Technology, 2019-2032 (USD Million)
13. Canada Microwavable Foods Market, By Product, 2019-2032 (USD Million)
14. Canada Microwavable Foods Market, By Packaging Technology, 2019-2032 (USD Million)
15. Mexico Microwavable Foods Market, By Product, 2019-2032 (USD Million)
16. Mexico Microwavable Foods Market, By Packaging Technology, 2019-2032 (USD Million)
17. Europe Microwavable Foods Market, By Product, 2019-2032 (USD Million)
18. Europe Microwavable Foods Market, By Packaging Technology, 2019-2032 (USD Million)
19. Germany Microwavable Foods Market, By Product, 2019-2032 (USD Million)
20. Germany Microwavable Foods Market, By Packaging Technology, 2019-2032 (USD Million)
21. France Microwavable Foods Market, By Product, 2019-2032 (USD Million)
22. France Microwavable Foods Market, By Packaging Technology, 2019-2032 (USD Million)
23. U.K. Microwavable Foods Market, By Product, 2019-2032 (USD Million)
24. U.K. Microwavable Foods Market, By Packaging Technology, 2019-2032 (USD Million)
25. Italy Microwavable Foods Market, By Product, 2019-2032 (USD Million)
26. Italy Microwavable Foods Market, By Packaging Technology, 2019-2032 (USD Million)
27. Spain Microwavable Foods Market, By Product, 2019-2032 (USD Million)
28. Spain Microwavable Foods Market, By Packaging Technology, 2019-2032 (USD Million)
29. Asia Pacific Microwavable Foods Market, By Product, 2019-2032 (USD Million)
30. Asia Pacific Microwavable Foods Market, By Packaging Technology, 2019-2032 (USD Million)
31. Japan Microwavable Foods Market, By Product, 2019-2032 (USD Million)
32. Japan Microwavable Foods Market, By Packaging Technology, 2019-2032 (USD Million)
33. China Microwavable Foods Market, By Product, 2019-2032 (USD Million)
34. China Microwavable Foods Market, By Packaging Technology, 2019-2032 (USD Million)
35. India Microwavable Foods Market, By Product, 2019-2032 (USD Million)
36. India Microwavable Foods Market, By Packaging Technology, 2019-2032 (USD Million)
37. South America Microwavable Foods Market, By Product, 2019-2032 (USD Million)
38. South America Microwavable Foods Market, By Packaging Technology, 2019-2032 (USD Million)
39. Brazil Microwavable Foods Market, By Product, 2019-2032 (USD Million)
40. Brazil Microwavable Foods Market, By Packaging Technology, 2019-2032 (USD Million)
41. Middle East and Africa Microwavable Foods Market, By Product, 2019-2032 (USD Million)
42. Middle East and Africa Microwavable Foods Market, By Packaging Technology, 2019-2032 (USD Million)
43. UAE Microwavable Foods Market, By Product, 2019-2032 (USD Million)
44. UAE Microwavable Foods Market, By Packaging Technology, 2019-2032 (USD Million)
45. South Africa Microwavable Foods Market, By Product, 2019-2032 (USD Million)
46. South Africa Microwavable Foods Market, By Packaging Technology, 2019-2032 (USD Million)
List of Figures
1. Global Microwavable Foods Market Segmentation
2. Global Microwavable Foods Market: Research Methodology
3. Market Size Estimation Methodology: Bottom-Up Approach
4. Market Size Estimation Methodology: Top-Down Approach
5. Data Triangulation
6. Porter’s Five Forces Analysis
7. Value Chain Analysis
8. Global Microwavable Foods Market Attractiveness Analysis by Product
9. Global Microwavable Foods Market Attractiveness Analysis by Packaging Technology
10. Global Microwavable Foods Market Attractiveness Analysis by Region
11. Global Microwavable Foods Market: Dynamics
12. Global Microwavable Foods Market Share by Product (2023 & 2032)
13. Global Microwavable Foods Market Share by Packaging Technology (2023 & 2032)
14. Global Microwavable Foods Market Share by Regions (2023 & 2032)
15. Global Microwavable Foods Market Share by Company (2022)
This study forecasts global, regional, and country revenue from 2019 to 2032. The Brainy Insights has segmented the global microwavable foods market based on the below-mentioned segments:
Global Microwavable Foods Market By Product:
Global Microwavable Foods Market By Packaging Technology:
Global Microwavable Foods Market By Region:
Research has its special purpose to undertake marketing efficiently. In this competitive scenario, businesses need information across all industry verticals; the information about customer wants, market demand, competition, industry trends, distribution channels etc. This information needs to be updated regularly because businesses operate in a dynamic environment. Our organization, The Brainy Insights incorporates scientific and systematic research procedures in order to get proper market insights and industry analysis for overall business success. The analysis consists of studying the market from a miniscule level wherein we implement statistical tools which helps us in examining the data with accuracy and precision.
Our research reports feature both; quantitative and qualitative aspects for any market. Qualitative information for any market research process are fundamental because they reveal the customer needs and wants, usage and consumption for any product/service related to a specific industry. This in turn aids the marketers/investors in knowing certain perceptions of the customers. Qualitative research can enlighten about the different product concepts and designs along with unique service offering that in turn, helps define marketing problems and generate opportunities. On the other hand, quantitative research engages with the data collection process through interviews, e-mail interactions, surveys and pilot studies. Quantitative aspects for the market research are useful to validate the hypotheses generated during qualitative research method, explore empirical patterns in the data with the help of statistical tools, and finally make the market estimations.
The Brainy Insights offers comprehensive research and analysis, based on a wide assortment of factual insights gained through interviews with CXOs and global experts and secondary data from reliable sources. Our analysts and industry specialist assume vital roles in building up statistical tools and analysis models, which are used to analyse the data and arrive at accurate insights with exceedingly informative research discoveries. The data provided by our organization have proven precious to a diverse range of companies, facilitating them to address issues such as determining which products/services are the most appealing, whether or not customers use the product in the manner anticipated, the purchasing intentions of the market and many others.
Our research methodology encompasses an idyllic combination of primary and secondary initiatives. Key phases involved in this process are listed below:

The phase involves the gathering and collecting of market data and its related information with the help of different sources & research procedures.

The data procurement stage involves in data gathering and collecting through various data sources.
This stage involves in extensive research. These data sources includes:
Purchased Database: Purchased databases play a crucial role in estimating the market sizes irrespective of the domain. Our purchased database includes:
Primary Research: The Brainy Insights interacts with leading companies and experts of the concerned domain to develop the analyst team’s market understanding and expertise. It improves and substantiates every single data presented in the market reports. Primary research mainly involves in telephonic interviews, E-mail interactions and face-to-face interviews with the raw material providers, manufacturers/producers, distributors, & independent consultants. The interviews that we conduct provides valuable data on market size and industry growth trends prevailing in the market. Our organization also conducts surveys with the various industry experts in order to gain overall insights of the industry/market. For instance, in healthcare industry we conduct surveys with the pharmacists, doctors, surgeons and nurses in order to gain insights and key information of a medical product/device/equipment which the customers are going to usage. Surveys are conducted in the form of questionnaire designed by our own analyst team. Surveys plays an important role in primary research because surveys helps us to identify the key target audiences of the market. Additionally, surveys helps to identify the key target audience engaged with the market. Our survey team conducts the survey by targeting the key audience, thus gaining insights from them. Based on the perspectives of the customers, this information is utilized to formulate market strategies. Moreover, market surveys helps us to understand the current competitive situation of the industry. To be precise, our survey process typically involve with the 360 analysis of the market. This analytical process begins by identifying the prospective customers for a product or service related to the market/industry to obtain data on how a product/service could fit into customers’ lives.

Secondary Research: The secondary data sources includes information published by the on-profit organizations such as World bank, WHO, company fillings, investor presentations, annual reports, national government documents, statistical databases, blogs, articles, white papers and others. From the annual report, we analyse a company’s revenue to understand the key segment and market share of that organization in a particular region. We analyse the company websites and adopt the product mapping technique which is important for deriving the segment revenue. In the product mapping method, we select and categorize the products offered by the companies catering to domain specific market, deduce the product revenue for each of the companies so as to get overall estimation of the market size. We also source data and analyses trends based on information received from supply side and demand side intermediaries in the value chain. The supply side denotes the data gathered from supplier, distributor, wholesaler and the demand side illustrates the data gathered from the end customers for respective market domain.

The supply side for a domain specific market is analysed by:
The demand side for the market is estimated through:
In-house Library: Apart from these third-party sources, we have our in-house library of qualitative and quantitative information. Our in-house database includes market data for various industry and domains. These data are updated on regular basis as per the changing market scenario. Our library includes, historic databases, internal audit reports and archives.
Sometimes there are instances where there is no metadata or raw data available for any domain specific market. For those cases, we use our expertise to forecast and estimate the market size in order to generate comprehensive data sets. Our analyst team adopt a robust research technique in order to produce the estimates:
Data Synthesis: This stage involves the analysis & mapping of all the information obtained from the previous step. It also involves in scrutinizing the data for any discrepancy observed while data gathering related to the market. The data is collected with consideration to the heterogeneity of sources. Robust scientific techniques are in place for synthesizing disparate data sets and provide the essential contextual information that can orient market strategies. The Brainy Insights has extensive experience in data synthesis where the data passes through various stages:


Market Deduction & Formulation: The final stage comprises of assigning data points at appropriate market spaces so as to deduce feasible conclusions. Analyst perspective & subject matter expert based holistic form of market sizing coupled with industry analysis also plays a crucial role in this stage.
This stage involves in finalization of the market size and numbers that we have collected from data integration step. With data interpolation, it is made sure that there is no gap in the market data. Successful trend analysis is done by our analysts using extrapolation techniques, which provide the best possible forecasts for the market.
Data Validation & Market Feedback: Validation is the most important step in the process. Validation & re-validation via an intricately designed process helps us finalize data-points to be used for final calculations.

The Brainy Insights interacts with leading companies and experts of the concerned domain to develop the analyst team’s market understanding and expertise. It improves and substantiates every single data presented in the market reports. The data validation interview and discussion panels are typically composed of the most experienced industry members. The participants include, however, are not limited to:
Moreover, we always validate our data and findings through primary respondents from all the major regions we are working on.


Free Customization
Fortune 500 Clients
Free Yearly Update On Purchase Of Multi/Corporate License
Companies Served Till Date