- +1-315-215-1633
- sales@thebrainyinsights.com

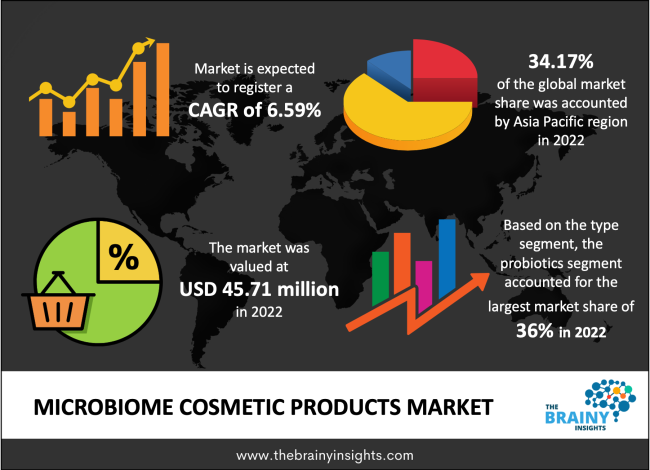
The global microbiome cosmetic products market was valued at USD 45.71 million in 2022 and growing at a CAGR of 6.59% from 2022 to 2030. The market is expected to reach USD 76.16 million by 2030. Microbiome cosmetic products are cosmetic products that promote a healthy skin microbiome. The primary growth drivers concentrate on healthy ageing, the need for licensed products, and the increasing need for natural ingredients in the cosmetic industry. Regardless, premium cost of products and efficacy problems are formed to restrain the market growth of microbiome cosmetic products. However, creating the proper retail industry in developing countries is anticipated to form lucrative growth prospects for players operating in the microbiome cosmetic products market throughout the projection years.
Same as the gut, the skin has a distinctive ecosystem consisting of millions of fungi, viruses, and bacteria that make up the skin microbiota. The health advantages of maintaining balance in the gut microbiome are long known. Regardless, regarding skincare, bacteria are usually perceived as ought to be removed. The skin microbiome is highly considered the primary element for improving skin appearance by handling the reasons for skin conditions instead of just the symptoms. The popularity of the microbiome concept began gaining traction in 2012, when the Human Microbiome Project (HMP) was finished, transforming the understanding of the body’s microbial ecology. The skin microbiome has become an essential focus in the dermatological and cosmetic domains over the past decade. Understanding the microbiota's and microbiome's role in supporting its delicate balance is essential to understanding the mechanisms responsible for maintaining the skin in good condition. Fighting with invisible microbes for over a century, seeing them as 'bad'. Now, it's time to see them as vital for well-being. Several brands and products already concentrate on microbiome modulation to enhance skin health. Research has shown the advantage of using ingredients that provide healthy bacteria ('prebiotics') and digested components of bacteria ('postbiotics) in skin care. However, postbiotics and prebiotics can be, and are already, utilized and worked as cosmetic ingredients in the form as they are non-viable. Probiotics, when used as cosmetic ingredients, target to protect the skin from external influences and nourish healthy bacteria to affect skin pH or hydration. Accordingly, in the absence of cosmetic policy around probiotics, live organisms can, for now, be assumed classical cosmetic ingredients falling under the same category.
Get an overview of this study by requesting a free sample
In June 2021: Theaprilab, a South Korean startup, debuted in the Southeast Asian market of Philippians, Singapore, and Malaysia with three probiotic cosmetic products.
In January 2021, Lallemand bought Biotec BetaGlucans AS from ArticZymes Technologies ASA. The investment contains a specialized food-grade and pharma-certified production plant in Tromso, Northern Norway, with a professional team. Under the terms of the contract, Lallemand will acquire all of the BBG assets and associated intellectual property. The investment in the Biotec BetaGlucans business broadened Lallemand's beta-glucans product portfolio, and their access to leading technologies within yeast-based ingredients significantly benefits Adalia's extensive customer network.
The Growing Female Workforce Boost the Market- The working population usually show a higher likelihood of spending on cosmetics such as organic and natural skin care & personal care products present in the market. Similarly, increasing income leads to probiotic cosmetic products more reasonable to a considerable population. Therefore, growing the workforce will be an essential element in pushing the market. Besides understanding feasible skincare among female workers, a higher priority on personal appearance will favor probiotics cosmetics sales. Regardless, the need for anti-acne products anti-pollution, and anti-ageing, will grow, supporting the growth of the microbiome cosmetics products market.
Products High Costing - The microbiome cosmetic products market is in developing phase. It has shown high capital investments in R&D, and less raw materials suppliers. The initial phase of the products provokes the high cost of microbiome cosmetic products corresponding to traditional products. Similarly, improved competitiveness and a shortage of products from prominent cosmetic firms have led to the great attention of SME players working in the market. However, some significant players are penetrating the market, the increased research costing and lower customer awareness have affected the microbiome cosmetic products market development. Investments from important players are predicted to drop the price during the long-run prediction; similarly, the acceptance rate is foreseen to be low due to the premium pricing of the products, thereby limiting the growth of the global microbiome cosmetic products market.
Technological Advancements- Technological improvements in the cosmetic and pharmaceutical industries, increased majority of skin problems like psoriasis, eczema, and acne, growing choice for personal care, growing demand for organic skin care products, increasing research and development steps to produce microbiome-based skincare products, and an ageing population are all contributing factors which are predicted to propel market growth in the future years.
The regions analyzed for the market include North America, Europe, South America, Asia Pacific, the Middle East, and Africa. Asia-Pacific emerged as the largest market for the global microbiome cosmetic products market, with a 34.17% share of the market revenue in 2022.
The Asia-Pacific market is assessed to develop fast, with the vast population and rising customer spending on beauty products will increase regional industry development. Numerous brands with different product portfolios are another essential win factor pushing product penetration. South Korea, India, and China are substantial revenue-generating nations due to their high per capita spending on personal care products. However, North America will expect high gains up to 2030. Increased spending on skincare products and growing sales of products enhanced with postbiotics and prebiotics will push product adoption in this region. Similarly, the existence of numerous products to target diverse skin issues will influence market growth.
Asia Pacific region Microbiome Cosmetic Products Market Share in 2022 - 34.17%
www.thebrainyinsights.com
Check the geographical analysis of this market by requesting a free sample
The type segment is divided into prebiotics, postbiotics and probiotics. The probiotics segment dominated the market, with a market share of around 36% in 2022. Consumers spend a lot of money on skincare products each year. Regardless, chemical-based products are only prepared for some skin types, which directs to different skin concerns. As a result, including prebiotics, postbiotics, and probiotics skincare products is a suitable option for a long-term skincare routine. The products are more safe, natural, and soft on the skin. Probiotics are the most broadly used compounds in the market and are expected to dominate the segment's growth.
The application segment is divided into serum, creams & moisturizer, toner, oil, mist, and others. The creams and moisturizers segment dominated the market, with a market share of around 18% in 2022. Creams and moisturizers show the largest market share during the projection time. Extensive product availability, blended with perfect usefulness for most skincare reasons related to hormones and ageing, will propel the market need. Demand is rising due to advanced knowledge, easy availability, and the possibility of treating minor skin-related conditions.
The distribution channel segment is divided into specialty stores, exclusive brand store, hypermarket/supermarket, online, and others. The online segment dominated the market, with a market share of around 25% in 2022. Transforming customer buying patterns and growing dependence on online sales platforms are the primary reasons to push sales through the online mode. Another vital factor is the aftereffects of coronavirus. Now, customers are more comfortable and willing to purchase products through online sales channels.
| Attribute | Description |
|---|---|
| Market Size | Revenue (USD Million) |
| Market size value in 2022 | USD 45.71 Million |
| Market size value in 2030 | USD 76.16 Million |
| CAGR (2022 to 2030) | 6.59% |
| Historical data | 2019-2020 |
| Base Year | 2021 |
| Forecast | 2022-2030 |
| Segments | Type, Application, Distribution Channel |
| Regional Segments | The regions analyzed for the market are North America, Asia Pacific, Europe, South America, and Middle East & Africa. Furthermore, the regions are further analyzed at the country level. |
As per The Brainy Insights, the size of the microbiome cosmetic products market was valued at USD 45.71 million in 2021 to USD 76.16 million by 2030.
Global microbiome cosmetic products market is growing at a CAGR of 6.59% during the forecast period 2022-2030.
Asia Pacific region emerged as the largest market for the microbiome cosmetic products market.
The growing female workforce boost the market to propel market growth.
1. Introduction
1.1. Objectives of the Study
1.2. Market Definition
1.3. Research Scope
1.4. Currency
1.5. Key Target Audience
2. Research Methodology and Assumptions
3. Executive Summary
4. Premium Insights
4.1. Porter’s Five Forces Analysis
4.2. Value Chain Analysis
4.3. Top Investment Pockets
4.3.1. Market Attractiveness Analysis by Type
4.3.2. Market Attractiveness Analysis by Application
4.3.3. Market Attractiveness Analysis by Distribution Channel
4.3.4. Market Attractiveness Analysis by Region
4.4. Industry Trends
5. Market Dynamics
5.1. Market Evaluation
5.2. Drivers
5.2.1. The growing female workforce boost the market
5.3. Restraints
5.3.1. Products high costing to restrict the market
5.4. Opportunities
5.4.1. Technological advancements to promote the market growth
6. Global Microbiome Cosmetic Products Market Analysis and Forecast, By Type:
6.1. Segment Overview
6.2. Prebiotics
6.3. Postbiotics
6.4. Probiotics
7. Global Microbiome Cosmetic Products Market Analysis and Forecast, By Application
7.1. Segment Overview
7.2. Serum
7.3. Creams & Moisturizer
7.4. Toner
7.5. Oil
7.6. Mist
7.7. Others
8. Global Microbiome Cosmetic Products Market Analysis and Forecast, By Distribution Channel
8.1. Segment Overview
8.2. Specialty Stores
8.3. Exclusive brand store
8.4. Hypermarket/supermarket
8.5. Online
8.6. Others
9. Global Microbiome Cosmetic Products Market Analysis and Forecast, By Regional Analysis
9.1. Segment Overview
9.2. North America
9.2.1. U.S.
9.2.2. Canada
9.2.3. Mexico
9.3. Europe
9.3.1. Germany
9.3.2. France
9.3.3. U.K.
9.3.4. Italy
9.3.5. Spain
9.4. Asia-Pacific
9.4.1. Japan
9.4.2. China
9.4.3. India
9.5. South America
9.5.1. Brazil
9.6. Middle East and Africa
9.6.1. UAE
9.6.2. South Africa
10. Global Microbiome Cosmetic Products Market-Competitive Landscape
10.1. Overview
10.2. Market Share of Key Players in the Microbiome Cosmetic Products Market
10.2.1. Global Company Market Share
10.2.2. North America Company Market Share
10.2.3. Europe Company Market Share
10.2.4. APAC Company Market Share
10.3. Competitive Situations and Trends
10.3.1. Product Launches and Developments
10.3.2. Partnerships, Collaborations, and Agreements
10.3.3. Mergers & Acquisitions
10.3.4. Expansions
11. Company Profiles
11.1. Algenist
11.1.1. Business Overview
11.1.2. Company Snapshot
11.1.3. Company Market Share Analysis
11.1.4. Company Product Portfolio
11.1.5. Recent Developments
11.1.6. SWOT Analysis
11.2. Amore Pacific.
11.2.1. Business Overview
11.2.2. Company Snapshot
11.2.3. Company Market Share Analysis
11.2.4. Company Product Portfolio
11.2.5. Recent Developments
11.2.6. SWOT Analysis
11.3. Aurelia Probiotic Skincare
11.3.1. Business Overview
11.3.2. Company Snapshot
11.3.3. Company Market Share Analysis
11.3.4. Company Product Portfolio
11.3.5. Recent Developments
11.3.6. SWOT Analysis
11.4. Bebe & Bella
11.4.1. Business Overview
11.4.2. Company Snapshot
11.4.3. Company Market Share Analysis
11.4.4. Company Product Portfolio
11.4.5. Recent Developments
11.4.6. SWOT Analysis
11.5. Colgate-Palmolive Company
11.5.1. Business Overview
11.5.2. Company Snapshot
11.5.3. Company Market Share Analysis
11.5.4. Company Product Portfolio
11.5.5. Recent Developments
11.5.6. SWOT Analysis
11.6. DSM
11.6.1. Business Overview
11.6.2. Company Snapshot
11.6.3. Company Market Share Analysis
11.6.4. Company Product Portfolio
11.6.5. Recent Developments
11.6.6. SWOT Analysis
11.7. Eminence Organic Skin Care
11.7.1. Business Overview
11.7.2. Company Snapshot
11.7.3. Company Market Share Analysis
11.7.4. Company Product Portfolio
11.7.5. Recent Developments
11.7.6. SWOT Analysis
11.8. Esse.
11.8.1. Business Overview
11.8.2. Company Snapshot
11.8.3. Company Market Share Analysis
11.8.4. Company Product Portfolio
11.8.5. Recent Developments
11.8.6. SWOT Analysis
11.9. First Aid Beauty
11.9.1. Business Overview
11.9.2. Company Snapshot
11.9.3. Company Market Share Analysis
11.9.4. Company Product Portfolio
11.9.5. Recent Developments
11.9.6. SWOT Analysis
11.10. Johnson & Johnson.
11.10.1. Business Overview
11.10.2. Company Snapshot
11.10.3. Company Market Share Analysis
11.10.4. Company Product Portfolio
11.10.5. Recent Developments
11.10.6. SWOT Analysis
11.11. L’Oreal.
11.11.1. Business Overview
11.11.2. Company Snapshot
11.11.3. Company Market Share Analysis
11.11.4. Company Product Portfolio
11.11.5. Recent Developments
11.11.6. SWOT Analysis
11.12. LaFlore.
11.12.1. Business Overview
11.12.2. Company Snapshot
11.12.3. Company Market Share Analysis
11.12.4. Company Product Portfolio
11.12.5. Recent Developments
11.12.6. SWOT Analysis
11.13. Marie Veroniquer.
11.13.1. Business Overview
11.13.2. Company Snapshot
11.13.3. Company Market Share Analysis
11.13.4. Company Product Portfolio
11.13.5. Recent Developments
11.13.6. SWOT Analysis
11.14. Mother Dirt.
11.14.1. Business Overview
11.14.2. Company Snapshot
11.14.3. Company Market Share Analysis
11.14.4. Company Product Portfolio
11.14.5. Recent Developments
11.14.6. SWOT Analysis
11.15. Pacifica.
11.15.1. Business Overview
11.15.2. Company Snapshot
11.15.3. Company Market Share Analysis
11.15.4. Company Product Portfolio
11.15.5. Recent Developments
11.15.6. SWOT Analysis
11.16. Revlon.
11.16.1. Business Overview
11.16.2. Company Snapshot
11.16.3. Company Market Share Analysis
11.16.4. Company Product Portfolio
11.16.5. Recent Developments
11.16.6. SWOT Analysis
11.17. Symbiome.
11.17.1. Business Overview
11.17.2. Company Snapshot
11.17.3. Company Market Share Analysis
11.17.4. Company Product Portfolio
11.17.5. Recent Developments
11.17.6. SWOT Analysis
11.18. Biophile.
11.18.1. Business Overview
11.18.2. Company Snapshot
11.18.3. Company Market Share Analysis
11.18.4. Company Product Portfolio
11.18.5. Recent Developments
11.18.6. SWOT Analysis
11.19. Unilever.
11.19.1. Business Overview
11.19.2. Company Snapshot
11.19.3. Company Market Share Analysis
11.19.4. Company Product Portfolio
11.19.5. Recent Developments
11.19.6. SWOT Analysis
List of Table
1. Global Microbiome Cosmetic Products Market, By Type, 2019-2030 (USD Million)
2. Global Prebiotics Microbiome Cosmetic Products Market, By Region, 2019-2030 (USD Million)
3. Global Postbiotics Microbiome Cosmetic Products Market, By Region, 2019-2030 (USD Million)
4. Global Probiotics Microbiome Cosmetic Products Market, By Region, 2019-2030 (USD Million)
5. Global Microbiome Cosmetic Products Market, By Application, 2019-2030 (USD Million)
6. Global Serum Microbiome Cosmetic Products Market, By Region, 2019-2030 (USD Million)
7. Global Creams & Moisturizer Microbiome Cosmetic Products Market, By Region, 2019-2030 (USD Million)
8. Global Toner Microbiome Cosmetic Products Market, By Region, 2019-2030 (USD Million)
9. Global Oil Microbiome Cosmetic Products Market, By Region, 2019-2030 (USD Million)
10. Global Mist Microbiome Cosmetic Products Market, By Region, 2019-2030 (USD Million)
11. Global Others Microbiome Cosmetic Products Market, By Region, 2019-2030 (USD Million)
12. Global Microbiome Cosmetic Products Market, By Distribution Channel, 2019-2030 (USD Million)
13. Global Specialty Stores Microbiome Cosmetic Products Market, By Region, 2019-2030 (USD Million)
14. Global Exclusive brand store Microbiome Cosmetic Products Market, By Region, 2019-2030 (USD Million)
15. Global Hypermarket/supermarket Microbiome Cosmetic Products Market, By Region, 2019-2030 (USD Million)
16. Global Online Microbiome Cosmetic Products Market, By Region, 2019-2030 (USD Million)
17. Global Others Microbiome Cosmetic Products Market, By Region, 2019-2030 (USD Million)
18. North America Microbiome Cosmetic Products Market, By Type, 2019-2030 (USD Million)
19. North America Microbiome Cosmetic Products Market, By Application, 2019-2030 (USD Million)
20. North America Microbiome Cosmetic Products Market, By Distribution Channel, 2019-2030 (USD Million)
21. U.S. Microbiome Cosmetic Products Market, By Type, 2019-2030 (USD Million)
22. U.S. Microbiome Cosmetic Products Market, By Application, 2019-2030 (USD Million)
23. U.S. Microbiome Cosmetic Products Market, By Distribution Channel, 2019-2030 (USD Million)
24. Canada Microbiome Cosmetic Products Market, By Type, 2019-2030 (USD Million)
25. Canada Microbiome Cosmetic Products Market, By Application, 2019-2030 (USD Million)
26. Canada Microbiome Cosmetic Products Market, By Distribution Channel, 2019-2030 (USD Million)
27. Mexico Microbiome Cosmetic Products Market, By Type, 2019-2030 (USD Million)
28. Mexico Microbiome Cosmetic Products Market, By Application, 2019-2030 (USD Million)
29. Mexico Microbiome Cosmetic Products Market, By Distribution Channel, 2019-2030 (USD Million)
30. Europe Microbiome Cosmetic Products Market, By Type, 2019-2030 (USD Million)
31. Europe Microbiome Cosmetic Products Market, By Application, 2019-2030 (USD Million)
32. Europe Microbiome Cosmetic Products Market, By Distribution Channel, 2019-2030 (USD Million)
33. Germany Microbiome Cosmetic Products Market, By Type, 2019-2030 (USD Million)
34. Germany Microbiome Cosmetic Products Market, By Application, 2019-2030 (USD Million)
35. Germany Microbiome Cosmetic Products Market, By Distribution Channel, 2019-2030 (USD Million)
36. France Microbiome Cosmetic Products Market, By Type 2019-2030 (USD Million)
37. France Microbiome Cosmetic Products Market, By Application, 2019-2030 (USD Million)
38. France Microbiome Cosmetic Products Market, By Distribution Channel, 2019-2030 (USD Million)
39. U.K. Microbiome Cosmetic Products Market, By Type, 2019-2030 (USD Million)
40. U.K. Microbiome Cosmetic Products Market, By Application, 2019-2030 (USD Million)
41. U.K. Microbiome Cosmetic Products Market, By Distribution Channel, 2019-2030 (USD Million)
42. Italy Microbiome Cosmetic Products Market, By Type, 2019-2030 (USD Million)
43. Italy Microbiome Cosmetic Products Market, By Application, 2019-2030 (USD Million)
44. Italy Microbiome Cosmetic Products Market, By Distribution Channel, 2019-2030 (USD Million)
45. Spain Microbiome Cosmetic Products Market, By Type, 2019-2030 (USD Million)
46. Spain Microbiome Cosmetic Products Market, By Application, 2019-2030 (USD Million)
47. Spain Microbiome Cosmetic Products Market, By Distribution Channel, 2019-2030 (USD Million)
48. Asia Pacific Microbiome Cosmetic Products Market, By Type, 2019-2030 (USD Million)
49. Asia Pacific Microbiome Cosmetic Products Market, By Application, 2019-2030 (USD Million)
50. Asia Pacific Microbiome Cosmetic Products Market, By Distribution Channel, 2019-2030 (USD Million)
51. Japan Microbiome Cosmetic Products Market, By Type, 2019-2030 (USD Million)
52. Japan Microbiome Cosmetic Products Market, By Application, 2019-2030 (USD Million)
53. Japan Microbiome Cosmetic Products Market, By Distribution Channel, 2019-2030 (USD Million)
54. China Microbiome Cosmetic Products Market, By Type 2019-2030 (USD Million)
55. China Microbiome Cosmetic Products Market, By Application, 2019-2030 (USD Million)
56. China Microbiome Cosmetic Products Market, By Distribution Channel, 2019-2030 (USD Million)
57. India Microbiome Cosmetic Products Market, By Type 2019-2030 (USD Million)
58. India Microbiome Cosmetic Products Market, By Application, 2019-2030 (USD Million)
59. India Microbiome Cosmetic Products Market, By Distribution Channel, 2019-2030 (USD Million)
60. South America Microbiome Cosmetic Products Market, By Type, 2019-2030 (USD Million)
61. South America Microbiome Cosmetic Products Market, By Application, 2019-2030 (USD Million)
62. South America Microbiome Cosmetic Products Market, By Distribution Channel, 2019-2030 (USD Million)
63. Brazil Microbiome Cosmetic Products Market, By Type 2019-2030 (USD Million)
64. Brazil Microbiome Cosmetic Products Market, By Application, 2019-2030 (USD Million)
65. Brazil Microbiome Cosmetic Products Market, By Distribution Channel, 2019-2030 (USD Million)
66. Middle East and Africa Microbiome Cosmetic Products Market, By Type, 2019-2030 (USD Million)
67. Middle East and Africa Microbiome Cosmetic Products Market, By Application, 2019-2030 (USD Million)
68. Middle East and Africa Microbiome Cosmetic Products Market, By Distribution Channel, 2019-2030 (USD Million)
69. UAE Microbiome Cosmetic Products Market, By Type, 2019-2030 (USD Million)
70. UAE Microbiome Cosmetic Products Market, By Application, 2019-2030 (USD Million)
71. UAE Microbiome Cosmetic Products Market, By Distribution Channel, 2019-2030 (USD Million)
72. South Africa Microbiome Cosmetic Products Market, By Type 2019-2030 (USD Million)
73. South Africa Microbiome Cosmetic Products Market, By Application, 2019-2030 (USD Million)
74. South Africa Microbiome Cosmetic Products Market, By Distribution Channel, 2019-2030 (USD Million)
List of Figures
1. Global Microbiome Cosmetic Products Market Segmentation
2. Microbiome Cosmetic Products Market: Research Methodology
3. Market Size Estimation Methodology: Bottom-Up Approach
4. Market Size Estimation Methodology: Top-Down Approach
5. Data Triangulation
6. Porter’s Five Forces Analysis
7. Value Chain Analysis
8. Global Microbiome Cosmetic Products Market Attractiveness Analysis by Type
9. Global Microbiome Cosmetic Products Market Attractiveness Analysis by Application
10. Global Microbiome Cosmetic Products Market Attractiveness Analysis by Distribution Channel
11. Global Microbiome Cosmetic Products Market Attractiveness Analysis by Region
12. Global Microbiome Cosmetic Products Market: Dynamics
13. Global Microbiome Cosmetic Products Market Share by Type (2022 & 2030)
14. Global Microbiome Cosmetic Products Market Share by Application (2022 & 2030)
15. Global Microbiome Cosmetic Products Market Share by Distribution Channel (2022 & 2030)
16. Global Microbiome Cosmetic Products Market Share by Regions (2022 & 2030)
17. Global Microbiome Cosmetic Products Market Share by Company (2021)
This study forecasts revenue at global, regional, and country levels from 2019 to 2030. The Brainy Insights has segmented the global microbiome cosmetic products market based on below mentioned segments:
Global Microbiome Cosmetic Products Market Type:
Global Microbiome Cosmetic Products Market Application:
Global Microbiome Cosmetic Products Market Distribution Channel:
Global Microbiome Cosmetic Products Market by Region:
Research has its special purpose to undertake marketing efficiently. In this competitive scenario, businesses need information across all industry verticals; the information about customer wants, market demand, competition, industry trends, distribution channels etc. This information needs to be updated regularly because businesses operate in a dynamic environment. Our organization, The Brainy Insights incorporates scientific and systematic research procedures in order to get proper market insights and industry analysis for overall business success. The analysis consists of studying the market from a miniscule level wherein we implement statistical tools which helps us in examining the data with accuracy and precision.
Our research reports feature both; quantitative and qualitative aspects for any market. Qualitative information for any market research process are fundamental because they reveal the customer needs and wants, usage and consumption for any product/service related to a specific industry. This in turn aids the marketers/investors in knowing certain perceptions of the customers. Qualitative research can enlighten about the different product concepts and designs along with unique service offering that in turn, helps define marketing problems and generate opportunities. On the other hand, quantitative research engages with the data collection process through interviews, e-mail interactions, surveys and pilot studies. Quantitative aspects for the market research are useful to validate the hypotheses generated during qualitative research method, explore empirical patterns in the data with the help of statistical tools, and finally make the market estimations.
The Brainy Insights offers comprehensive research and analysis, based on a wide assortment of factual insights gained through interviews with CXOs and global experts and secondary data from reliable sources. Our analysts and industry specialist assume vital roles in building up statistical tools and analysis models, which are used to analyse the data and arrive at accurate insights with exceedingly informative research discoveries. The data provided by our organization have proven precious to a diverse range of companies, facilitating them to address issues such as determining which products/services are the most appealing, whether or not customers use the product in the manner anticipated, the purchasing intentions of the market and many others.
Our research methodology encompasses an idyllic combination of primary and secondary initiatives. Key phases involved in this process are listed below:

The phase involves the gathering and collecting of market data and its related information with the help of different sources & research procedures.

The data procurement stage involves in data gathering and collecting through various data sources.
This stage involves in extensive research. These data sources includes:
Purchased Database: Purchased databases play a crucial role in estimating the market sizes irrespective of the domain. Our purchased database includes:
Primary Research: The Brainy Insights interacts with leading companies and experts of the concerned domain to develop the analyst team’s market understanding and expertise. It improves and substantiates every single data presented in the market reports. Primary research mainly involves in telephonic interviews, E-mail interactions and face-to-face interviews with the raw material providers, manufacturers/producers, distributors, & independent consultants. The interviews that we conduct provides valuable data on market size and industry growth trends prevailing in the market. Our organization also conducts surveys with the various industry experts in order to gain overall insights of the industry/market. For instance, in healthcare industry we conduct surveys with the pharmacists, doctors, surgeons and nurses in order to gain insights and key information of a medical product/device/equipment which the customers are going to usage. Surveys are conducted in the form of questionnaire designed by our own analyst team. Surveys plays an important role in primary research because surveys helps us to identify the key target audiences of the market. Additionally, surveys helps to identify the key target audience engaged with the market. Our survey team conducts the survey by targeting the key audience, thus gaining insights from them. Based on the perspectives of the customers, this information is utilized to formulate market strategies. Moreover, market surveys helps us to understand the current competitive situation of the industry. To be precise, our survey process typically involve with the 360 analysis of the market. This analytical process begins by identifying the prospective customers for a product or service related to the market/industry to obtain data on how a product/service could fit into customers’ lives.

Secondary Research: The secondary data sources includes information published by the on-profit organizations such as World bank, WHO, company fillings, investor presentations, annual reports, national government documents, statistical databases, blogs, articles, white papers and others. From the annual report, we analyse a company’s revenue to understand the key segment and market share of that organization in a particular region. We analyse the company websites and adopt the product mapping technique which is important for deriving the segment revenue. In the product mapping method, we select and categorize the products offered by the companies catering to domain specific market, deduce the product revenue for each of the companies so as to get overall estimation of the market size. We also source data and analyses trends based on information received from supply side and demand side intermediaries in the value chain. The supply side denotes the data gathered from supplier, distributor, wholesaler and the demand side illustrates the data gathered from the end customers for respective market domain.

The supply side for a domain specific market is analysed by:
The demand side for the market is estimated through:
In-house Library: Apart from these third-party sources, we have our in-house library of qualitative and quantitative information. Our in-house database includes market data for various industry and domains. These data are updated on regular basis as per the changing market scenario. Our library includes, historic databases, internal audit reports and archives.
Sometimes there are instances where there is no metadata or raw data available for any domain specific market. For those cases, we use our expertise to forecast and estimate the market size in order to generate comprehensive data sets. Our analyst team adopt a robust research technique in order to produce the estimates:
Data Synthesis: This stage involves the analysis & mapping of all the information obtained from the previous step. It also involves in scrutinizing the data for any discrepancy observed while data gathering related to the market. The data is collected with consideration to the heterogeneity of sources. Robust scientific techniques are in place for synthesizing disparate data sets and provide the essential contextual information that can orient market strategies. The Brainy Insights has extensive experience in data synthesis where the data passes through various stages:


Market Deduction & Formulation: The final stage comprises of assigning data points at appropriate market spaces so as to deduce feasible conclusions. Analyst perspective & subject matter expert based holistic form of market sizing coupled with industry analysis also plays a crucial role in this stage.
This stage involves in finalization of the market size and numbers that we have collected from data integration step. With data interpolation, it is made sure that there is no gap in the market data. Successful trend analysis is done by our analysts using extrapolation techniques, which provide the best possible forecasts for the market.
Data Validation & Market Feedback: Validation is the most important step in the process. Validation & re-validation via an intricately designed process helps us finalize data-points to be used for final calculations.

The Brainy Insights interacts with leading companies and experts of the concerned domain to develop the analyst team’s market understanding and expertise. It improves and substantiates every single data presented in the market reports. The data validation interview and discussion panels are typically composed of the most experienced industry members. The participants include, however, are not limited to:
Moreover, we always validate our data and findings through primary respondents from all the major regions we are working on.


Free Customization
Fortune 500 Clients
Free Yearly Update On Purchase Of Multi/Corporate License
Companies Served Till Date