- +1-315-215-1633
- sales@thebrainyinsights.com

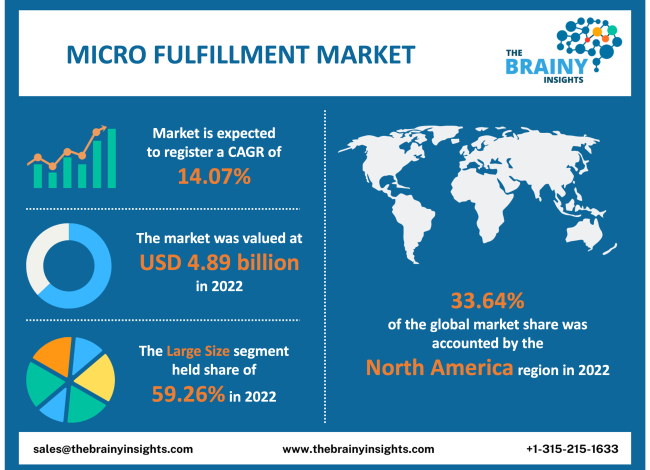
The global micro fulfillment market was valued at USD 4.89 billion in 2022 and growing at a CAGR of 14.07% from 2023 to 2032. The market is expected to reach USD 18.23 billion by 2032. Europe is expected to increase the fastest during the forecast period.
Strategic deployment of little warehouses and delivery centres in highly populated areas is known as micro fulfillment. Because of the facility's proximity to the customers, online product orders can be delivered quickly and affordably. A micro fulfillment centre (MFC) is a small- and large-scale storage facility that practically every industry, e-commerce business, and general store use to warehouse their materials and goods close to the end customer so they can save time and money. These MFC warehouses are fully automated and contribute to increased operational efficiency in developed nations. The use of these MFC in e-commerce operations is increasingly popular since it provides a valuable connection between the expanding geographical nature of e-commerce demand, increased quantities, and the growing need for the quickest delivery to the doorstep. Micro fulfillment is a helpful technique used by retailers to streamline the process of fulfilling an online order, from receiving it to packing it and, in certain situations, providing last-mile delivery. Its strategy focuses primarily on combining the efficiency of big, automated warehouses with the quickness of localized, in-store pickup. Micro fulfillment technology uses small, highly automated storage facilities close to the consumer, reducing the time and cost of the items. Micro fulfillment combines a software management system with physical infrastructure to process orders, take things from storage, and send them for packaging and delivery. Sometimes last-mile delivery to a customer's address is part of the micro fulfillment services. As demand for e-grocery services rises, the interiors of this micro fulfillment have turned into the best option for supermarkets trying to bring fulfillment closer to customers for curbside pickup or home delivery.
Get an overview of this study by requesting a free sample
Micro fulfillment centres are being used more often in e-groceries- The number of MFC is growing quickly in e-commerce and e-grocery strategies. Online e-grocery platforms offer their consumers the service of products and groceries with the assistance of small and medium-sized MFC, who bring the products to their doorstep. The micro fulfillment market is anticipated to grow due to these factors. The market's primary drivers are major global e-commerce businesses, including Amazon, Walmart, Kroger, Alibaba, and Ocado. The demand for services from end users, including manufacturing industries, e-commerce platforms, and general retailers, is also growing quickly, propelling the micro fulfillment market's expansion.
The fulfillment centres are located outside the city- The current fulfillment centres are spread out from the main city, which has a minor negative impact on the micro fulfillment market. This results in increased logistics and transportation costs and longer delivery times than anticipated by customers, particularly in the e-commerce, grocery, and food and beverage industries. Because there isn't much room in residential areas for storage, fulfillment centres must have huge premises. As a result, warehouses are constructed outside of cities for operations, adversely affecting the micro fulfillment market.
Micro fulfillment centres' technological advancements are opening up new possibilities- Micro fulfillment centres' use of automation and robotics, among other technological developments, are opening up a wide range of prospects for new companies and the market. An automated mobile robot is a particular type of robot designed by algorithms to comprehend its environment, navigate it without the assistance of a human operator, and follow the path. Increasing design, accelerating pace, and improving precision and speed are top priorities for the micro fulfillment market and logistical enterprises. Micro fulfillment businesses frequently consult AMRs. AMRs employ a combination of sensors, software, algorithms, AI, and machine learning to plan their paths across the workplace. An order collection conveyer is where a piece-picking robot automatically picks up and drops stuff from stock containers. The piece-picking robots operate automatically, which helps to reduce time and expenses. The growing demand from warehouses motivates developers to create faster and safer robots. These favourable factors will significantly propel the micro fulfillment market globally.
Labour issues- The high turnover rates resulting from a shortage of trained workers and rising minimum wages are significant barriers to digital transformation and the rapid implementation of automated warehouse processes. Using unique algorithms and software for labour management may identify behaviours that indicate a worker is on leave. Operators can then take action based on real-time labour optimization findings to keep top players or proactively replace them with systems.
The regions analyzed for the market include North America, Europe, South America, Asia Pacific, the Middle East, and Africa. North America emerged as the highest in the global micro fulfillment market, with a share of 33.64% and valued at USD 1.64 billion in 2022. The United States is the region's leading country for the recent development of micro fulfillment strategy. For instance, the United States has the AutoStore Company, an established brand with hundreds of e-commerce fulfillment installations, including a recent agreement with Swisslog and H-E-B for a small-scale fulfillment facility in the country.
North America Region Micro Fulfillment Market Share in 2022 - 33.64%
www.thebrainyinsights.com
Check the geographical analysis of this market by requesting a free sample
The technology segment is divided into mobile AMR, traditional WMS, and piece picking robots. The traditional WMS segment had the highest market share of 36.82% and was valued at USD 1.80 billion in 2022 in the micro fulfillment market. Traditional warehouses, the standard ones, are the buildings everyone has been creating for a long time. With a traditional WMS, all business operations are carried out manually by the employees. For instance, the business needs to hire and train people appropriately for the job.
The warehouse segment is divided into large size and small size. The large size segment had the highest market share of 59.26% and was valued at USD 2.89 billion in 2022 in the micro fulfillment market. Depending on the scale of the operation, warehouse centres with a significant size typically have a range of more than 300,000 square feet. Large-scale fulfillment centres can store an enormous amount of goods and materials, which might survive for many years of operation and might not need to be replenished as frequently. For instance, Amazon's Tennessee fulfillment centre has 3.6 million square feet, whereas Nike's is 2.8 million square feet. These large fulfillments are situated a considerable distance from residential locations.
The end-user segment is divided into industries, e-commerce, and general stores. The e-commerce segment had the highest market share of 35.07% and was valued at USD 1.71 billion in 2022 in the micro fulfillment market. It is because more consumers are using e-commerce websites. Amazon, Walmart, and Alibaba are just a few big companies heavily investing in micro facilities. The pandemic accelerated the development of e-commerce platforms and micro fulfillment facilities as well.
| Attribute | Description |
|---|---|
| Market Size | Revenue (USD Billion) |
| Market size value in 2022 | USD 4.89 Billion |
| Market size value in 2032 | USD 18.23 Billion |
| CAGR (2023 to 2032) | 14.07% |
| Historical data | 2019-2021 |
| Base Year | 2022 |
| Forecast | 2023-2032 |
| Regional Segments | The regions analyzed for the market are Europe, Asia Pacific, North America, South America, and Middle East & Africa. |
| Segments | Technology, Warehouse, End-user |
As per The Brainy Insights, the size of the micro fulfillment market was valued at USD 4.89 billion in 2022 & USD 18.23 billion by 2032.
Global micro fulfillment market is growing at a CAGR of 14.07% during the forecast period 2023-2032.
North America region emerged as the largest market for the micro fulfillment.
Micro fulfillment centres are being used more often in e-groceries which is a significant driving factor for the growth of the micro fulfillment market.
The fulfillment centres are located outside of the city is a significant restraining factor for the micro fulfillment market.
Micro fulfilment centres' technological advancements are opening up new possibilities which is a significant opportunity for the growth of the micro fulfillment market.
Labour issues is a significant challenge for the growth of the micro fulfillment market.
1. Introduction
1.1. Objective of the Study
1.2. Market Definition
1.3. Research Scope
1.4. Currency
1.5. Key Target Audience
2. Research Methodology and Assumptions
3. Executive Summary
4. Premium Insights
4.1. Porter’s Five Forces Analysis
4.2. Value Chain Analysis
4.3. Top Investment Pockets
4.3.1. Market Attractiveness Analysis By Technology
4.3.2. Market Attractiveness Analysis By Warehouse
4.3.3. Market Attractiveness Analysis By End-user
4.3.4. Market Attractiveness Analysis By Region
4.4. Industry Trends
5. Market Dynamics
5.1. Market Evaluation
5.2. Drivers
5.2.1. Micro fulfillment centres are being used more often in e-groceries
5.3. Restraints
5.3.1. The fulfillment centres are located outside of the city
5.4. Opportunities
5.4.1. Micro fulfillment centres' technological advancements are opening up new possibilities
5.5. Challenges
5.5.1. Labour issues
6. Global Micro Fulfillment Market Analysis and Forecast, By Technology
6.1. Segment Overview
6.2. Mobile AMR
6.3. Traditional WMS
6.4. Piece Picking Robots
7. Global Micro Fulfillment Market Analysis and Forecast, By Warehouse
7.1. Segment Overview
7.2. Large Size
7.3. Small Size
8. Global Micro Fulfillment Market Analysis and Forecast, By End-user
8.1. Segment Overview
8.2. Industries
8.3. E-Commerce
8.4. General Stores
9. Global Micro Fulfillment Market Analysis and Forecast, By Regional Analysis
9.1. Segment Overview
9.2. North America
9.2.1. U.S.
9.2.2. Canada
9.2.3. Mexico
9.3. Europe
9.3.1. Germany
9.3.2. France
9.3.3. U.K.
9.3.4. Italy
9.3.5. Spain
9.4. Asia-Pacific
9.4.1. Japan
9.4.2. China
9.4.3. India
9.5. South America
9.5.1. Brazil
9.6. Middle East and Africa
9.6.1. UAE
9.6.2. South Africa
10. Global Micro Fulfillment Market-Competitive Landscape
10.1. Overview
10.2. Market Share of Key Players in the Micro Fulfillment Market
10.2.1. Global Company Market Share
10.2.2. North America Company Market Share
10.2.3. Europe Company Market Share
10.2.4. APAC Company Market Share
10.3. Competitive Situations and Trends
10.3.1. Product Launches and Developments
10.3.2. Partnerships, Collaborations, and Agreements
10.3.3. Mergers & Acquisitions
10.3.4. Expansions
11. Company Profiles
11.1. Ahold Delhaize
11.1.1. Business Overview
11.1.2. Company Snapshot
11.1.3. Company Market Share Analysis
11.1.4. Company Product Portfolio
11.1.5. Recent Developments
11.1.6. SWOT Analysis
11.2. Davinci Micro Fulfillment
11.2.1. Business Overview
11.2.2. Company Snapshot
11.2.3. Company Market Share Analysis
11.2.4. Company Product Portfolio
11.2.5. Recent Developments
11.2.6. SWOT Analysis
11.3. Flowspace
11.3.1. Business Overview
11.3.2. Company Snapshot
11.3.3. Company Market Share Analysis
11.3.4. Company Product Portfolio
11.3.5. Recent Developments
11.3.6. SWOT Analysis
11.4. Honeywell International Inc
11.4.1. Business Overview
11.4.2. Company Snapshot
11.4.3. Company Market Share Analysis
11.4.4. Company Product Portfolio
11.4.5. Recent Developments
11.4.6. SWOT Analysis
11.5. Instacart
11.5.1. Business Overview
11.5.2. Company Snapshot
11.5.3. Company Market Share Analysis
11.5.4. Company Product Portfolio
11.5.5. Recent Developments
11.5.6. SWOT Analysis
11.6. LOCAD
11.6.1. Business Overview
11.6.2. Company Snapshot
11.6.3. Company Market Share Analysis
11.6.4. Company Product Portfolio
11.6.5. Recent Developments
11.6.6. SWOT Analysis
11.7. PACK and SEND Holdings Pty Ltd
11.7.1. Business Overview
11.7.2. Company Snapshot
11.7.3. Company Market Share Analysis
11.7.4. Company Product Portfolio
11.7.5. Recent Developments
11.7.6. SWOT Analysis
11.8. Swisslog
11.8.1. Business Overview
11.8.2. Company Snapshot
11.8.3. Company Market Share Analysis
11.8.4. Company Product Portfolio
11.8.5. Recent Developments
11.8.6. SWOT Analysis
11.9. Alert Innovation, Inc.
11.9.1. Business Overview
11.9.2. Company Snapshot
11.9.3. Company Market Share Analysis
11.9.4. Company Product Portfolio
11.9.5. Recent Developments
11.9.6. SWOT Analysis
11.10. Dematic
11.10.1. Business Overview
11.10.2. Company Snapshot
11.10.3. Company Market Share Analysis
11.10.4. Company Product Portfolio
11.10.5. Recent Developments
11.10.6. SWOT Analysis
11.11. HÖRMANN
11.11.1. Business Overview
11.11.2. Company Snapshot
11.11.3. Company Market Share Analysis
11.11.4. Company Product Portfolio
11.11.5. Recent Developments
11.11.6. SWOT Analysis
11.12. OPEX
11.12.1. Business Overview
11.12.2. Company Snapshot
11.12.3. Company Market Share Analysis
11.12.4. Company Product Portfolio
11.12.5. Recent Developments
11.12.6. SWOT Analysis
11.13. The Kroger Company
11.13.1. Business Overview
11.13.2. Company Snapshot
11.13.3. Company Market Share Analysis
11.13.4. Company Product Portfolio
11.13.5. Recent Developments
11.13.6. SWOT Analysis
11.14. Bastian Solutions, LLC
11.14.1. Business Overview
11.14.2. Company Snapshot
11.14.3. Company Market Share Analysis
11.14.4. Company Product Portfolio
11.14.5. Recent Developments
11.14.6. SWOT Analysis
11.15. KPI Integrated Solutions
11.15.1. Business Overview
11.15.2. Company Snapshot
11.15.3. Company Market Share Analysis
11.15.4. Company Product Portfolio
11.15.5. Recent Developments
11.15.6. SWOT Analysis
11.16. PACLINE OVERHEAD CONVEYORS
11.16.1. Business Overview
11.16.2. Company Snapshot
11.16.3. Company Market Share Analysis
11.16.4. Company Product Portfolio
11.16.5. Recent Developments
11.16.6. SWOT Analysis
11.17. Fortna Inc.
11.17.1. Business Overview
11.17.2. Company Snapshot
11.17.3. Company Market Share Analysis
11.17.4. Company Product Portfolio
11.17.5. Recent Developments
11.17.6. SWOT Analysis
List of Table
1. Global Micro Fulfillment Market, By Technology, 2019-2032 (USD Billion)
2. Global Mobile AMR, Micro Fulfillment Market, By Region, 2019-2032 (USD Billion)
3. Global Traditional WMS, Micro Fulfillment Market, By Region, 2019-2032 (USD Billion)
4. Global Piece Picking Robots, Micro Fulfillment Market, By Region, 2019-2032 (USD Billion)
5. Global Micro Fulfillment Market, By Warehouse, 2019-2032 (USD Billion)
6. Global Large Size, Micro Fulfillment Market, By Region, 2019-2032 (USD Billion)
7. Global Small Size, Micro Fulfillment Market, By Region, 2019-2032 (USD Billion)
8. Global Micro Fulfillment Market, By End-user, 2019-2032 (USD Billion)
9. Global Industries, Micro Fulfillment Market, By Region, 2019-2032 (USD Billion)
10. Global E-Commerce, Micro Fulfillment Market, By Region, 2019-2032 (USD Billion)
11. Global General Stores, Micro Fulfillment Market, By Region, 2019-2032 (USD Billion)
12. Global Micro Fulfillment Market, By Region, 2019-2032 (USD Billion)
13. North America Micro Fulfillment Market, By Technology, 2019-2032 (USD Billion)
14. North America Micro Fulfillment Market, By Warehouse, 2019-2032 (USD Billion)
15. North America Micro Fulfillment Market, By End-user, 2019-2032 (USD Billion)
16. U.S. Micro Fulfillment Market, By Technology, 2019-2032 (USD Billion)
17. U.S. Micro Fulfillment Market, By Warehouse, 2019-2032 (USD Billion)
18. U.S. Micro Fulfillment Market, By End-user, 2019-2032 (USD Billion)
19. Canada Micro Fulfillment Market, By Technology, 2019-2032 (USD Billion)
20. Canada Micro Fulfillment Market, By Warehouse, 2019-2032 (USD Billion)
21. Canada Micro Fulfillment Market, By End-user, 2019-2032 (USD Billion)
22. Mexico Micro Fulfillment Market, By Technology, 2019-2032 (USD Billion)
23. Mexico Micro Fulfillment Market, By Warehouse, 2019-2032 (USD Billion)
24. Mexico Micro Fulfillment Market, By End-user, 2019-2032 (USD Billion)
25. Europe Micro Fulfillment Market, By Technology, 2019-2032 (USD Billion)
26. Europe Micro Fulfillment Market, By Warehouse, 2019-2032 (USD Billion)
27. Europe Micro Fulfillment Market, By End-user, 2019-2032 (USD Billion)
28. Germany Micro Fulfillment Market, By Technology, 2019-2032 (USD Billion)
29. Germany Micro Fulfillment Market, By Warehouse, 2019-2032 (USD Billion)
30. Germany Micro Fulfillment Market, By End-user, 2019-2032 (USD Billion)
31. France Micro Fulfillment Market, By Technology, 2019-2032 (USD Billion)
32. France Micro Fulfillment Market, By Warehouse, 2019-2032 (USD Billion)
33. France Micro Fulfillment Market, By End-user, 2019-2032 (USD Billion)
34. U.K. Micro Fulfillment Market, By Technology, 2019-2032 (USD Billion)
35. U.K. Micro Fulfillment Market, By Warehouse, 2019-2032 (USD Billion)
36. U.K. Micro Fulfillment Market, By End-user, 2019-2032 (USD Billion)
37. Italy Micro Fulfillment Market, By Technology, 2019-2032 (USD Billion)
38. Italy Micro Fulfillment Market, By Warehouse, 2019-2032 (USD Billion)
39. Italy Micro Fulfillment Market, By End-user, 2019-2032 (USD Billion)
40. Spain Micro Fulfillment Market, By Technology, 2019-2032 (USD Billion)
41. Spain Micro Fulfillment Market, By Warehouse, 2019-2032 (USD Billion)
42. Spain Micro Fulfillment Market, By End-user, 2019-2032 (USD Billion)
43. Asia Pacific Micro Fulfillment Market, By Technology, 2019-2032 (USD Billion)
44. Asia Pacific Micro Fulfillment Market, By Warehouse, 2019-2032 (USD Billion)
45. Asia Pacific Micro Fulfillment Market, By End-user, 2019-2032 (USD Billion)
46. Japan Micro Fulfillment Market, By Technology, 2019-2032 (USD Billion)
47. Japan Micro Fulfillment Market, By Warehouse, 2019-2032 (USD Billion)
48. Japan Micro Fulfillment Market, By End-user, 2019-2032 (USD Billion)
49. China Micro Fulfillment Market, By Technology, 2019-2032 (USD Billion)
50. China Micro Fulfillment Market, By Warehouse, 2019-2032 (USD Billion)
51. China Micro Fulfillment Market, By End-user, 2019-2032 (USD Billion)
52. India Micro Fulfillment Market, By Technology, 2019-2032 (USD Billion)
53. India Micro Fulfillment Market, By Warehouse, 2019-2032 (USD Billion)
54. India Micro Fulfillment Market, By End-user, 2019-2032 (USD Billion)
55. South America Micro Fulfillment Market, By Technology, 2019-2032 (USD Billion)
56. South America Micro Fulfillment Market, By Warehouse, 2019-2032 (USD Billion)
57. South America Micro Fulfillment Market, By End-user, 2019-2032 (USD Billion)
58. Brazil Micro Fulfillment Market, By Technology, 2019-2032 (USD Billion)
59. Brazil Micro Fulfillment Market, By Warehouse, 2019-2032 (USD Billion)
60. Brazil Micro Fulfillment Market, By End-user, 2019-2032 (USD Billion)
61. Middle East and Africa Micro Fulfillment Market, By Technology, 2019-2032 (USD Billion)
62. Middle East and Africa Micro Fulfillment Market, By Warehouse, 2019-2032 (USD Billion)
63. Middle East and Africa Micro Fulfillment Market, By End-user, 2019-2032 (USD Billion)
64. UAE Micro Fulfillment Market, By Technology, 2019-2032 (USD Billion)
65. UAE Micro Fulfillment Market, By Warehouse, 2019-2032 (USD Billion)
66. UAE Micro Fulfillment Market, By End-user, 2019-2032 (USD Billion)
67. South Africa Micro Fulfillment Market, By Technology, 2019-2032 (USD Billion)
68. South Africa Micro Fulfillment Market, By Warehouse, 2019-2032 (USD Billion)
69. South Africa Micro Fulfillment Market, By End-user, 2019-2032 (USD Billion)
List of Figures
1. Global Micro Fulfillment Market Segmentation
2. Micro Fulfillment Market: Research Methodology
3. Market Size Estimation Methodology: Bottom-Up Approach
4. Market Size Estimation Methodology: Top-Down Approach
5. Data Triangulation
6. Porter’s Five Forces Analysis
7. Value Chain Analysis
8. Global Micro Fulfillment Market Attractiveness Analysis By Technology
9. Global Micro Fulfillment Market Attractiveness Analysis By Warehouse
10. Global Micro Fulfillment Market Attractiveness Analysis By End-user
11. Global Micro Fulfillment Market Attractiveness Analysis By Region
12. Global Micro Fulfillment Market: Dynamics
13. Global Micro Fulfillment Market Share by Technology (2023 & 2032)
14. Global Micro Fulfillment Market Share by Warehouse (2023 & 2032)
15. Global Micro Fulfillment Market Share by End-user (2023 & 2032)
16. Global Micro Fulfillment Market Share by Regions (2023 & 2032)
17. Global Micro Fulfillment Market Share by Company (2022)
This study forecasts revenue at global, regional, and country levels from 2019 to 2032. The Brainy Insights has segmented the global micro fulfillment based on below mentioned segments:
Global Micro Fulfillment by Technology:
Global Micro Fulfillment by Warehouse:
Global Micro Fulfillment by End-user:
Global Micro Fulfillment by Region:
Research has its special purpose to undertake marketing efficiently. In this competitive scenario, businesses need information across all industry verticals; the information about customer wants, market demand, competition, industry trends, distribution channels etc. This information needs to be updated regularly because businesses operate in a dynamic environment. Our organization, The Brainy Insights incorporates scientific and systematic research procedures in order to get proper market insights and industry analysis for overall business success. The analysis consists of studying the market from a miniscule level wherein we implement statistical tools which helps us in examining the data with accuracy and precision.
Our research reports feature both; quantitative and qualitative aspects for any market. Qualitative information for any market research process are fundamental because they reveal the customer needs and wants, usage and consumption for any product/service related to a specific industry. This in turn aids the marketers/investors in knowing certain perceptions of the customers. Qualitative research can enlighten about the different product concepts and designs along with unique service offering that in turn, helps define marketing problems and generate opportunities. On the other hand, quantitative research engages with the data collection process through interviews, e-mail interactions, surveys and pilot studies. Quantitative aspects for the market research are useful to validate the hypotheses generated during qualitative research method, explore empirical patterns in the data with the help of statistical tools, and finally make the market estimations.
The Brainy Insights offers comprehensive research and analysis, based on a wide assortment of factual insights gained through interviews with CXOs and global experts and secondary data from reliable sources. Our analysts and industry specialist assume vital roles in building up statistical tools and analysis models, which are used to analyse the data and arrive at accurate insights with exceedingly informative research discoveries. The data provided by our organization have proven precious to a diverse range of companies, facilitating them to address issues such as determining which products/services are the most appealing, whether or not customers use the product in the manner anticipated, the purchasing intentions of the market and many others.
Our research methodology encompasses an idyllic combination of primary and secondary initiatives. Key phases involved in this process are listed below:

The phase involves the gathering and collecting of market data and its related information with the help of different sources & research procedures.

The data procurement stage involves in data gathering and collecting through various data sources.
This stage involves in extensive research. These data sources includes:
Purchased Database: Purchased databases play a crucial role in estimating the market sizes irrespective of the domain. Our purchased database includes:
Primary Research: The Brainy Insights interacts with leading companies and experts of the concerned domain to develop the analyst team’s market understanding and expertise. It improves and substantiates every single data presented in the market reports. Primary research mainly involves in telephonic interviews, E-mail interactions and face-to-face interviews with the raw material providers, manufacturers/producers, distributors, & independent consultants. The interviews that we conduct provides valuable data on market size and industry growth trends prevailing in the market. Our organization also conducts surveys with the various industry experts in order to gain overall insights of the industry/market. For instance, in healthcare industry we conduct surveys with the pharmacists, doctors, surgeons and nurses in order to gain insights and key information of a medical product/device/equipment which the customers are going to usage. Surveys are conducted in the form of questionnaire designed by our own analyst team. Surveys plays an important role in primary research because surveys helps us to identify the key target audiences of the market. Additionally, surveys helps to identify the key target audience engaged with the market. Our survey team conducts the survey by targeting the key audience, thus gaining insights from them. Based on the perspectives of the customers, this information is utilized to formulate market strategies. Moreover, market surveys helps us to understand the current competitive situation of the industry. To be precise, our survey process typically involve with the 360 analysis of the market. This analytical process begins by identifying the prospective customers for a product or service related to the market/industry to obtain data on how a product/service could fit into customers’ lives.

Secondary Research: The secondary data sources includes information published by the on-profit organizations such as World bank, WHO, company fillings, investor presentations, annual reports, national government documents, statistical databases, blogs, articles, white papers and others. From the annual report, we analyse a company’s revenue to understand the key segment and market share of that organization in a particular region. We analyse the company websites and adopt the product mapping technique which is important for deriving the segment revenue. In the product mapping method, we select and categorize the products offered by the companies catering to domain specific market, deduce the product revenue for each of the companies so as to get overall estimation of the market size. We also source data and analyses trends based on information received from supply side and demand side intermediaries in the value chain. The supply side denotes the data gathered from supplier, distributor, wholesaler and the demand side illustrates the data gathered from the end customers for respective market domain.

The supply side for a domain specific market is analysed by:
The demand side for the market is estimated through:
In-house Library: Apart from these third-party sources, we have our in-house library of qualitative and quantitative information. Our in-house database includes market data for various industry and domains. These data are updated on regular basis as per the changing market scenario. Our library includes, historic databases, internal audit reports and archives.
Sometimes there are instances where there is no metadata or raw data available for any domain specific market. For those cases, we use our expertise to forecast and estimate the market size in order to generate comprehensive data sets. Our analyst team adopt a robust research technique in order to produce the estimates:
Data Synthesis: This stage involves the analysis & mapping of all the information obtained from the previous step. It also involves in scrutinizing the data for any discrepancy observed while data gathering related to the market. The data is collected with consideration to the heterogeneity of sources. Robust scientific techniques are in place for synthesizing disparate data sets and provide the essential contextual information that can orient market strategies. The Brainy Insights has extensive experience in data synthesis where the data passes through various stages:


Market Deduction & Formulation: The final stage comprises of assigning data points at appropriate market spaces so as to deduce feasible conclusions. Analyst perspective & subject matter expert based holistic form of market sizing coupled with industry analysis also plays a crucial role in this stage.
This stage involves in finalization of the market size and numbers that we have collected from data integration step. With data interpolation, it is made sure that there is no gap in the market data. Successful trend analysis is done by our analysts using extrapolation techniques, which provide the best possible forecasts for the market.
Data Validation & Market Feedback: Validation is the most important step in the process. Validation & re-validation via an intricately designed process helps us finalize data-points to be used for final calculations.

The Brainy Insights interacts with leading companies and experts of the concerned domain to develop the analyst team’s market understanding and expertise. It improves and substantiates every single data presented in the market reports. The data validation interview and discussion panels are typically composed of the most experienced industry members. The participants include, however, are not limited to:
Moreover, we always validate our data and findings through primary respondents from all the major regions we are working on.


Free Customization
Fortune 500 Clients
Free Yearly Update On Purchase Of Multi/Corporate License
Companies Served Till Date