- +1-315-215-1633
- sales@thebrainyinsights.com

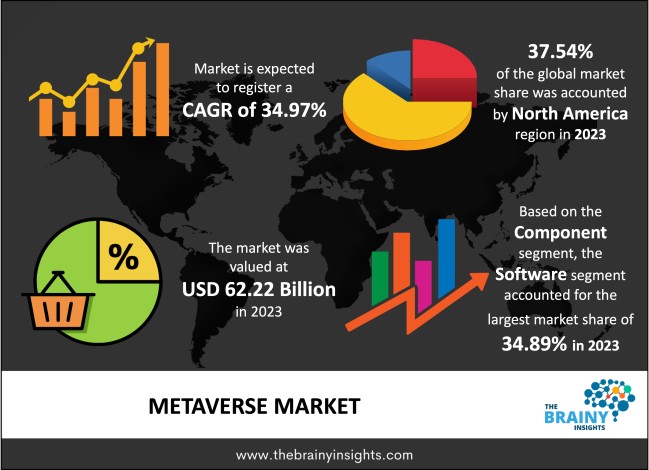
The global metaverse market was valued at USD 62.22 billion in 2023 and grew at a CAGR of 34.97% from 2024 to 2033. The market is expected to reach USD 1,248.55 billion by 2033. The increase of VR and AR in the gaming and entertainment industry will drive the growth of the global metaverse market. The improvement in graphics due to advancements in technology and the focus on more immersive experiences are some of the factors driving the market. Also, there is a surge in consumer interest regarding Virtual Reality (VR) along with a decrease in cost for VR headsets and related components, further driving the Metaverse market due to the accessibility of a wider audience. Growth is not just limited to entertainment or gaming; it also spreads across healthcare, education, and real estate. Hence, there is a broad opportunity for the market.
The metaverse is an amalgamation of cutting-edge technologies that enable virtual reality. It makes it possible for people to engage online in the most lifelike manner. In other terms, the metaverse is a network of interconnected, authentic virtual environments that allow for user interaction. They can convene meetings as well. Because of its lifelike human-like avatars engaging in user-created virtual environments, Metaverse has revolutionised the entertainment and gaming industries. Additionally, metaverse facilitates collaborative learning. Neal Stephenson, an American science fiction novelist, coined the term "metaverse" in his dystopian novel Snow Crash, which is set in the near future. To develop realistic virtual worlds, Metaverse makes use of virtual reality, augmented reality, and other cutting-edge technology. Additionally, the metaverse offers unique, realistic, immersive, and exciting teaching and learning opportunities. The creation of the metaverse also makes use of robots, cloud computing, artificial intelligence, blockchain technology, the Internet of Things, and these other technologies. The metaverse not only enhances teaching and learning experiences but is also very effective at co-creation and cooperation, making it useful in business contexts. The metaverse creates new avenues for interaction and learning. It may open up new avenues for business branding, marketing, and advertising online. In the coming years, the metaverse has the capacity to improve society and make a difference.
Get an overview of this study by requesting a free sample
The increasing demand for immersive gaming experiences – The introduction of Virtual, augmented, and mixed reality in the gaming industry to enable an engaging, immersive, and realistic experience for consumers will propel the global metaverse market's growth. Brands are investing heavily towards developing games that offer a first-hand experience to consumers. Such development is also seen in other sectors like sports, entertainment, beauty, and retail to improvise customer engagement and brand imaging. The introduction of gaming booths globally to cater to the growing gaming demands of the young population will propel the market's growth. The development of competitive arenas in the gaming industry, making it a professional career, drives the market's growth. Furthermore, consumers are demanding metaverse to explore virtual worlds.
The high costs of development – Metaverse is the culmination of several high-end technologies, including artificial intelligence, augmented reality, virtual reality, big data and the Internet of Things. All these are highly sophisticated products which entail significant costs in the development and maintenance. Therefore, the high development and maintenance costs will hamper the market's growth. Furthermore, the metaverse is in its initial developmental stages. It is being employed on an experimental basis, which requires subsequent reassessments and improvements, thereby adding to research and development costs before any fruitful revenue can be generated.
The increasing applications of metaverse – The advancements and breakthroughs in novel technologies like artificial intelligence, augmented reality and IoT, have enabled the application of metaverse in sectors beyond gaming and entertainment. Metaverse can be employed to develop engaging, immersive and innovative active learning programs to improve education. It can also be used in healthcare to expand universal health coverage. Metaverse has been extensively used in remote work culture, which grew exponentially during the pandemic by offering virtual board rooms and meeting spaces with enhanced collaboration and cooperation tools without comprising safety. Metaverse also has potential applications in defence, aerospace, travel, BFSI, which will expand its scope and contribute to the market's growth and development in the forecast period.
The regions analyzed for the market include North America, Europe, South America, Asia Pacific, the Middle East, and Africa. North America emerged as the most significant global metaverse market, with a 37.54% market revenue share in 2023.
The major market players or developers of the metaverse are headquartered in the region, along with a sizable operational base. They drive research and development along with innovation in the metaverse market. They have access to the most advanced, high-end and sophisticated technologies and the necessary funds to enable development in the industry. The United States of America has access to the most advanced cutting-edge technologies in the world, thereby offering the region an upper-hand in the market. An enabling regulatory environment also augments the market's growth. Given the Chinese overtures in the technological sector, the Asia Pacific is expected to grow significantly in the forecast period
North America Region Metaverse Market Share in 2023 – 37.54%
www.thebrainyinsights.com
Check the geographical analysis of this market by requesting a free sample
The component segment is divided into hardware, software, and services. The software segment dominated the market, with a market share of around 34.89% in 2023. Developing metaverse or realistic virtual worlds requires software applications, including design, development, programming and assembly, to deliver a final product. 3D modelling and animation are also examples of software used in metaverse development. The rising popularity of gaming and immersive entertainment, augmented by VR, AR and MR development, will drive the segment's growth.
The technology segment is divided into virtual reality, augmented reality, mixed reality, blockchain and others. The augmented reality segment dominated the market, with a market share of around 31.33% in 2023. The real world and computer-generated content are combined in augmented reality, enabling an interactive and engaging experience for the user. Computer-generated information in texts, images, and videos in the real physical world is known as augmented reality (AR). The technological advancements and growing applications of AR will drive the segment's growth. AR is increasingly slated to be used for medical training and education. The gaming and entertainment sector, along with fashion, beauty, and design, are all benefitting from AR.
The end-user segment is divided into retail, media and entertainment, automotive, healthcare, education, aerospace and defence, BFSI and others. The media and entertainment segment dominated the market, with a market share of around 20.11% in 2023. Gaming will form a significant part of metaverse applications in the media and entertainment industry. The rising demand for immersive, engaging and near-realistic gaming experiences will boost the segment's growth. Furthermore, the introduction of AR and VR in the entertainment industry to enable performances across the barriers of the physical world will lead to increasing collaborative work, thereby transforming the industry.
| Attribute | Description |
|---|---|
| Market Size | Revenue (USD Billion) |
| Market size value in 2023 | USD 62.22 Billion |
| Market size value in 2033 | USD 1,248.55 Billion |
| CAGR (2024 to 2033) | 34.97% |
| Historical data | 2020-2022 |
| Base Year | 2023 |
| Forecast | 2024-2033 |
| Region | The regions analyzed for the market are Asia Pacific, Europe, South America, North America, and Middle East & Africa. Furthermore, the regions are further analyzed at the country level. |
| Segments | Component, Technology and End User |
As per The Brainy Insights, the size of the global metaverse market was valued at USD 62.22 billion in 2023 to USD 1,248.55 billion by 2033.
Global metaverse market is growing at a CAGR of 34.97% during the forecast period 2024-2033.
The market's growth will be influenced by the increasing demand for immersive gamin experiences.
The high costs of development could hamper the market growth.
1. Introduction
1.1. Objectives of the Study
1.2. Market Definition
1.3. Research Scope
1.4. Currency
1.5. Key Target Audience
2. Research Methodology and Assumptions
3. Executive Summary
4. Premium Insights
4.1. Porter’s Five Forces Analysis
4.2. Value Chain Analysis
4.3. Top Investment Pockets
4.3.1. Market Attractiveness Analysis by Component
4.3.2. Market Attractiveness Analysis by Technology
4.3.3. Market Attractiveness Analysis by End User
4.3.4. Market Attractiveness Analysis by Region
4.4. Industry Trends
5. Market Dynamics
5.1. Market Evaluation
5.2. Drivers
5.2.1. The increasing demand for immersive gaming experiences
5.3. Restraints
5.3.1. The high costs of developments
5.4. Opportunities
5.4.1. The increasing applications of metaverse
5.5. Challenges
5.5.1. The rising threat of cyber-attacks
6. Global Metaverse Market Analysis and Forecast, By Component
6.1. Segment Overview
6.2. Hardware
6.3. Software
6.4. Services
7. Global Metaverse Market Analysis and Forecast, By Technology
7.1. Segment Overview
7.2. Virtual Reality
7.3. Augmented Reality
7.4. Mixed Reality
7.5. Blockchain
7.6. Others
8. Global Metaverse Market Analysis and Forecast, By End User
8.1. Segment Overview
8.2. Retail
8.3. Media and Entertainment
8.4. Automotive
8.5. Healthcare
8.6. Education
8.7. Aerospace and Defence
8.8. BFSI
8.9. Others
9. Global Metaverse Market Analysis and Forecast, By Regional Analysis
9.1. Segment Overview
9.2. North America
9.2.1. U.S.
9.2.2. Canada
9.2.3. Mexico
9.3. Europe
9.3.1. Germany
9.3.2. France
9.3.3. U.K.
9.3.4. Italy
9.3.5. Spain
9.4. Asia-Pacific
9.4.1. Japan
9.4.2. China
9.4.3. India
9.5. South America
9.5.1. Brazil
9.6. Middle East and Africa
9.6.1. UAE
9.6.2. South Africa
10. Global Metaverse Market-Competitive Landscape
10.1. Overview
10.2. Market Share of Key Players in the Metaverse Market
10.2.1. Global Company Market Share
10.2.2. North America Company Market Share
10.2.3. Europe Company Market Share
10.2.4. APAC Company Market Share
10.3. Competitive Situations and Trends
10.3.1. Product Launches and Developments
10.3.2. Partnerships, Collaborations, and Agreements
10.3.3. Mergers & Acquisitions
10.3.4. Expansions
11. Company Profiles
11.1. Alibaba Group Holding Limited
11.1.1. Business Overview
11.1.2. Company Snapshot
11.1.3. Company Market Share Analysis
11.1.4. Company Product Portfolio
11.1.5. Recent Developments
11.1.6. SWOT Analysis
11.2. Alphabet Inc.
11.2.1. Business Overview
11.2.2. Company Snapshot
11.2.3. Company Market Share Analysis
11.2.4. Company Product Portfolio
11.2.5. Recent Developments
11.2.6. SWOT Analysis
11.3. Antier Solutions
11.3.1. Business Overview
11.3.2. Company Snapshot
11.3.3. Company Market Share Analysis
11.3.4. Company Product Portfolio
11.3.5. Recent Developments
11.3.6. SWOT Analysis
11.4. Meta Platforms Inc.
11.4.1. Business Overview
11.4.2. Company Snapshot
11.4.3. Company Market Share Analysis
11.4.4. Company Product Portfolio
11.4.5. Recent Developments
11.4.6. SWOT Analysis
11.5. NetEase Inc.
11.5.1. Business Overview
11.5.2. Company Snapshot
11.5.3. Company Market Share Analysis
11.5.4. Company Product Portfolio
11.5.5. Recent Developments
11.5.6. SWOT Analysis
11.6. Nextech AR Solutions Inc.
11.6.1. Business Overview
11.6.2. Company Snapshot
11.6.3. Company Market Share Analysis
11.6.4. Company Product Portfolio
11.6.5. Recent Developments
11.6.6. SWOT Analysis
11.7. NVIDIA Corporation
11.7.1. Business Overview
11.7.2. Company Snapshot
11.7.3. Company Market Share Analysis
11.7.4. Company Product Portfolio
11.7.5. Recent Developments
11.7.6. SWOT Analysis
11.8. Roblox Corporation
11.8.1. Business Overview
11.8.2. Company Snapshot
11.8.3. Company Market Share Analysis
11.8.4. Company Product Portfolio
11.8.5. Recent Developments
11.8.6. SWOT Analysis
11.9. Tencent Holdings Limited
11.9.1. Business Overview
11.9.2. Company Snapshot
11.9.3. Company Market Share Analysis
11.9.4. Company Product Portfolio
11.9.5. Recent Developments
11.9.6. SWOT Analysis
11.10. Unity Technologies
11.10.1. Business Overview
11.10.2. Company Snapshot
11.10.3. Company Market Share Analysis
11.10.4. Company Product Portfolio
11.10.5. Recent Developments
11.10.6. SWOT Analysis
List of Table
1. Global Metaverse Market, By Component, 2020 - 2033 (USD Billion)
2. Global Hardware Metaverse Market, By Region, 2020 - 2033 (USD Billion)
3. Global Software Metaverse Market, By Region, 2020 - 2033 (USD Billion)
4. Global Services Metaverse Market, By Region, 2020 - 2033 (USD Billion)
5. Global Metaverse Market, By Technology, 2020 - 2033 (USD Billion)
6. Global Virtual Reality Metaverse Market, By Region, 2020 - 2033 (USD Billion)
7. Global Augmented Reality Metaverse Market, By Region, 2020 - 2033 (USD Billion)
8. Global Mixed Reality Metaverse Market, By Region, 2020 - 2033 (USD Billion)
9. Global Blockchain Metaverse Market, By Region, 2020 - 2033 (USD Billion)
10. Global Others Metaverse Market, By Region, 2020 - 2033 (USD Billion)
11. Global Metaverse Market, By End User, 2020 - 2033 (USD Billion)
12. Global Retail Metaverse Market, By Region, 2020 - 2033 (USD Billion)
13. Global Media and Entertainment Metaverse Market, By Region, 2020 - 2033 (USD Billion)
14. Global Automotive Metaverse Market, By Region, 2020 - 2033 (USD Billion)
15. Global Healthcare Metaverse Market, By Region, 2020 - 2033 (USD Billion)
16. Global Education Metaverse Market, By Region, 2020 - 2033 (USD Billion)
17. Global Aerospace and Defence Metaverse Market, By Region, 2020 - 2033 (USD Billion)
18. Global BFSI Metaverse Market, By Region, 2020 - 2033 (USD Billion)
19. Global Others Metaverse Market, By Region, 2020 - 2033 (USD Billion)
20. Global Metaverse Market, By Region, 2020 - 2033 (USD Billion)
21. North America Metaverse Market, By Component, 2020 - 2033 (USD Billion)
22. North America Metaverse Market, By Technology, 2020 - 2033 (USD Billion)
23. North America Metaverse Market, By End User, 2020 - 2033 (USD Billion)
24. U.S. Metaverse Market, By Component, 2020 - 2033 (USD Billion)
25. U.S. Metaverse Market, By Technology, 2020 - 2033 (USD Billion)
26. U.S. Metaverse Market, By End User, 2020 - 2033 (USD Billion)
27. Canada Metaverse Market, By Component, 2020 - 2033 (USD Billion)
28. Canada Metaverse Market, By Technology, 2020 - 2033 (USD Billion)
29. Canada Metaverse Market, By End User, 2020 - 2033 (USD Billion)
30. Mexico Metaverse Market, By Component, 2020 - 2033 (USD Billion)
31. Mexico Metaverse Market, By Technology, 2020 - 2033 (USD Billion)
32. Mexico Metaverse Market, By End User, 2020 - 2033 (USD Billion)
33. Europe Metaverse Market, By Component, 2020 - 2033 (USD Billion)
34. Europe Metaverse Market, By Technology, 2020 - 2033 (USD Billion)
35. Europe Metaverse Market, By End User, 2020 - 2033 (USD Billion)
36. Germany Metaverse Market, By Component, 2020 - 2033 (USD Billion)
37. Germany Metaverse Market, By Technology, 2020 - 2033 (USD Billion)
38. Germany Metaverse Market, By End User, 2020 - 2033 (USD Billion)
39. France Metaverse Market, By Component, 2020 - 2033 (USD Billion)
40. France Metaverse Market, By Technology, 2020 - 2033 (USD Billion)
41. France Metaverse Market, By End User, 2020 - 2033 (USD Billion)
42. U.K. Metaverse Market, By Component, 2020 - 2033 (USD Billion)
43. U.K. Metaverse Market, By Technology, 2020 - 2033 (USD Billion)
44. U.K. Metaverse Market, By End User, 2020 - 2033 (USD Billion)
45. Italy Metaverse Market, By Component, 2020 - 2033 (USD Billion)
46. Italy Metaverse Market, By Technology, 2020 - 2033 (USD Billion)
47. Italy Metaverse Market, By End User, 2020 - 2033 (USD Billion)
48. Spain Metaverse Market, By Component, 2020 - 2033 (USD Billion)
49. Spain Metaverse Market, By Technology, 2020 - 2033 (USD Billion)
50. Spain Metaverse Market, By End User, 2020 - 2033 (USD Billion)
51. Asia Pacific Metaverse Market, By Component, 2020 - 2033 (USD Billion)
52. Asia Pacific Metaverse Market, By Technology, 2020 - 2033 (USD Billion)
53. Asia Pacific Metaverse Market, By End User, 2020 - 2033 (USD Billion)
54. Japan Metaverse Market, By Component, 2020 - 2033 (USD Billion)
55. Japan Metaverse Market, By Technology, 2020 - 2033 (USD Billion)
56. Japan Metaverse Market, By End User, 2020 - 2033 (USD Billion)
57. China Metaverse Market, By Component, 2020 - 2033 (USD Billion)
58. China Metaverse Market, By Technology, 2020 - 2033 (USD Billion)
59. China Metaverse Market, By End User, 2020 - 2033 (USD Billion)
60. India Metaverse Market, By Component, 2020 - 2033 (USD Billion)
61. India Metaverse Market, By Technology, 2020 - 2033 (USD Billion)
62. India Metaverse Market, By End User, 2020 - 2033 (USD Billion)
63. South America Metaverse Market, By Component, 2020 - 2033 (USD Billion)
64. South America Metaverse Market, By Technology, 2020 - 2033 (USD Billion)
65. South America Metaverse Market, By End User, 2020 - 2033 (USD Billion)
66. Brazil Metaverse Market, By Component, 2020 - 2033 (USD Billion)
67. Brazil Metaverse Market, By Technology, 2020 - 2033 (USD Billion)
68. Brazil Metaverse Market, By End User, 2020 - 2033 (USD Billion)
69. Middle East and Africa Metaverse Market, By Component, 2020 - 2033 (USD Billion)
70. Middle East and Africa Metaverse Market, By Technology, 2020 - 2033 (USD Billion)
71. Middle East and Africa Metaverse Market, By End User, 2020 - 2033 (USD Billion)
72. UAE Metaverse Market, By Component, 2020 - 2033 (USD Billion)
73. UAE Metaverse Market, By Technology, 2020 - 2033 (USD Billion)
74. UAE Metaverse Market, By End User, 2020 - 2033 (USD Billion)
75. South Africa Metaverse Market, By Component, 2020 - 2033 (USD Billion)
76. South Africa Metaverse Market, By Technology, 2020 - 2033 (USD Billion)
77. South Africa Metaverse Market, By End User, 2020 - 2033 (USD Billion)
List of Figures
1. Global Metaverse Market Segmentation
2. Metaverse Market: Research Methodology
3. Market Size Estimation Methodology: Bottom-Up Approach
4. Market Size Estimation Methodology: Top-Down Approach
5. Data Triangulation
6. Porter’s Five Forces Analysis
7. Value Chain Analysis
8. Global Metaverse Market Attractiveness Analysis by Component
9. Global Metaverse Market Attractiveness Analysis by Technology
10. Global Metaverse Market Attractiveness Analysis by End User
11. Global Metaverse Market Attractiveness Analysis by Region
12. Global Metaverse Market: Dynamics
13. Global Metaverse Market Share by Component (2023 & 2033)
14. Global Metaverse Market Share by Technology (2023 & 2033)
15. Global Metaverse Market Share by End User (2023 & 2033)
16. Global Metaverse Market Share by Regions (2023 & 2033)
17. Global Metaverse Market Share by Company (2023)
This study forecasts revenue at global, regional, and country levels from 2020 to 2033. The Brainy Insights has segmented the global metaverse market based on below mentioned segments:
Global Metaverse Market by Component:
Global Metaverse Market by Technology:
Global Metaverse Market by End User:
Global Metaverse Market by Region:
Research has its special purpose to undertake marketing efficiently. In this competitive scenario, businesses need information across all industry verticals; the information about customer wants, market demand, competition, industry trends, distribution channels etc. This information needs to be updated regularly because businesses operate in a dynamic environment. Our organization, The Brainy Insights incorporates scientific and systematic research procedures in order to get proper market insights and industry analysis for overall business success. The analysis consists of studying the market from a miniscule level wherein we implement statistical tools which helps us in examining the data with accuracy and precision.
Our research reports feature both; quantitative and qualitative aspects for any market. Qualitative information for any market research process are fundamental because they reveal the customer needs and wants, usage and consumption for any product/service related to a specific industry. This in turn aids the marketers/investors in knowing certain perceptions of the customers. Qualitative research can enlighten about the different product concepts and designs along with unique service offering that in turn, helps define marketing problems and generate opportunities. On the other hand, quantitative research engages with the data collection process through interviews, e-mail interactions, surveys and pilot studies. Quantitative aspects for the market research are useful to validate the hypotheses generated during qualitative research method, explore empirical patterns in the data with the help of statistical tools, and finally make the market estimations.
The Brainy Insights offers comprehensive research and analysis, based on a wide assortment of factual insights gained through interviews with CXOs and global experts and secondary data from reliable sources. Our analysts and industry specialist assume vital roles in building up statistical tools and analysis models, which are used to analyse the data and arrive at accurate insights with exceedingly informative research discoveries. The data provided by our organization have proven precious to a diverse range of companies, facilitating them to address issues such as determining which products/services are the most appealing, whether or not customers use the product in the manner anticipated, the purchasing intentions of the market and many others.
Our research methodology encompasses an idyllic combination of primary and secondary initiatives. Key phases involved in this process are listed below:

The phase involves the gathering and collecting of market data and its related information with the help of different sources & research procedures.

The data procurement stage involves in data gathering and collecting through various data sources.
This stage involves in extensive research. These data sources includes:
Purchased Database: Purchased databases play a crucial role in estimating the market sizes irrespective of the domain. Our purchased database includes:
Primary Research: The Brainy Insights interacts with leading companies and experts of the concerned domain to develop the analyst team’s market understanding and expertise. It improves and substantiates every single data presented in the market reports. Primary research mainly involves in telephonic interviews, E-mail interactions and face-to-face interviews with the raw material providers, manufacturers/producers, distributors, & independent consultants. The interviews that we conduct provides valuable data on market size and industry growth trends prevailing in the market. Our organization also conducts surveys with the various industry experts in order to gain overall insights of the industry/market. For instance, in healthcare industry we conduct surveys with the pharmacists, doctors, surgeons and nurses in order to gain insights and key information of a medical product/device/equipment which the customers are going to usage. Surveys are conducted in the form of questionnaire designed by our own analyst team. Surveys plays an important role in primary research because surveys helps us to identify the key target audiences of the market. Additionally, surveys helps to identify the key target audience engaged with the market. Our survey team conducts the survey by targeting the key audience, thus gaining insights from them. Based on the perspectives of the customers, this information is utilized to formulate market strategies. Moreover, market surveys helps us to understand the current competitive situation of the industry. To be precise, our survey process typically involve with the 360 analysis of the market. This analytical process begins by identifying the prospective customers for a product or service related to the market/industry to obtain data on how a product/service could fit into customers’ lives.

Secondary Research: The secondary data sources includes information published by the on-profit organizations such as World bank, WHO, company fillings, investor presentations, annual reports, national government documents, statistical databases, blogs, articles, white papers and others. From the annual report, we analyse a company’s revenue to understand the key segment and market share of that organization in a particular region. We analyse the company websites and adopt the product mapping technique which is important for deriving the segment revenue. In the product mapping method, we select and categorize the products offered by the companies catering to domain specific market, deduce the product revenue for each of the companies so as to get overall estimation of the market size. We also source data and analyses trends based on information received from supply side and demand side intermediaries in the value chain. The supply side denotes the data gathered from supplier, distributor, wholesaler and the demand side illustrates the data gathered from the end customers for respective market domain.

The supply side for a domain specific market is analysed by:
The demand side for the market is estimated through:
In-house Library: Apart from these third-party sources, we have our in-house library of qualitative and quantitative information. Our in-house database includes market data for various industry and domains. These data are updated on regular basis as per the changing market scenario. Our library includes, historic databases, internal audit reports and archives.
Sometimes there are instances where there is no metadata or raw data available for any domain specific market. For those cases, we use our expertise to forecast and estimate the market size in order to generate comprehensive data sets. Our analyst team adopt a robust research technique in order to produce the estimates:
Data Synthesis: This stage involves the analysis & mapping of all the information obtained from the previous step. It also involves in scrutinizing the data for any discrepancy observed while data gathering related to the market. The data is collected with consideration to the heterogeneity of sources. Robust scientific techniques are in place for synthesizing disparate data sets and provide the essential contextual information that can orient market strategies. The Brainy Insights has extensive experience in data synthesis where the data passes through various stages:


Market Deduction & Formulation: The final stage comprises of assigning data points at appropriate market spaces so as to deduce feasible conclusions. Analyst perspective & subject matter expert based holistic form of market sizing coupled with industry analysis also plays a crucial role in this stage.
This stage involves in finalization of the market size and numbers that we have collected from data integration step. With data interpolation, it is made sure that there is no gap in the market data. Successful trend analysis is done by our analysts using extrapolation techniques, which provide the best possible forecasts for the market.
Data Validation & Market Feedback: Validation is the most important step in the process. Validation & re-validation via an intricately designed process helps us finalize data-points to be used for final calculations.

The Brainy Insights interacts with leading companies and experts of the concerned domain to develop the analyst team’s market understanding and expertise. It improves and substantiates every single data presented in the market reports. The data validation interview and discussion panels are typically composed of the most experienced industry members. The participants include, however, are not limited to:
Moreover, we always validate our data and findings through primary respondents from all the major regions we are working on.


Free Customization
Fortune 500 Clients
Free Yearly Update On Purchase Of Multi/Corporate License
Companies Served Till Date