- +1-315-215-1633
- sales@thebrainyinsights.com

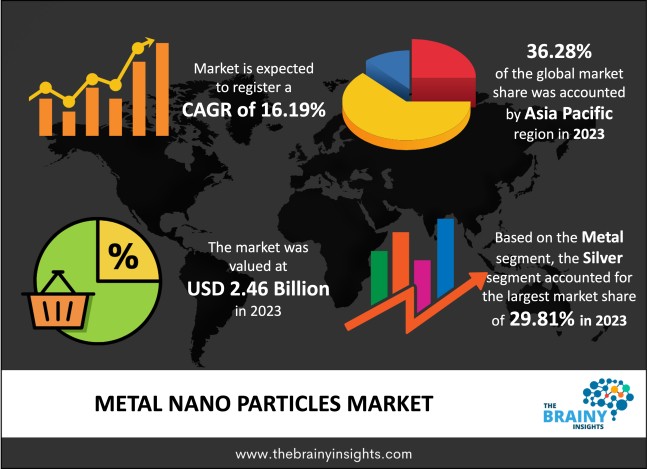
The global metal nano particles market was valued at USD 2.46 Billion in 2023 and grew at a CAGR of 16.19% from 2024 to 2033. The market is expected to reach USD 11.03 Billion by 2033. The growth of the metal nano particles market can be attributed to the rising usage in cosmetics, electric and electronics, pharmaceutical, and chemical industries.
Metal nanoparticles, also known as NPs, are widely used in many scientific domains, such as biochemistry, plasmonics, and optics. However, they are specifically utilized in heterogeneous catalysis to maximize the exposed area of a metal catalyst, which is usually a costly, rare late transition metal. The size, shape, elementary composition and atomic organization of metal nanoparticles—various characteristics whose roles are frequently entwined—are closely related to their chemical reactivity. A combination of physical and chemical methods is used to create these metal nanoparticles. The diameter of these nanoparticles ranges from 1 to 100 nm. Micron-scale pure metals are another term for metal nanoparticles. These nanoparticles' antibacterial, antifungal, and antimicrobial properties make them extremely useful in healthcare. Metallic nanoparticles have several applications in therapeutic and diagnostic processes.
Get an overview of this study by requesting a free sample
Increasing use in the healthcare industry: The use of metal nanoparticles in the medical field is growing rapidly in this era. Due to their antibacterial, antimicrobial, and antifungal characteristics, nanoparticles are extensively employed in the healthcare industry. Metal nanoparticles, such as those made of silver, gold, titanium, copper, etc., have therapeutic properties and are used in drug diagnosis, delivery, and other medical fields. The pharmaceutical industries use silver and gold nanoparticles extensively because they may be utilized to cultivate both gram-positive and gram-negative bacteria. They are also employed in the creation of novel medications. The government provides money for research and development in the healthcare industry.
High cost: The main market barrier is the high cost of metal nanoparticles. Metal nanoparticles have widespread application in various end-user industries, including cosmetics, healthcare, pharmaceuticals, electrical and electronic sectors. The product's price would rise due to the high cost of nanoparticles. To obtain an appropriate profit margin in the sales estimate forecast, all end-user companies must raise the price of their metal nanoparticle products.
Increasing growth of the personal care industry: The personal care industry is expected to continue to develop, providing new chances for creative products based on customer interest in skincare. The personal care business is increasing at a quicker rate than any other sector of the beauty business. The skin care sector has seen a shift in demand from elderly consumers to a younger client base that is rising. The cosmetics industry is growing in popularity in North American and European markets, with sales rising yearly in the major cities. The demand for personal care ingredients is expected to drive the metal nano particle market expansion due to the increased manufacture of skincare and hair care products brought about by the rising awareness of personal health.
The regions analyzed for the market include North America, Europe, South America, Asia Pacific, the Middle East, and Africa. Asia-Pacific emerged as the most significant metal nano particles market, with a 36.28% market revenue share in 2023.
Asia-Pacific region will account for the largest market share with revenue growth. The region has a high demand for metal nano particles in electronics and electrical products. The region has a booming consumer electronics industry is leading the way for the market growth of metal nanoparticles. Manufacturers of optoelectronics, microelectronics, photovoltaics, etc., are investing in metal nanoparticles due to growing demand in the automotive and consumer electronic industries.
Asia-Pacific region Metal Nano Particles Market Share in 2023 - 36.28%
www.thebrainyinsights.com
Check the geographical analysis of this market by requesting a free sample
The metal segment is divided into silver, gold, iron, platinum, copper, titanium, nickel and others. The silver segment dominated the market, with a share of around 29.81% in 2023. Due to their special chemical and physical characteristics, the silver nanoparticles are now used in several industries, including food, healthcare, industrial and consumer sectors. These include biological qualities, strong electrical conductivity, electrical, optical, and thermal characteristics.
The synthesis segment is divided into physical, chemical and biological. The biological segment dominated the market, with a share of around 49.02% in 2023. The method of producing nanoscale metallic particles from natural sources is known as a biological synthesis of metallic nanoparticles. They aid in shielding the system from the damaging effects of high metal ion concentration. Depending on the organism or biomolecule being used, many biochemical and biophysical processes are involved in the biological synthesis of metallic nanoparticles.
The application segment is divided into healthcare and pharmaceutical, personal care and cosmetics, electric and electronics, chemical and others. The healthcare and pharmaceutical segment dominated the market, with a share of around 33.76% in 2023. Metal nano particles have many applications in disease diagnostics. The ability of metal nanoparticles to interact with biomolecules at the surface and inside of cells more effectively due to their nanosize has improved the outcomes of diagnostics and treatments.
| Attribute | Description |
|---|---|
| Market Size | Revenue (USD Billion) |
| Market size value in 2023 | USD 2.46 Billion |
| Market size value in 2033 | USD 11.03 Billion |
| CAGR (2024 to 2033) | 16.19% |
| Historical data | 2020-2022 |
| Base Year | 2023 |
| Forecast | 2024-2033 |
| Region | The regions analyzed for the market are Asia Pacific, Europe, South America, North America, and Middle East & Africa. Furthermore, the regions are further analyzed at the country level. |
| Segments | Metal, Synthesis and Application |
As per The Brainy Insights, the size of the metal nano particles market was valued USD 2.46 Billion in 2023 to USD 11.03 Billion by 2033.
Global metal nano particles market is growing at a CAGR of 16.19% during the forecast period 2024-2033.
Asia Pacific region emerged as the largest market for the metal nano particles.
The market's growth will be influenced by the growing usage of metal nano particles in different applications.
The high cost can hamper the market growth.
The increasing growth of green catalysts industry is providing huge opportunities to the market.
1. Introduction
1.1. Objectives of the Study
1.2. Market Definition
1.3. Research Scope
1.4. Currency
1.5. Key Target Audience
2. Research Methodology and Assumptions
3. Executive Summary
4. Premium Insights
4.1. Porter’s Five Forces Analysis
4.2. Value Chain Analysis
4.3. Top Investment Pockets
4.3.1. Market Attractiveness Analysis by Metal
4.3.2. Market Attractiveness Analysis by Synthesis
4.3.3. Market Attractiveness Analysis by Application
4.3.4. Market Attractiveness Analysis by Region
4.4. Industry Trends
5. Market Dynamics
5.1. Market Evaluation
5.2. Drivers
5.2.1. Increasing use of metal nano particles across applications
5.3. Restraints
5.3.1. High cost
5.4. Opportunities
5.4.1. Increasing investment in green catalyst
5.5. Challenges
5.5.1. Hazardous nature
6. Global Metal Nano Particles Market Analysis and Forecast, By Metal
6.1. Segment Overview
6.2. Silver
6.3. Gold
6.4. Iron
6.5. Platinum
6.6. Copper
6.7. Titanium
6.8. Nickel
6.9. Others
7. Global Metal Nano Particles Market Analysis and Forecast, By Synthesis
7.1. Segment Overview
7.2. Physical
7.3. Chemical
7.4. Biological
8. Global Metal Nano Particles Market Analysis and Forecast, By Application
8.1. Segment Overview
8.2. Healthcare and Pharmaceutical
8.3. Personal Care and Cosmetics
8.4. Electric and Electronics
8.5. Chemical
8.6. Others
9. Global Metal Nano Particles Market Analysis and Forecast, By Regional Analysis
9.1. Segment Overview
9.2. North America
9.2.1. U.S.
9.2.2. Canada
9.2.3. Mexico
9.3. Europe
9.3.1. Germany
9.3.2. France
9.3.3. U.K.
9.3.4. Italy
9.3.5. Spain
9.4. Asia-Pacific
9.4.1. Japan
9.4.2. China
9.4.3. India
9.5. South America
9.5.1. Brazil
9.6. Middle East and Africa
9.6.1. UAE
9.6.2. South Africa
10. Global Metal Nano Particles Market-Competitive Landscape
10.1. Overview
10.2. Market Share of Key Players in the Metal Nano Particles Market
10.2.1. Global Company Market Share
10.2.2. North America Company Market Share
10.2.3. Europe Company Market Share
10.2.4. APAC Company Market Share
10.3. Competitive Situations and Trends
10.3.1. Product Launches and Developments
10.3.2. Partnerships, Collaborations, and Agreements
10.3.3. Mergers & Acquisitions
10.3.4. Expansions
11. Company Profiles
11.1. Showa Denko KK
11.1.1. Business Overview
11.1.2. Company Snapshot
11.1.3. Company Market Share Analysis
11.1.4. Company Product Portfolio
11.1.5. Recent Developments
11.1.6. SWOT Analysis
11.2. Sigma Aldrich
11.2.1. Business Overview
11.2.2. Company Snapshot
11.2.3. Company Market Share Analysis
11.2.4. Company Product Portfolio
11.2.5. Recent Developments
11.2.6. SWOT Analysis
11.3. American Elements
11.3.1. Business Overview
11.3.2. Company Snapshot
11.3.3. Company Market Share Analysis
11.3.4. Company Product Portfolio
11.3.5. Recent Developments
11.3.6. SWOT Analysis
11.4. Nanostructured & Amorphous Materials
11.4.1. Business Overview
11.4.2. Company Snapshot
11.4.3. Company Market Share Analysis
11.4.4. Company Product Portfolio
11.4.5. Recent Developments
11.4.6. SWOT Analysis
11.5. Nanoshel
11.5.1. Business Overview
11.5.2. Company Snapshot
11.5.3. Company Market Share Analysis
11.5.4. Company Product Portfolio
11.5.5. Recent Developments
11.5.6. SWOT Analysis
11.6. US Research Nanomaterials
11.6.1. Business Overview
11.6.2. Company Snapshot
11.6.3. Company Market Share Analysis
11.6.4. Company Product Portfolio
11.6.5. Recent Developments
11.6.6. SWOT Analysis
11.7. EPRUI Nanoparticles & Microspheres
11.7.1. Business Overview
11.7.2. Company Snapshot
11.7.3. Company Market Share Analysis
11.7.4. Company Product Portfolio
11.7.5. Recent Developments
11.7.6. SWOT Analysis
11.8. Nanocs
11.8.1. Business Overview
11.8.2. Company Snapshot
11.8.3. Company Market Share Analysis
11.8.4. Company Product Portfolio
11.8.5. Recent Developments
11.8.6. SWOT Analysis
11.9. Meliorum Technologies
11.9.1. Business Overview
11.9.2. Company Snapshot
11.9.3. Company Market Share Analysis
11.9.4. Company Product Portfolio
11.9.5. Recent Developments
11.9.6. SWOT Analysis
11.10. BBI Group
11.10.1. Business Overview
11.10.2. Company Snapshot
11.10.3. Company Market Share Analysis
11.10.4. Company Product Portfolio
11.10.5. Recent Developments
11.10.6. SWOT Analysis
11.11. nanoComposix
11.11.1. Business Overview
11.11.2. Company Snapshot
11.11.3. Company Market Share Analysis
11.11.4. Company Product Portfolio
11.11.5. Recent Developments
11.11.6. SWOT Analysis
11.12. Strem Chemicals
11.12.1. Business Overview
11.12.2. Company Snapshot
11.12.3. Company Market Share Analysis
11.12.4. Company Product Portfolio
11.12.5. Recent Developments
11.12.6. SWOT Analysis
11.13. Tanaka Holdings
11.13.1. Business Overview
11.13.2. Company Snapshot
11.13.3. Company Market Share Analysis
11.13.4. Company Product Portfolio
11.13.5. Recent Developments
11.13.6. SWOT Analysis
List of Table
1. Global Metal Nano Particles Market, By Metal, 2020-2033 (USD Billion)
2. Global Silver, Metal Nano Particles Market, By Region, 2020-2033 (USD Billion)
3. Global Gold, Metal Nano Particles Market, By Region, 2020-2033 (USD Billion)
4. Global Iron, Metal Nano Particles Market, By Region, 2020-2033 (USD Billion)
5. Global Platinum, Metal Nano Particles Market, By Region, 2020-2033 (USD Billion)
6. Global Copper, Metal Nano Particles Market, By Region, 2020-2033 (USD Billion)
7. Global Titanium, Metal Nano Particles Market, By Region, 2020-2033 (USD Billion)
8. Global Nickel, Metal Nano Particles Market, By Region, 2020-2033 (USD Billion)
9. Global Others, Metal Nano Particles Market, By Region, 2020-2033 (USD Billion)
10. Global Metal Nano Particles Market, By Synthesis, 2020-2033 (USD Billion)
11. Global Physical, Metal Nano Particles Market, By Region, 2020-2033 (USD Billion)
12. Global Chemical, Metal Nano Particles Market, By Region, 2020-2033 (USD Billion)
13. Global Biological, Metal Nano Particles Market, By Region, 2020-2033 (USD Billion)
14. Global Metal Nano Particles Market, By Application, 2020-2033 (USD Billion)
15. Global Healthcare and Pharmaceutical, Metal Nano Particles Market, By Region, 2020-2033 (USD Billion)
16. Global Personal Care and Cosmetics, Metal Nano Particles Market, By Region, 2020-2033 (USD Billion)
17. Global Electric and Electronics, Metal Nano Particles Market, By Region, 2020-2033 (USD Billion)
18. Global Chemical, Metal Nano Particles Market, By Region, 2020-2033 (USD Billion)
19. Global Others, Metal Nano Particles Market, By Region, 2020-2033 (USD Billion)
20. Global Metal Nano Particles Market, By Region, 2020-2033 (USD Billion)
21. North America Metal Nano Particles Market, By Metal, 2020-2033 (USD Billion)
22. North America Metal Nano Particles Market, By Synthesis, 2020-2033 (USD Billion)
23. North America Metal Nano Particles Market, By Application, 2020-2033 (USD Billion)
24. U.S. Metal Nano Particles Market, By Metal, 2020-2033 (USD Billion)
25. U.S. Metal Nano Particles Market, By Synthesis, 2020-2033 (USD Billion)
26. U.S. Metal Nano Particles Market, By Application, 2020-2033 (USD Billion)
27. Canada Metal Nano Particles Market, By Metal, 2020-2033 (USD Billion)
28. Canada Metal Nano Particles Market, By Synthesis, 2020-2033 (USD Billion)
29. Canada Metal Nano Particles Market, By Application, 2020-2033 (USD Billion)
30. Mexico Metal Nano Particles Market, By Metal, 2020-2033 (USD Billion)
31. Mexico Metal Nano Particles Market, By Synthesis, 2020-2033 (USD Billion)
32. Mexico Metal Nano Particles Market, By Application, 2020-2033 (USD Billion)
33. Europe Metal Nano Particles Market, By Metal, 2020-2033 (USD Billion)
34. Europe Metal Nano Particles Market, By Synthesis, 2020-2033 (USD Billion)
35. Europe Metal Nano Particles Market, By Application, 2020-2033 (USD Billion)
36. Germany Metal Nano Particles Market, By Metal, 2020-2033 (USD Billion)
37. Germany Metal Nano Particles Market, By Synthesis, 2020-2033 (USD Billion)
38. Germany Metal Nano Particles Market, By Application, 2020-2033 (USD Billion)
39. France Metal Nano Particles Market, By Metal, 2020-2033 (USD Billion)
40. France Metal Nano Particles Market, By Synthesis, 2020-2033 (USD Billion)
41. France Metal Nano Particles Market, By Application, 2020-2033 (USD Billion)
42. U.K. Metal Nano Particles Market, By Metal, 2020-2033 (USD Billion)
43. U.K. Metal Nano Particles Market, By Synthesis, 2020-2033 (USD Billion)
44. U.K. Metal Nano Particles Market, By Application, 2020-2033 (USD Billion)
45. Italy Metal Nano Particles Market, By Metal, 2020-2033 (USD Billion)
46. Italy Metal Nano Particles Market, By Synthesis, 2020-2033 (USD Billion)
47. Italy Metal Nano Particles Market, By Application, 2020-2033 (USD Billion)
48. Spain Metal Nano Particles Market, By Metal, 2020-2033 (USD Billion)
49. Spain Metal Nano Particles Market, By Synthesis, 2020-2033 (USD Billion)
50. Spain Metal Nano Particles Market, By Application, 2020-2033 (USD Billion)
51. Asia Pacific Metal Nano Particles Market, By Metal, 2020-2033 (USD Billion)
52. Asia Pacific Metal Nano Particles Market, By Synthesis, 2020-2033 (USD Billion)
53. Asia Pacific Metal Nano Particles Market, By Application, 2020-2033 (USD Billion)
54. Japan Metal Nano Particles Market, By Metal, 2020-2033 (USD Billion)
55. Japan Metal Nano Particles Market, By Synthesis, 2020-2033 (USD Billion)
56. Japan Metal Nano Particles Market, By Application, 2020-2033 (USD Billion)
57. China Metal Nano Particles Market, By Metal, 2020-2033 (USD Billion)
58. China Metal Nano Particles Market, By Synthesis, 2020-2033 (USD Billion)
59. China Metal Nano Particles Market, By Application, 2020-2033 (USD Billion)
60. India Metal Nano Particles Market, By Metal, 2020-2033 (USD Billion)
61. India Metal Nano Particles Market, By Synthesis, 2020-2033 (USD Billion)
62. India Metal Nano Particles Market, By Application, 2020-2033 (USD Billion)
63. South America Metal Nano Particles Market, By Metal, 2020-2033 (USD Billion)
64. South America Metal Nano Particles Market, By Synthesis, 2020-2033 (USD Billion)
65. South America Metal Nano Particles Market, By Application, 2020-2033 (USD Billion)
66. Brazil Metal Nano Particles Market, By Metal, 2020-2033 (USD Billion)
67. Brazil Metal Nano Particles Market, By Synthesis, 2020-2033 (USD Billion)
68. Brazil Metal Nano Particles Market, By Application, 2020-2033 (USD Billion)
69. Middle East and Africa Metal Nano Particles Market, By Metal, 2020-2033 (USD Billion)
70. Middle East and Africa Metal Nano Particles Market, By Synthesis, 2020-2033 (USD Billion)
71. Middle East and Africa Metal Nano Particles Market, By Application, 2020-2033 (USD Billion)
72. UAE Metal Nano Particles Market, By Metal, 2020-2033 (USD Billion)
73. UAE Metal Nano Particles Market, By Synthesis, 2020-2033 (USD Billion)
74. UAE Metal Nano Particles Market, By Application, 2020-2033 (USD Billion)
75. South Africa Metal Nano Particles Market, By Metal, 2020-2033 (USD Billion)
76. South Africa Metal Nano Particles Market, By Synthesis, 2020-2033 (USD Billion)
77. South Africa Metal Nano Particles Market, By Application, 2020-2033 (USD Billion)
List of Figures
1. Global Metal Nano Particles Market Segmentation
2. Metal Nano Particles Market: Research Methodology
3. Market Size Estimation Methodology: Bottom-Up Approach
4. Market Size Estimation Methodology: Top-Down Approach
5. Data Triangulation
6. Porter’s Five Forces Analysis
7. Value Chain Analysis
8. Global Metal Nano Particles Market Attractiveness Analysis by Metal
9. Global Metal Nano Particles Market Attractiveness Analysis by Synthesis
10. Global Metal Nano Particles Market Attractiveness Analysis by Application
11. Global Metal Nano Particles Market Attractiveness Analysis by Region
12. Global Metal Nano Particles Market: Dynamics
13. Global Metal Nano Particles Market Share by Metal (2023 & 2033)
14. Global Metal Nano Particles Market Share by Synthesis (2023 & 2033)
15. Global Metal Nano Particles Market Share by Application (2023 & 2033)
16. Global Metal Nano Particles Market Share by Regions (2023 & 2033)
17. Global Metal Nano Particles Market Share by Company (2023)
This study forecasts revenue at global, regional, and country levels from 2020 to 2033. The Brainy Insights has segmented the global metal nano particles market based on below mentioned segments:
Global Metal Nano Particles Market by Metal:
Global Metal Nano Particles Market by Synthesis:
Global Metal Nano Particles Market by Application:
Global Metal Nano Particles Market by Region:
Research has its special purpose to undertake marketing efficiently. In this competitive scenario, businesses need information across all industry verticals; the information about customer wants, market demand, competition, industry trends, distribution channels etc. This information needs to be updated regularly because businesses operate in a dynamic environment. Our organization, The Brainy Insights incorporates scientific and systematic research procedures in order to get proper market insights and industry analysis for overall business success. The analysis consists of studying the market from a miniscule level wherein we implement statistical tools which helps us in examining the data with accuracy and precision.
Our research reports feature both; quantitative and qualitative aspects for any market. Qualitative information for any market research process are fundamental because they reveal the customer needs and wants, usage and consumption for any product/service related to a specific industry. This in turn aids the marketers/investors in knowing certain perceptions of the customers. Qualitative research can enlighten about the different product concepts and designs along with unique service offering that in turn, helps define marketing problems and generate opportunities. On the other hand, quantitative research engages with the data collection process through interviews, e-mail interactions, surveys and pilot studies. Quantitative aspects for the market research are useful to validate the hypotheses generated during qualitative research method, explore empirical patterns in the data with the help of statistical tools, and finally make the market estimations.
The Brainy Insights offers comprehensive research and analysis, based on a wide assortment of factual insights gained through interviews with CXOs and global experts and secondary data from reliable sources. Our analysts and industry specialist assume vital roles in building up statistical tools and analysis models, which are used to analyse the data and arrive at accurate insights with exceedingly informative research discoveries. The data provided by our organization have proven precious to a diverse range of companies, facilitating them to address issues such as determining which products/services are the most appealing, whether or not customers use the product in the manner anticipated, the purchasing intentions of the market and many others.
Our research methodology encompasses an idyllic combination of primary and secondary initiatives. Key phases involved in this process are listed below:

The phase involves the gathering and collecting of market data and its related information with the help of different sources & research procedures.

The data procurement stage involves in data gathering and collecting through various data sources.
This stage involves in extensive research. These data sources includes:
Purchased Database: Purchased databases play a crucial role in estimating the market sizes irrespective of the domain. Our purchased database includes:
Primary Research: The Brainy Insights interacts with leading companies and experts of the concerned domain to develop the analyst team’s market understanding and expertise. It improves and substantiates every single data presented in the market reports. Primary research mainly involves in telephonic interviews, E-mail interactions and face-to-face interviews with the raw material providers, manufacturers/producers, distributors, & independent consultants. The interviews that we conduct provides valuable data on market size and industry growth trends prevailing in the market. Our organization also conducts surveys with the various industry experts in order to gain overall insights of the industry/market. For instance, in healthcare industry we conduct surveys with the pharmacists, doctors, surgeons and nurses in order to gain insights and key information of a medical product/device/equipment which the customers are going to usage. Surveys are conducted in the form of questionnaire designed by our own analyst team. Surveys plays an important role in primary research because surveys helps us to identify the key target audiences of the market. Additionally, surveys helps to identify the key target audience engaged with the market. Our survey team conducts the survey by targeting the key audience, thus gaining insights from them. Based on the perspectives of the customers, this information is utilized to formulate market strategies. Moreover, market surveys helps us to understand the current competitive situation of the industry. To be precise, our survey process typically involve with the 360 analysis of the market. This analytical process begins by identifying the prospective customers for a product or service related to the market/industry to obtain data on how a product/service could fit into customers’ lives.

Secondary Research: The secondary data sources includes information published by the on-profit organizations such as World bank, WHO, company fillings, investor presentations, annual reports, national government documents, statistical databases, blogs, articles, white papers and others. From the annual report, we analyse a company’s revenue to understand the key segment and market share of that organization in a particular region. We analyse the company websites and adopt the product mapping technique which is important for deriving the segment revenue. In the product mapping method, we select and categorize the products offered by the companies catering to domain specific market, deduce the product revenue for each of the companies so as to get overall estimation of the market size. We also source data and analyses trends based on information received from supply side and demand side intermediaries in the value chain. The supply side denotes the data gathered from supplier, distributor, wholesaler and the demand side illustrates the data gathered from the end customers for respective market domain.

The supply side for a domain specific market is analysed by:
The demand side for the market is estimated through:
In-house Library: Apart from these third-party sources, we have our in-house library of qualitative and quantitative information. Our in-house database includes market data for various industry and domains. These data are updated on regular basis as per the changing market scenario. Our library includes, historic databases, internal audit reports and archives.
Sometimes there are instances where there is no metadata or raw data available for any domain specific market. For those cases, we use our expertise to forecast and estimate the market size in order to generate comprehensive data sets. Our analyst team adopt a robust research technique in order to produce the estimates:
Data Synthesis: This stage involves the analysis & mapping of all the information obtained from the previous step. It also involves in scrutinizing the data for any discrepancy observed while data gathering related to the market. The data is collected with consideration to the heterogeneity of sources. Robust scientific techniques are in place for synthesizing disparate data sets and provide the essential contextual information that can orient market strategies. The Brainy Insights has extensive experience in data synthesis where the data passes through various stages:


Market Deduction & Formulation: The final stage comprises of assigning data points at appropriate market spaces so as to deduce feasible conclusions. Analyst perspective & subject matter expert based holistic form of market sizing coupled with industry analysis also plays a crucial role in this stage.
This stage involves in finalization of the market size and numbers that we have collected from data integration step. With data interpolation, it is made sure that there is no gap in the market data. Successful trend analysis is done by our analysts using extrapolation techniques, which provide the best possible forecasts for the market.
Data Validation & Market Feedback: Validation is the most important step in the process. Validation & re-validation via an intricately designed process helps us finalize data-points to be used for final calculations.

The Brainy Insights interacts with leading companies and experts of the concerned domain to develop the analyst team’s market understanding and expertise. It improves and substantiates every single data presented in the market reports. The data validation interview and discussion panels are typically composed of the most experienced industry members. The participants include, however, are not limited to:
Moreover, we always validate our data and findings through primary respondents from all the major regions we are working on.


Free Customization
Fortune 500 Clients
Free Yearly Update On Purchase Of Multi/Corporate License
Companies Served Till Date