- +1-315-215-1633
- sales@thebrainyinsights.com

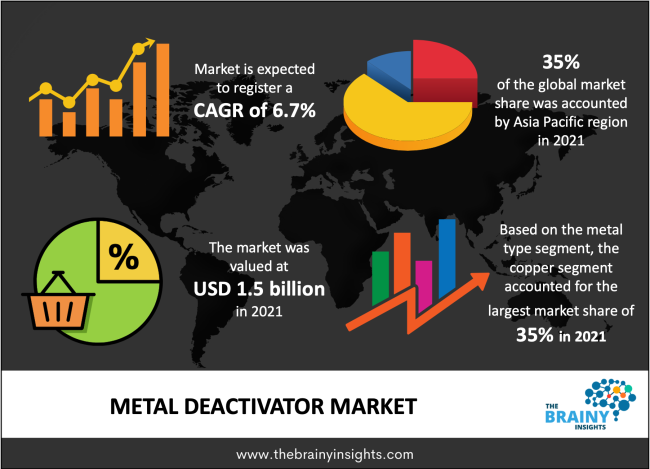
The metal deactivator market was estimated at around USD 1.5 billion in 2021, growing at a CAGR of nearly 6.7% during 2022-2030. The market is projected to reach approximately USD 2.7 billion by 2030.
Metal ions can speed up the oxidation of polymers, hence metal deactivators are specialized phenolic antioxidants with functional groups that allow them to bind with and deactivate metal ions. They are widely used in the insulation of wire and cables to shield plastics from contact with metals like copper during use. Metal deactivator additives (MDA) are gasoline and oil additives that are extremely effective at counteracting the catalytic consequences of oxidation in lubricants, such as corrosion and discoloration. Antioxidant-based alternatives have substantial financial ramifications since they prevent metal oxidation and pollution. Metal deactivator chemicals are therefore used sparingly in a variety of industrial and automotive applications in order to cut costs.
a rise in demand for metals including copper, copper alloys, and non-ferric alloys in a variety of industrial uses. As a result, the use of these metals in industrial applications emphasizes the requirement for additives to counteract the damaging effects of corrosion and staining. Due to a rise in the introduction of industrial and consumer goods, emerging regions like the Middle East and Asia-Pacific are anticipated to have rapid growth. Additionally, producers should benefit from the automation.
Get an overview of this study by requesting a free sample
Worldwide, the COVID-19 pandemic has had an impact on a wide range of businesses. COVID has a significant negative influence on the car industry, which has seen a sharp fall in sales. This has also slowed the development of metal deactivators. The textile, oil and gas, and automotive industries had all experienced a slump. The International Organization of Motor Vehicle Manufacturers estimates that the world's motor vehicle output decreased by 16% in 2020. The US suffered a reduction in motor vehicle manufacturing of 19%, while the entire continent of Europe saw a decline of 21.6%. Production of motor vehicles fell sharply in all major manufacturing nations, ranging from 11% to roughly 40%. As a result, compared to the years before the pandemic, the overall demand for metal deactivators decreased.
Increasing utilization in aviation to accelerate the market’s growth
As deposits build up on heat exchangers, nozzles, and servo controls, surface fouling in aircraft fuels caused by autoxidation of aviation fuel reduces efficiency and could ultimately result in system failure. Surface fouling is made worse by metal surfaces and minute amounts of metals dissolved in fuels, which catalyze free-radical initiation and speed up autoxidation. To lessen insolubility in various fuels, several additives and metal deactivators are applied. Metal deactivator has been recommended as an additional component to be included in all fuels, even those without dissolved metals, due to metal chelation and potential metal-surface passivation. Military and civil aerospace are expected to earn US$ 253 billion and USD 263 billion in revenue, respectively, in 2020, according to the World Economic Forum. Therefore, metal deactivators will also be employed in other fuel tanks and were very helpful in lowering autoxidation in aviation fuels. As a result, it is heavily utilized in aircraft to stop oxidation.
A rise in usage for wind turbines
The architecture of wind turbines is being compacted daily, and they are operating in more demanding situations. It provides a variety of additives for high temperature, excessive pressure, antioxidants, rush inhibitors, corrosion inhibitors, and other factors. As a lubricant additive, the metal deactivator works to prevent the catalytic effects of metals on oxidation and corrosion. Metal deactivators are used to ensure the turbine works well with other metal equipment. Since more than 60 years ago, metal deactivator additives (MDA) have been employed to stop metal-catalyzed oxidation reactions in petroleum products. Metal deactivators are hypothesized to work in two different ways: first, by passivating active sites on metal surfaces, and second, by chelating (binding) dissolved metal ions. The average profit made by small and medium-sized businesses in the manufacturing of turbine generators and turbines in 2020, according to the Government of Canada, was USD 743.9k. As a result of its efficient operation, it is frequently utilized in turbines.
The metal deactivator market is segmented into the metal type, and application. Based on metal type, the market for copper segment is estimated to lead the market during the forecast period. In order to stop dissolved metals from deteriorating fuels and lubricants, metal deactivators interact with them. Copper ions serve as reaction sites, accelerating the auto-oxidation processes in fuels and oils that result in the buildup of deposits and gums. By disguising them, metal deactivator compounds reduce the catalytic activity of these dissolved metals. According to one of the experts, copper is one of the most prevalent elements that, when oxidized, may result in unfavorable changes in strength or features. Copper is also one of the main metals that metal deactivators inhibit. By inhibiting unfavorable surface interactions, the metal deactivator benzotriazole is a fantastic illustration of a successful metal deactivator for copper and its alloys. During the Jet Fuel Thermal Oxidation Test (JFTOT), copper acts as a metal deactivator and encourages the thermal deposition of jet fuel.
By application, the gasoline is anticipated to dominant the metal deactivator market during the forecast period. Gasoline additives are crucial in the treatment of fuels to enhance their qualities and bring them up to required standards. Oxidants and metal deactivators are two subgroups of additives that can be found in gasoline. Metal deactivators are used to stop metals like copper, iron, or nickel that are present in gasoline from acting as catalysts for oxidation reactions. Metal deactivators prevent these ions from catalyzing reactions, which delays the development of sticky residues. N,N-disalicylidene-l,2-propanediamine is the most often utilized meta deactivator. The major goal of utilizing metal deactivators in gasoline is to stop the metals from acting as catalysts for oxidation reactions.
In 2021, the metal deactivator market will be dominated by the Asia Pacific region, which will hold a share of more than 35%. China, Japan, and India are a few of the top producers of metal deactivators in the Asia-Pacific region. It is developed in a customized, cost-effective gear additive package that can improve oxidative characteristics, extreme pressure performance, and many other factors in order to increase sales in India. In terms of production, the Asia-Pacific region holds a greater part of the market for metal deactivators as a result of rising demand from end-use sectors like the textile, oil, and gas, among others. In Asia-Pacific, the automotive industry has mostly driven up metal deactivator output.
According to the Society of Indian Automobile Manufacturers, the automobile sector produced a total of 22,933,230 vehicles between April 2021 and March 2022, including passenger and commercial vehicles as well as two-, three-, and quadricycles. As a result, the demands of the end industries are driving up growth in the Asia-Pacific region.
Throughout the projection period, North America is predicted to continue to be one of the most alluring marketplaces. The metal deactivators market is projected to have several growth prospects due to the expansion of end-use industries including the automotive and polymer sectors.
The global Metal deactivator market is segmented as follows:
By Metal Type
By Application
By Region/Geography
| Attribute | Description |
|---|---|
| Base Year | 2021 |
| Forecast period | 2022-2030 |
| Report Coverage | Revenue estimation and forecast, company profile, competitive landscape, growth factors, and recent trends |
| Regional scope | North America, Europe, Asia Pacific, Middle East & Africa, and Latin America |
| Market Size(unit) | USD Billion |
| CAGR (2022 to 2030) | 6.7% |
| Segments Covered |
By Metal Type |
1. Introduction
1.1. Objectives of the Study
1.2. Market Definition
1.3. Research Scope
2. Research Methodology and Assumptions
3. Executive Summary
4. Premium Insights
4.1. Porter’s Five Forces Analysis
4.2. Value Chain Analysis
4.3. Top Investment Pockets
4.3.1. Market Attractiveness Analysis By Metal Type
4.3.2. Market Attractiveness Analysis By Application
4.4. Industry Trends
5. Market Dynamics
5.1. Market Evaluation
5.2. Drivers
5.2.1. Increasing utilization in aviation to accelerate the market’s growth
5.2.2. A rise in usage for wind turbines
5.3. Restrains
5.3.1. Fluctuating prices would hamper the market
5.4. Opportunities
5.4.1. Growing applications of metal deactivators products
6. Global Metal Deactivator Market Analysis and Forecast, By Metal Type
6.1. Segment Overview
6.2. Copper
6.3. Cobalt
6.4. Nickel
6.5. Lead
6.6. Iron
6.7. Steel
6.8. Aluminum
6.9. Others
7. Global Metal Deactivator Market Analysis and Forecast, By Application
7.1. Segment Overview
7.2. Gasoline
7.3. Middle Distillates
7.4. Jet Fuel
7.5. Turbine
7.6. Diesel
7.7. Wire and Cable Insulation
7.8. Heating Oil
7.9. Grease
7.10. Hydraulic Oils
7.11. Others
8. Global Metal Deactivator Market Analysis and Forecast, By Regional Analysis
8.1. Segment Overview
8.2. North America
8.2.1. U.S.
8.2.2. Canada
8.2.3. Mexico
8.3. Europe
8.3.1. Germany
8.3.2. France
8.3.3. U.K.
8.3.4. Italy
8.3.5. Spain
8.3.6. Rest of Europe
8.4. Asia-Pacific
8.4.1. Japan
8.4.2. China
8.4.3. India
8.4.4. Australia
8.4.5. South Korea
8.4.6. Rest of Asia-Pacific
8.5. South America
8.5.1. Brazil
8.5.2. Argentina
8.5.3. Rest of South America
8.6. Middle East and Africa
8.6.1. UAE
8.6.2. South Africa
8.6.3. Egypt
8.6.4. Kuwait
8.6.5. Saudi Arabia
8.6.6. Rest of Middle East & Africa
9. Global Metal Deactivator Market-Competitive Landscape
9.1. Overview
9.2. Market Share of Key Players in the Metal Deactivator market
9.2.1. Global Company Market Share
9.2.2. North America Company Market Share
9.2.3. Europe Company Market Share
9.2.4. APAC Company Market Share
9.3. Competitive Situations and Trends
9.3.1. Metal Type Launches and Developments
9.3.2. Partnerships, Collaborations, and Agreements
9.3.3. Mergers & Acquisitions
9.3.4. Expansions
10. Company Profiles
10.1. Du Pont
10.1.1. Business Overview
10.1.2. Company Snapshot
10.1.3. Company Market Share Analysis
10.1.4. Company Application Portfolio
10.1.5. Recent Developments
10.1.6. SWOT Analysis
10.2. BASF SE
10.2.1. Business Overview
10.2.2. Company Snapshot
10.2.3. Company Market Share Analysis
10.2.4. Company Application Portfolio
10.2.5. Recent Developments
10.2.6. SWOT Analysis
10.3. Clariant AG
10.3.1. Business Overview
10.3.2. Company Snapshot
10.3.3. Company Market Share Analysis
10.3.4. Company Application Portfolio
10.3.5. Recent Developments
10.3.6. SWOT Analysis
10.4. The Lubrizol Corporation
10.4.1. Business Overview
10.4.2. Company Snapshot
10.4.3. Company Market Share Analysis
10.4.4. Company Application Portfolio
10.4.5. Recent Developments
10.4.6. SWOT Analysis
10.5. RT Vanderbilt Holding Company, Inc.
10.5.1. Business Overview
10.5.2. Company Snapshot
10.5.3. Company Market Share Analysis
10.5.4. Company Application Portfolio
10.5.5. Recent Developments
10.5.6. SWOT Analysis
10.6. ADEKA CORPORATION
10.6.1. Business Overview
10.6.2. Company Snapshot
10.6.3. Company Market Share Analysis
10.6.4. Company Application Portfolio
10.6.5. Recent Developments
10.6.6. SWOT Analysis
10.7. Afton Chemical Corporation
10.7.1. Business Overview
10.7.2. Company Snapshot
10.7.3. Company Market Share Analysis
10.7.4. Company Application Portfolio
10.7.5. Recent Developments
10.7.6. SWOT Analysis
10.8. Mayzo Inc.
10.8.1. Business Overview
10.8.2. Company Snapshot
10.8.3. Company Market Share Analysis
10.8.4. Company Application Portfolio
10.8.5. Recent Developments
10.8.6. SWOT Analysis
10.9. Dorf Ketal Chemicals India Private Limited
10.9.1. Business Overview
10.9.2. Company Snapshot
10.9.3. Company Market Share Analysis
10.9.4. Company Application Portfolio
10.9.5. Recent Developments
10.9.6. SWOT Analysis
10.10. Innospec Inc.
10.10.1. Business Overview
10.10.2. Company Snapshot
10.10.3. Company Market Share Analysis
10.10.4. Company Application Portfolio
10.10.5. Recent Developments
10.10.6. SWOT Analysis
List of Table
1. Global Metal Deactivator Market, By Metal Type, 2022-2030(USD Billion)
2. Global Copper Metal Deactivator Market, By Region, 2022-2030(USD Billion)
3. Global Cobalt Metal Deactivator Market, By Region, 2022-2030(USD Billion)
4. Global Nickel Metal Deactivator Market, By Region, 2022-2030(USD Billion)
5. Global Lead Metal Deactivator Market, By Region, 2022-2030(USD Billion)
6. Global Iron Metal Deactivator Market, By Region, 2022-2030(USD Billion)
7. Global Steel Polymer Metal Deactivator Market, By Region, 2022-2030(USD Billion)
8. Global Aluminum Metal Deactivator Market, By Region, 2022-2030(USD Billion)
9. Global Others Metal Deactivator Market, By Region, 2022-2030(USD Billion)
10. Global Metal Deactivator Market, By Application, 2022-2030(USD Billion)
11. Global Gasoline Metal Deactivator Market, By Region, 2022-2030(USD Billion)
12. Global Middle Distillates Metal Deactivator Market, By Region, 2022-2030(USD Billion)
13. Global Jet Fuel Metal Deactivator Market, By Region, 2022-2030(USD Billion)
14. Global Turbine Metal Deactivator Market, By Region, 2022-2030(USD Billion)
15. Global Diesel Metal Deactivator Market, By Region, 2022-2030(USD Billion)
16. Global Wire and Cable Insulation Metal Deactivator Market, By Region, 2022-2030(USD Billion)
17. Global Heating Oil Metal Deactivator Market, By Region, 2022-2030(USD Billion)
18. Global Grease Metal Deactivator Market, By Region, 2022-2030(USD Billion)
19. Global Hydraulic Oils Metal Deactivator Market, By Region, 2022-2030(USD Billion)
20. Global Others Metal Deactivator Market, By Region, 2022-2030(USD Billion)
21. Global Metal Deactivator Market, By Region, 2022-2030(USD Billion)
22. Global Metal Deactivator Market, By North America, 2022-2030(USD Billion)
23. North America Metal Deactivator Market, By Metal Type, 2022-2030(USD Billion)
24. North America Metal Deactivator Market, By Application, 2022-2030(USD Billion)
25. U.S. Metal Deactivator Market, By Metal Type, 2022-2030(USD Billion)
26. U.S. Metal Deactivator Market, By Application, 2022-2030(USD Billion)
27. Canada Metal Deactivator Market, By Metal Type, 2022-2030(USD Billion)
28. Canada Metal Deactivator Market, By Application, 2022-2030(USD Billion)
29. Mexico Metal Deactivator Market, By Metal Type, 2022-2030(USD Billion)
30. Mexico Metal Deactivator Market, By Application, 2022-2030(USD Billion)
31. Europe Metal Deactivator Market, By Metal Type, 2022-2030(USD Billion)
32. Europe Metal Deactivator Market, By Application, 2022-2030(USD Billion)
33. Germany Metal Deactivator Market, By Metal Type, 2022-2030(USD Billion)
34. Germany Metal Deactivator Market, By Application, 2022-2030(USD Billion)
35. France Metal Deactivator Market, By Metal Type, 2022-2030(USD Billion)
36. France Metal Deactivator Market, By Application, 2022-2030(USD Billion)
37. U.K. Metal Deactivator Market, By Metal Type, 2022-2030(USD Billion)
38. U.K. Metal Deactivator Market, By Application, 2022-2030(USD Billion)
39. Italy Metal Deactivator Market, By Metal Type, 2022-2030(USD Billion)
40. Italy Metal Deactivator Market, By Application, 2022-2030(USD Billion)
41. Spain Metal Deactivator Market, By Metal Type, 2022-2030(USD Billion)
42. Spain Metal Deactivator Market, By Application, 2022-2030(USD Billion)
43. Rest of Europe Metal Deactivator Market, By Metal Type, 2022-2030(USD Billion)
44. Rest of Europe Metal Deactivator Market, By Application, 2022-2030(USD Billion)
45. Asia Pacific Metal Deactivator Market, By Metal Type, 2022-2030(USD Billion)
46. Asia Pacific Metal Deactivator Market, By Application, 2022-2030(USD Billion)
47. Japan Metal Deactivator Market, By Metal Type, 2022-2030(USD Billion)
48. Japan Metal Deactivator Market, By Application, 2022-2030(USD Billion)
49. China Metal Deactivator Market, By Metal Type, 2022-2030(USD Billion)
50. China Metal Deactivator Market, By Application, 2022-2030(USD Billion)
51. India Metal Deactivator Market, By Metal Type, 2022-2030(USD Billion)
52. India Metal Deactivator Market, By Application, 2022-2030(USD Billion)
53. Australia Metal Deactivator Market, By Metal Type, 2022-2030(USD Billion)
54. Australia Metal Deactivator Market, By Application, 2022-2030(USD Billion)
55. South Korea Metal Deactivator Market, By Metal Type, 2022-2030(USD Billion)
56. South Korea Metal Deactivator Market, By Application, 2022-2030(USD Billion)
57. Rest of Asia-Pacific Metal Deactivator Market, By Metal Type, 2022-2030(USD Billion)
58. Rest of Asia-Pacific Metal Deactivator Market, By Application, 2022-2030(USD Billion)
59. South America Metal Deactivator Market, By Metal Type, 2022-2030(USD Billion)
60. South America Metal Deactivator Market, By Application, 2022-2030(USD Billion)
61. Brazil Metal Deactivator Market, By Metal Type, 2022-2030(USD Billion)
62. Brazil Metal Deactivator Market, By Application, 2022-2030(USD Billion)
63. Argentina Metal Deactivator Market, By Metal Type, 2022-2030(USD Billion)
64. Argentina Metal Deactivator Market, By Application, 2022-2030(USD Billion)
65. Rest of Latin America Metal Deactivator Market, By Metal Type, 2022-2030(USD Billion)
66. Rest of Latin America Metal Deactivator Market, By Application, 2022-2030(USD Billion)
67. Middle East and Africa Metal Deactivator Market, By Metal Type, 2022-2030(USD Billion)
68. Middle East and Africa Metal Deactivator Market, By Application, 2022-2030(USD Billion)
69. UAE Metal Deactivator Market, By Metal Type, 2022-2030(USD Billion)
70. UAE Metal Deactivator Market, By Application, 2022-2030(USD Billion)
71. South Africa Metal Deactivator Market, By Metal Type, 2022-2030(USD Billion)
72. South Africa Metal Deactivator Market, By Application, 2022-2030(USD Billion)
73. Egypt Metal Deactivator Market, By Metal Type, 2022-2030(USD Billion)
74. Egypt Metal Deactivator Market, By Application, 2022-2030(USD Billion)
75. Kuwait Metal Deactivator Market, By Metal Type, 2022-2030(USD Billion)
76. Kuwait Metal Deactivator Market, By Application, 2022-2030(USD Billion)
77. Saudi Arabia Metal Deactivator Market, By Metal Type, 2022-2030(USD Billion)
78. Saudi Arabia Metal Deactivator Market, By Application, 2022-2030(USD Billion)
79. Rest of Middle East Metal Deactivator Market, By Metal Type, 2022-2030(USD Billion)
80. Rest of Middle East Metal Deactivator Market, By Application, 2022-2030(USD Billion)
List of Figures
1. Global Metal Deactivator Market Segmentation
2. Metal Deactivator Market: Research Methodology
3. Market Size Estimation Methodology: Bottom-Up Approach
4. Market Size Estimation Methodology: Top-Down Approach
5. Data Triangulation
6. Porter’s Five Forces Analysis
7. Value Chain Analysis
8. Global Metal Deactivator Market Attractiveness Analysis By Metal Type
9. Global Metal Deactivator Market Attractiveness Analysis By Application
10. Global Metal Deactivator Market Attractiveness Analysis By Region
11. Global Metal Deactivator Market: Dynamics
12. Global Metal Deactivator Market Share By Metal Type(2022 & 2030)
13. Global Metal Deactivator Market Share By Application(2022 & 2030)
14. Global Metal Deactivator Market Share by Regions (2022 & 2030)
15. Global Metal Deactivator Market Share by Company (2021)
By Metal Type
By Application
By Region/Geography
Research has its special purpose to undertake marketing efficiently. In this competitive scenario, businesses need information across all industry verticals; the information about customer wants, market demand, competition, industry trends, distribution channels etc. This information needs to be updated regularly because businesses operate in a dynamic environment. Our organization, The Brainy Insights incorporates scientific and systematic research procedures in order to get proper market insights and industry analysis for overall business success. The analysis consists of studying the market from a miniscule level wherein we implement statistical tools which helps us in examining the data with accuracy and precision.
Our research reports feature both; quantitative and qualitative aspects for any market. Qualitative information for any market research process are fundamental because they reveal the customer needs and wants, usage and consumption for any product/service related to a specific industry. This in turn aids the marketers/investors in knowing certain perceptions of the customers. Qualitative research can enlighten about the different product concepts and designs along with unique service offering that in turn, helps define marketing problems and generate opportunities. On the other hand, quantitative research engages with the data collection process through interviews, e-mail interactions, surveys and pilot studies. Quantitative aspects for the market research are useful to validate the hypotheses generated during qualitative research method, explore empirical patterns in the data with the help of statistical tools, and finally make the market estimations.
The Brainy Insights offers comprehensive research and analysis, based on a wide assortment of factual insights gained through interviews with CXOs and global experts and secondary data from reliable sources. Our analysts and industry specialist assume vital roles in building up statistical tools and analysis models, which are used to analyse the data and arrive at accurate insights with exceedingly informative research discoveries. The data provided by our organization have proven precious to a diverse range of companies, facilitating them to address issues such as determining which products/services are the most appealing, whether or not customers use the product in the manner anticipated, the purchasing intentions of the market and many others.
Our research methodology encompasses an idyllic combination of primary and secondary initiatives. Key phases involved in this process are listed below:

The phase involves the gathering and collecting of market data and its related information with the help of different sources & research procedures.

The data procurement stage involves in data gathering and collecting through various data sources.
This stage involves in extensive research. These data sources includes:
Purchased Database: Purchased databases play a crucial role in estimating the market sizes irrespective of the domain. Our purchased database includes:
Primary Research: The Brainy Insights interacts with leading companies and experts of the concerned domain to develop the analyst team’s market understanding and expertise. It improves and substantiates every single data presented in the market reports. Primary research mainly involves in telephonic interviews, E-mail interactions and face-to-face interviews with the raw material providers, manufacturers/producers, distributors, & independent consultants. The interviews that we conduct provides valuable data on market size and industry growth trends prevailing in the market. Our organization also conducts surveys with the various industry experts in order to gain overall insights of the industry/market. For instance, in healthcare industry we conduct surveys with the pharmacists, doctors, surgeons and nurses in order to gain insights and key information of a medical product/device/equipment which the customers are going to usage. Surveys are conducted in the form of questionnaire designed by our own analyst team. Surveys plays an important role in primary research because surveys helps us to identify the key target audiences of the market. Additionally, surveys helps to identify the key target audience engaged with the market. Our survey team conducts the survey by targeting the key audience, thus gaining insights from them. Based on the perspectives of the customers, this information is utilized to formulate market strategies. Moreover, market surveys helps us to understand the current competitive situation of the industry. To be precise, our survey process typically involve with the 360 analysis of the market. This analytical process begins by identifying the prospective customers for a product or service related to the market/industry to obtain data on how a product/service could fit into customers’ lives.

Secondary Research: The secondary data sources includes information published by the on-profit organizations such as World bank, WHO, company fillings, investor presentations, annual reports, national government documents, statistical databases, blogs, articles, white papers and others. From the annual report, we analyse a company’s revenue to understand the key segment and market share of that organization in a particular region. We analyse the company websites and adopt the product mapping technique which is important for deriving the segment revenue. In the product mapping method, we select and categorize the products offered by the companies catering to domain specific market, deduce the product revenue for each of the companies so as to get overall estimation of the market size. We also source data and analyses trends based on information received from supply side and demand side intermediaries in the value chain. The supply side denotes the data gathered from supplier, distributor, wholesaler and the demand side illustrates the data gathered from the end customers for respective market domain.

The supply side for a domain specific market is analysed by:
The demand side for the market is estimated through:
In-house Library: Apart from these third-party sources, we have our in-house library of qualitative and quantitative information. Our in-house database includes market data for various industry and domains. These data are updated on regular basis as per the changing market scenario. Our library includes, historic databases, internal audit reports and archives.
Sometimes there are instances where there is no metadata or raw data available for any domain specific market. For those cases, we use our expertise to forecast and estimate the market size in order to generate comprehensive data sets. Our analyst team adopt a robust research technique in order to produce the estimates:
Data Synthesis: This stage involves the analysis & mapping of all the information obtained from the previous step. It also involves in scrutinizing the data for any discrepancy observed while data gathering related to the market. The data is collected with consideration to the heterogeneity of sources. Robust scientific techniques are in place for synthesizing disparate data sets and provide the essential contextual information that can orient market strategies. The Brainy Insights has extensive experience in data synthesis where the data passes through various stages:


Market Deduction & Formulation: The final stage comprises of assigning data points at appropriate market spaces so as to deduce feasible conclusions. Analyst perspective & subject matter expert based holistic form of market sizing coupled with industry analysis also plays a crucial role in this stage.
This stage involves in finalization of the market size and numbers that we have collected from data integration step. With data interpolation, it is made sure that there is no gap in the market data. Successful trend analysis is done by our analysts using extrapolation techniques, which provide the best possible forecasts for the market.
Data Validation & Market Feedback: Validation is the most important step in the process. Validation & re-validation via an intricately designed process helps us finalize data-points to be used for final calculations.

The Brainy Insights interacts with leading companies and experts of the concerned domain to develop the analyst team’s market understanding and expertise. It improves and substantiates every single data presented in the market reports. The data validation interview and discussion panels are typically composed of the most experienced industry members. The participants include, however, are not limited to:
Moreover, we always validate our data and findings through primary respondents from all the major regions we are working on.


Free Customization
Fortune 500 Clients
Free Yearly Update On Purchase Of Multi/Corporate License
Companies Served Till Date