- +1-315-215-1633
- sales@thebrainyinsights.com

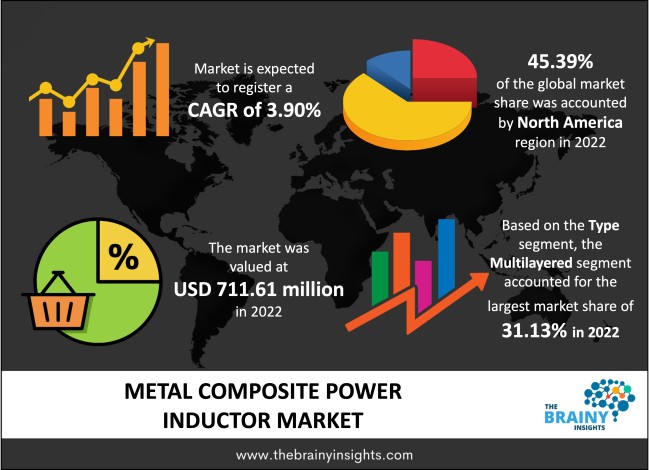
The global metal composite power inductor market was valued at USD 711.61 million in 2022, increasing at a CAGR of 3.90% from 2023 to 2032 and anticipated to reach USD 1043.27 million by 2032. Asia Pacific is expected to grow the fastest during the forecast period. Also, the growing usage of metal composite power inductors in automotive electronics and electric vehicles is anticipated to drive market growth during the forecast period.
Metal composite power inductors are two passive terminal components called reactors or coils. Metal composite power inductor offers high permeability for higher inductance, improved power supply efficiency, along with lower DC resistance (DCR). Metal composite power inductors are fast emerging as an ideal choice for modern mobile electronic designs. The trend of downsizing ECU power circuits is utilized in many electronic applications. Using metal composite power inductors aims to stabilize volatile circuits and decrease core losses. The end-user industries that operate metal composite power inductors are consumer electronics, aerospace & defence, automotive, industrial, healthcare, and IT & telecom. A few application areas of metal composite power inductors are module circuits, tuning circuits, filters, and DC-DC converters. Some other features include molded metal structure that reduces more significant current, short losses at advanced switching frequencies, acoustic noise, power, and miniature size.
Get an overview of this study by requesting a free sample
For Example, In February 2021. TDK Corporation launched MLI-H1005 inductors for use in NFC (near field communication).
The increasing use of electric vehicles: The rising demand for miniaturization and high-frequency applications in various end-use industries, such as consumer electronics, communications electronics, automotive electronics, and others, drives the market growth. Further, a substantial number of initiatives taken by the government of various countries, like subsidies & grants, tax rebates, and other non-financial advantages in car registration & access to carpool lanes anticipated to propel the sale of electric vehicles in the forthcoming years. Moreover, the high-end functionality they offer, such as the feature of a radial through-hole inductor, high saturation core material, small size, and maximum current, are expected to drive market growth.
The fluctuating prices of raw materials: The fluctuating prices of raw materials are the restraining factor of market growth. Moreover, the initial high costs of the electronic packaging technology also hinder the market growth during the forecast period.
The high disposable income of the consumers: The demand for high-quality military grade packaging in the aerospace & defence sector for aircraft guidance, naval warships, and others is propelling the market growth. Further, the rising need to downsize power circuits of electronic circuit units (ECU) of automotive components with higher current handling capability is also helping to boost the market growth over the forecast period. Moreover, the higher adoption of the latest technologies, high standard of living, and increasing trend of miniaturization in the consumer electronics industry are stimulating market growth during the forecast period. However, the increasing adoption of connected devices, such as security systems, home appliances, smart meters, gaming consoles, and smartphones across industries, is also propelling market growth.
The regions analyzed for the market include Europe, South America, Asia Pacific, North America, the Middle East, and Africa. North America emerged as the largest global metal composite power inductor market, with a 45.39% market revenue share in 2022. North America dominates the metal composite power inductor market due to the rising popularity of multilayer chip inductors in consumer electronics. However, the increasing use of multi-layered inductors in power electronics applications due to enhanced performance in energy storage devices is also helping to boost the market growth in this region. The rising spending on R&D of automotive technology and increasing competition among players to increase the integration of metal composite power inductors for automotive applications are the driving factors of the market growth in this region. Asia Pacific is expected to grow the fastest during the forecast period due to the increasing demand from end-use industries such as communication, automotive, computer, consumer electronics, and energy storage. Moreover, the rising production of automobile devices and the increase in focus on electric vehicles across the globe are propelling the market growth during the forecast period.
North America Region Metal Composite Power Inductor Market Share in 2022 - 45.39%
www.thebrainyinsights.com
Check the geographical analysis of this market by requesting a free sample
The type segment is divided into wire wound, multilayered, thin film type, and others. The multilayered segment dominated, with a market share of around 31.13% in 2022. This growth is attributed to the increasing trend of using multiple-layer inductors in automotive and industrial applications. Further, by 2032, the thin film type segment will likely dominate the market due to the increasing voltage needs in smartphones and tablets. Additionally, the lightweight composition & convenient installation and the rising demand for energy-efficient solutions are also helping to boost the segment’s market growth. However, the growth in the investments and expansions in the electric vehicle manufacturing units, coupled with the wide usage of wire wound metal power inductors for high frequency application is expected to boost the wire wound segment’s market growth.
The form segment is divided into DC-DC converters, tuning circuits, module circuits, and filters. In 2022, the DC-DC converters segment dominated the market with 32.16% and a revenue of USD 288.85 million. This growth is attributed to the increasing integration of technologies like near-field communication (NFC) in tablets and smartphones. However, the DC-DC converter is an instrument or a circuit that converts one direct current voltage to another. DC-DC converter is used to decrease or increase the voltage to deliver optimal voltage to the device. Further, by 2032, the module circuits segment will likely dominate the market due to the increased demand for data centres in developed and developing countries.
The mounting segment is divided into through hole and surface mount. In 2022, the surface mount segment dominated the market with 54.17% and a revenue of USD 385.47 million. This growth is attributed to the rising need for miniaturized consumer electronic products. The growing adoption and increasing use of digital entertainment are also propelling the segment’s market growth. Further, by 2032, the through-hole segment will likely dominate the market due to the increasing penetration of connected devices. Moreover, the essential growing methodologies to produce cutting-edge solutions for integrating flexible electronics, such as high-capacity batteries to provide compact electronic packaging, are also helping to boost the segment’s market growth.
The end-user segment is divided into consumer electronics, aerospace and defense, industrial, IT and telecom, healthcare, and others. In 2022, the consumer electronics segment dominated the market with 23.17% and a revenue of USD 164.88 million. This growth is attributed to the increasing trend of miniaturization in the consumer electronics industry. Further, by 2032, the aerospace and defense segment will likely dominate the market due to rapid industrialization and robust economic expansion.
| Attribute | Description |
|---|---|
| Market Size | Revenue (USD Million) |
| Market size value in 2022 | USD 711.61 Million |
| Market size value in 2032 | USD 1043.27 Million |
| CAGR (2023 to 2032) | 3.90% |
| Historical data | 2019-2021 |
| Base Year | 2022 |
| Forecast | 2023-2032 |
| Regional Segments | The key regions are North America, South America, Europe, Asia Pacific, and Middle East & Africa. |
| Segments | Key Segments are type, form, mounting, end-user, and regions |
North America region emerged as the largest market for metal composite power inductor.
The market's growth will be influenced by the increasing use of electric vehicles.
The fluctuating prices of raw materials could hamper the market growth.
The high disposable income of the consumers will provide huge opportunities to the market.
1. Introduction
1.1. Objectives of the Study
1.2. Market Definition
1.3. Research Scope
1.4. Currency
1.5. Key Target Audience
2. Research Methodology and Assumptions
3. Executive Summary
4. Premium Insights
4.1. Porter’s Five Forces Analysis
4.2. Value Chain Analysis
4.3. Top Investment Pockets
4.3.1. Market Attractiveness Analysis By Type
4.3.2. Market Attractiveness Analysis By Form
4.3.3. Market Attractiveness Analysis By Mounting
4.3.4. Market Attractiveness Analysis By End-Use
4.3.5. Market Attractiveness Analysis By Region
4.4. Industry Trends
5. Market Dynamics
5.1. Market Evaluation
5.2. Drivers
5.2.1. The increasing demand for customer electronics globally
5.2.2. The rising funding and investments by key market participants
5.2.3. The expansion of the Internet of Things (IoT) and 5G networks
5.2.4. The increasing demand for energy-efficient and reliable products
5.2.5. The growth in the automotive industry worldwide
5.3. Restraints
5.3.1. The fluctuating prices of raw materials
5.3.2. The lack of standardization
5.4. Opportunities
5.4.1. The high disposable income of the consumers
5.4.2. The increasing execution of 5G/6G Networks
1. Global Metal Composite Power Inductor Market Analysis and Forecast, By Type
1.1. Segment Overview
1.2. Wire Wound
1.3. Multilayered
1.4. Thin Film Type
1.5. Others
2. Global Metal Composite Power Inductor Market Analysis and Forecast, By Form
2.1. Segment Overview
2.2. DC-DC Converters
2.3. Tuning Circuits
2.4. Module Circuits
2.5. Filters
3. Global Metal Composite Power Inductor Market Analysis and Forecast, By Mounting
3.1. Segment Overview
3.2. Through Hole
3.3. Surface Mount
4. Global Metal Composite Power Inductor Market Analysis and Forecast, By End-Use
5.5. Segment Overview
5.6. Consumer Electronics
5.7. Aerospace and Defense
5.8. Industrial
5.9. IT and Telecom
5.10. Healthcare
5.11. Others
5. Global Metal Composite Power Inductor Market Analysis and Forecast, By Regional Analysis
5.1. Segment Overview
5.2. North America
5.2.1. U.S.
5.2.2. Canada
5.2.3. Mexico
5.3. Europe
5.3.1. Germany
5.3.2. France
5.3.3. U.K.
5.3.4. Italy
5.3.5. Spain
5.4. Asia-Pacific
5.4.1. Japan
5.4.2. China
5.4.3. India
5.5. South America
5.5.1. Brazil
5.6. Middle East and Africa
5.6.1. UAE
5.6.2. South Africa
6. Global Metal Composite Power Inductor Market-Competitive Landscape
6.1. Overview
6.2. Market Share of Key Players in Global Metal Composite Power Inductor Market
6.2.1. Global Company Market Share
6.2.2. North America Company Market Share
6.2.3. Europe Company Market Share
6.2.4. APAC Company Market Share
6.3. Competitive Situations and Trends
6.3.1. Product Launches and Developments
6.3.2. Partnerships, Collaborations, and Agreements
6.3.3. Mergers & Acquisitions
6.3.4. Expansions
7. Company Profiles
7.1. Wurth Electronics Inc.
7.1.1. Business Overview
7.1.2. Company Snapshot
7.1.3. Company Market Share Analysis
7.1.4. Company Product Portfolio
7.1.5. Recent Developments
7.1.6. SWOT Analysis
7.2. Bourns Inc.
7.2.1. Business Overview
7.2.2. Company Snapshot
7.2.3. Company Market Share Analysis
7.2.4. Company Product Portfolio
7.2.5. Recent Developments
7.2.6. SWOT Analysis
7.3. Abracon LLC
7.3.1. Business Overview
7.3.2. Company Snapshot
7.3.3. Company Market Share Analysis
7.3.4. Company Product Portfolio
7.3.5. Recent Developments
7.3.6. SWOT Analysis
7.4. KEMET
7.4.1. Business Overview
7.4.2. Company Snapshot
7.4.3. Company Market Share Analysis
7.4.4. Company Product Portfolio
7.4.5. Recent Developments
7.4.6. SWOT Analysis
7.5. Cyntec Co., Ltd.
7.5.1. Business Overview
7.5.2. Company Snapshot
7.5.3. Company Market Share Analysis
7.5.4. Company Product Portfolio
7.5.5. Recent Developments
7.5.6. SWOT Analysis
7.6. Murata Manufacturing Co., Ltd.
7.6.1. Business Overview
7.6.2. Company Snapshot
7.6.3. Company Market Share Analysis
7.6.4. Company Product Portfolio
7.6.5. Recent Developments
7.6.6. SWOT Analysis
7.7. Little Fuse
7.7.1. Business Overview
7.7.2. Company Snapshot
7.7.3. Company Market Share Analysis
7.7.4. Company Product Portfolio
7.7.5. Recent Developments
7.7.6. SWOT Analysis
7.8. NIC Components Corp.
7.8.1. Business Overview
7.8.2. Company Snapshot
7.8.3. Company Market Share Analysis
7.8.4. Company Product Portfolio
7.8.5. Recent Developments
7.8.6. SWOT Analysis
7.9. Pulse Electronics
7.9.1. Business Overview
7.9.2. Company Snapshot
7.9.3. Company Market Share Analysis
7.9.4. Company Product Portfolio
7.9.5. Recent Developments
7.9.6. SWOT Analysis
7.10. SUMIDA CORPORATION
7.10.1. Business Overview
7.10.2. Company Snapshot
7.10.3. Company Market Share Analysis
7.10.4. Company Product Portfolio
7.10.5. Recent Developments
7.10.6. SWOT Analysis
7.11. SAMSUNG ELECTRO-MECHANICS
7.11.1. Business Overview
7.11.2. Company Snapshot
7.11.3. Company Market Share Analysis
7.11.4. Company Product Portfolio
7.11.5. Recent Developments
7.11.6. SWOT Analysis
7.12. Panasonic Industry Europe GmbH
7.12.1. Business Overview
7.12.2. Company Snapshot
7.12.3. Company Market Share Analysis
7.12.4. Company Product Portfolio
7.12.5. Recent Developments
7.12.6. SWOT Analysis
7.13. TDK Corporation
7.13.1. Business Overview
7.13.2. Company Snapshot
7.13.3. Company Market Share Analysis
7.13.4. Company Product Portfolio
7.13.5. Recent Developments
7.13.6. SWOT Analysis
7.14. TAIYO YUDEN CO., LTD.
7.14.1. Business Overview
7.14.2. Company Snapshot
7.14.3. Company Market Share Analysis
7.14.4. Company Product Portfolio
7.14.5. Recent Developments
7.14.6. SWOT Analysis
7.15. Vishay Intertechnology, Inc.
7.15.1. Business Overview
7.15.2. Company Snapshot
7.15.3. Company Market Share Analysis
7.15.4. Company Product Portfolio
7.15.5. Recent Developments
7.15.6. SWOT Analysis
7.16. Viking Tech Corporation,
7.16.1. Business Overview
7.16.2. Company Snapshot
7.16.3. Company Market Share Analysis
7.16.4. Company Product Portfolio
7.16.5. Recent Developments
7.16.6. SWOT Analysis
List of Table
1. Global Metal Composite Power Inductor Market, By Type, 2019-2032 (USD Million)
2. Global Wire Wound, Metal Composite Power Inductor Market, By Region, 2019-2032 (USD Million)
3. Global Multilayered, Metal Composite Power Inductor Market, By Region, 2019-2032 (USD Million)
4. Global Thin Film Type, Metal Composite Power Inductor Market, By Region, 2019-2032 (USD Million)
5. Global Others, Metal Composite Power Inductor Market, By Region, 2019-2032 (USD Million)
6. Global Metal Composite Power Inductor Market, By Form, 2019-2032 (USD Million)
7. Global DC-DC Converters, Metal Composite Power Inductor Market, By Region, 2019-2032 (USD Million)
8. Global Tuning Circuits, Metal Composite Power Inductor Market, By Region, 2019-2032 (USD Million)
9. Global Module Circuits, Metal Composite Power Inductor Market, By Region, 2019-2032 (USD Million)
10. Global Filters, Metal Composite Power Inductor Market, By Region, 2019-2032 (USD Million)
11. Global Metal Composite Power Inductor Market, By Mounting, 2019-2032 (USD Million)
12. Global Through Hole, Metal Composite Power Inductor Market, By Region, 2019-2032 (USD Million)
13. Global Surface Mount, Metal Composite Power Inductor Market, By Region, 2019-2032 (USD Million)
14. Global Metal Composite Power Inductor Market, By End-Use, 2019-2032 (USD Million)
15. Global Consumer Electronics, Metal Composite Power Inductor Market, By Region, 2019-2032 (USD Million)
16. Global Aerospace and Defense, Metal Composite Power Inductor Market, By Region, 2019-2032 (USD Million)
17. Global Industrial, Metal Composite Power Inductor Market, By Region, 2019-2032 (USD Million)
18. Global IT and Telecom, Metal Composite Power Inductor Market, By Region, 2019-2032 (USD Million)
19. Global Healthcare, Metal Composite Power Inductor Market, By Region, 2019-2032 (USD Million)
20. Global Others, Metal Composite Power Inductor Market, By Region, 2019-2032 (USD Million)
21. North America Metal Composite Power Inductor Market, By Type, 2019-2032 (USD Million)
22. North America Metal Composite Power Inductor Market, By Form, 2019-2032 (USD Million)
23. North America Metal Composite Power Inductor Market, By Mounting, 2019-2032 (USD Million)
24. North America Metal Composite Power Inductor Market, By End-Use, 2019-2032 (USD Million)
25. U.S. Metal Composite Power Inductor Market, By Type, 2019-2032 (USD Million)
26. U.S. Metal Composite Power Inductor Market, By Form, 2019-2032 (USD Million)
27. U.S. Metal Composite Power Inductor Market, By Mounting, 2019-2032 (USD Million)
28. U.S. Metal Composite Power Inductor Market, By End-Use, 2019-2032 (USD Million)
29. Canada Metal Composite Power Inductor Market, By Type, 2019-2032 (USD Million)
30. Canada Metal Composite Power Inductor Market, By Form, 2019-2032 (USD Million)
31. Canada Metal Composite Power Inductor Market, By Mounting, 2019-2032 (USD Million)
32. Canada Metal Composite Power Inductor Market, By End-Use, 2019-2032 (USD Million)
33. Mexico Metal Composite Power Inductor Market, By Type, 2019-2032 (USD Million)
34. Mexico Metal Composite Power Inductor Market, By Form, 2019-2032 (USD Million)
35. Mexico Metal Composite Power Inductor Market, By Mounting, 2019-2032 (USD Million)
36. Mexico Metal Composite Power Inductor Market, By End-Use, 2019-2032 (USD Million)
37. Europe Metal Composite Power Inductor Market, By Type, 2019-2032 (USD Million)
38. Europe Metal Composite Power Inductor Market, By Form, 2019-2032 (USD Million)
39. Europe Metal Composite Power Inductor Market, By Mounting, 2019-2032 (USD Million)
40. Europe Metal Composite Power Inductor Market, By End-Use, 2019-2032 (USD Million)
41. Germany Metal Composite Power Inductor Market, By Type, 2019-2032 (USD Million)
42. Germany Metal Composite Power Inductor Market, By Form, 2019-2032 (USD Million)
43. Germany Metal Composite Power Inductor Market, By Mounting, 2019-2032 (USD Million)
44. Germany Metal Composite Power Inductor Market, By End-Use, 2019-2032 (USD Million)
45. France Metal Composite Power Inductor Market, By Type, 2019-2032 (USD Million)
46. France Metal Composite Power Inductor Market, By Form, 2019-2032 (USD Million)
47. France Metal Composite Power Inductor Market, By Mounting, 2019-2032 (USD Million)
48. France Metal Composite Power Inductor Market, By End-Use, 2019-2032 (USD Million)
49. U.K. Metal Composite Power Inductor Market, By Type, 2019-2032 (USD Million)
50. U.K. Metal Composite Power Inductor Market, By Form, 2019-2032 (USD Million)
51. U.K. Metal Composite Power Inductor Market, By Mounting, 2019-2032 (USD Million)
52. U.K. Metal Composite Power Inductor Market, By End-Use, 2019-2032 (USD Million)
53. Italy Metal Composite Power Inductor Market, By Type, 2019-2032 (USD Million)
54. Italy Metal Composite Power Inductor Market, By Form, 2019-2032 (USD Million)
55. Italy Metal Composite Power Inductor Market, By Mounting, 2019-2032 (USD Million)
56. Italy Metal Composite Power Inductor Market, By End-Use, 2019-2032 (USD Million)
57. Spain Metal Composite Power Inductor Market, By Type, 2019-2032 (USD Million)
58. Spain Metal Composite Power Inductor Market, By Form, 2019-2032 (USD Million)
59. Spain Metal Composite Power Inductor Market, By Mounting, 2019-2032 (USD Million)
60. Spain Metal Composite Power Inductor Market, By End-Use, 2019-2032 (USD Million)
61. Asia Pacific Metal Composite Power Inductor Market, By Type, 2019-2032 (USD Million)
62. Asia Pacific Metal Composite Power Inductor Market, By Form, 2019-2032 (USD Million)
63. Asia Pacific Metal Composite Power Inductor Market, By Mounting, 2019-2032 (USD Million)
64. Asia Pacific Metal Composite Power Inductor Market, By End-Use, 2019-2032 (USD Million)
65. Japan Metal Composite Power Inductor Market, By Type, 2019-2032 (USD Million)
66. Japan Metal Composite Power Inductor Market, By Form, 2019-2032 (USD Million)
67. Japan Metal Composite Power Inductor Market, By Mounting, 2019-2032 (USD Million)
68. Japan Metal Composite Power Inductor Market, By End-Use, 2019-2032 (USD Million)
69. China Metal Composite Power Inductor Market, By Type, 2019-2032 (USD Million)
70. China Metal Composite Power Inductor Market, By Form, 2019-2032 (USD Million)
71. China Metal Composite Power Inductor Market, By Mounting, 2019-2032 (USD Million)
72. China Metal Composite Power Inductor Market, By End-Use, 2019-2032 (USD Million)
73. India Metal Composite Power Inductor Market, By Type, 2019-2032 (USD Million)
74. India Metal Composite Power Inductor Market, By Form, 2019-2032 (USD Million)
75. India Metal Composite Power Inductor Market, By Mounting, 2019-2032 (USD Million)
76. India Metal Composite Power Inductor Market, By End-Use, 2019-2032 (USD Million)
77. South America Metal Composite Power Inductor Market, By Type, 2019-2032 (USD Million)
78. South America Metal Composite Power Inductor Market, By Form, 2019-2032 (USD Million)
79. South America Metal Composite Power Inductor Market, By Mounting, 2019-2032 (USD Million)
80. South America Metal Composite Power Inductor Market, By End-Use, 2019-2032 (USD Million)
81. Brazil Metal Composite Power Inductor Market, By Type, 2019-2032 (USD Million)
82. Brazil Metal Composite Power Inductor Market, By Form, 2019-2032 (USD Million)
83. Brazil Metal Composite Power Inductor Market, By Mounting, 2019-2032 (USD Million)
84. Brazil Metal Composite Power Inductor Market, By End-Use, 2019-2032 (USD Million)
85. Middle East and Africa Metal Composite Power Inductor Market, By Type, 2019-2032 (USD Million)
86. Middle East and Africa Metal Composite Power Inductor Market, By Form, 2019-2032 (USD Million)
87. Middle East and Africa Metal Composite Power Inductor Market, By Mounting, 2019-2032 (USD Million)
88. Middle East and Africa Metal Composite Power Inductor Market, By End-Use, 2019-2032 (USD Million)
89. UAE Metal Composite Power Inductor Market, By Type, 2019-2032 (USD Million)
90. UAE Metal Composite Power Inductor Market, By Form, 2019-2032 (USD Million)
91. UAE Metal Composite Power Inductor Market, By Mounting, 2019-2032 (USD Million)
92. UAE Metal Composite Power Inductor Market, By End-Use, 2019-2032 (USD Million)
93. South Africa Metal Composite Power Inductor Market, By Type, 2019-2032 (USD Million)
94. South Africa Metal Composite Power Inductor Market, By Form, 2019-2032 (USD Million)
95. South Africa Metal Composite Power Inductor Market, By Mounting, 2019-2032 (USD Million)
96. South Africa Metal Composite Power Inductor Market, By End-Use, 2019-2032 (USD Million)
List of Figures
1. Global Metal Composite Power Inductor Market Segmentation
2. Global Metal Composite Power Inductor Market: Research Methodology
3. Market Size Estimation Methodology: Bottom-Up Approach
4. Market Size Estimation Methodology: Top-Down Approach
5. Data Triangulation
6. Porter’s Five Forces Analysis
7. Value Chain Analysis
8. Global Metal Composite Power Inductor Market Attractiveness Analysis By Type
9. Global Metal Composite Power Inductor Market Attractiveness Analysis By Form
10. Global Metal Composite Power Inductor Market Attractiveness Analysis By Mounting
11. Global Metal Composite Power Inductor Market Attractiveness Analysis By End-Use
12. Global Metal Composite Power Inductor Market Attractiveness Analysis By Region
13. Global Metal Composite Power Inductor Market: Dynamics
14. Global Metal Composite Power Inductor Market Share By Type (2023 & 2032)
15. Global Metal Composite Power Inductor Market Share By Form (2023 & 2032)
16. Global Metal Composite Power Inductor Market Share By Mounting (2023 & 2032)
17. Global Metal Composite Power Inductor Market Share By End-Use (2023 & 2032)
18. Global Metal Composite Power Inductor Market Share By Regions (2023 & 2032)
19. Global Metal Composite Power Inductor Market Share By Company (2022)
This study forecasts revenue at global, regional, and country levels from 2019 to 2032. The Brainy Insights has segmented the global metal composite power inductor based on below mentioned segments:
Global Metal Composite Power Inductor Market by Type:
Global Metal Composite Power Inductor Market by Form:
Global Metal Composite Power Inductor Market by Mounting:
Global Metal Composite Power Inductor Market by End-Use:
Global Metal Composite Power Inductor by Region:
Research has its special purpose to undertake marketing efficiently. In this competitive scenario, businesses need information across all industry verticals; the information about customer wants, market demand, competition, industry trends, distribution channels etc. This information needs to be updated regularly because businesses operate in a dynamic environment. Our organization, The Brainy Insights incorporates scientific and systematic research procedures in order to get proper market insights and industry analysis for overall business success. The analysis consists of studying the market from a miniscule level wherein we implement statistical tools which helps us in examining the data with accuracy and precision.
Our research reports feature both; quantitative and qualitative aspects for any market. Qualitative information for any market research process are fundamental because they reveal the customer needs and wants, usage and consumption for any product/service related to a specific industry. This in turn aids the marketers/investors in knowing certain perceptions of the customers. Qualitative research can enlighten about the different product concepts and designs along with unique service offering that in turn, helps define marketing problems and generate opportunities. On the other hand, quantitative research engages with the data collection process through interviews, e-mail interactions, surveys and pilot studies. Quantitative aspects for the market research are useful to validate the hypotheses generated during qualitative research method, explore empirical patterns in the data with the help of statistical tools, and finally make the market estimations.
The Brainy Insights offers comprehensive research and analysis, based on a wide assortment of factual insights gained through interviews with CXOs and global experts and secondary data from reliable sources. Our analysts and industry specialist assume vital roles in building up statistical tools and analysis models, which are used to analyse the data and arrive at accurate insights with exceedingly informative research discoveries. The data provided by our organization have proven precious to a diverse range of companies, facilitating them to address issues such as determining which products/services are the most appealing, whether or not customers use the product in the manner anticipated, the purchasing intentions of the market and many others.
Our research methodology encompasses an idyllic combination of primary and secondary initiatives. Key phases involved in this process are listed below:

The phase involves the gathering and collecting of market data and its related information with the help of different sources & research procedures.

The data procurement stage involves in data gathering and collecting through various data sources.
This stage involves in extensive research. These data sources includes:
Purchased Database: Purchased databases play a crucial role in estimating the market sizes irrespective of the domain. Our purchased database includes:
Primary Research: The Brainy Insights interacts with leading companies and experts of the concerned domain to develop the analyst team’s market understanding and expertise. It improves and substantiates every single data presented in the market reports. Primary research mainly involves in telephonic interviews, E-mail interactions and face-to-face interviews with the raw material providers, manufacturers/producers, distributors, & independent consultants. The interviews that we conduct provides valuable data on market size and industry growth trends prevailing in the market. Our organization also conducts surveys with the various industry experts in order to gain overall insights of the industry/market. For instance, in healthcare industry we conduct surveys with the pharmacists, doctors, surgeons and nurses in order to gain insights and key information of a medical product/device/equipment which the customers are going to usage. Surveys are conducted in the form of questionnaire designed by our own analyst team. Surveys plays an important role in primary research because surveys helps us to identify the key target audiences of the market. Additionally, surveys helps to identify the key target audience engaged with the market. Our survey team conducts the survey by targeting the key audience, thus gaining insights from them. Based on the perspectives of the customers, this information is utilized to formulate market strategies. Moreover, market surveys helps us to understand the current competitive situation of the industry. To be precise, our survey process typically involve with the 360 analysis of the market. This analytical process begins by identifying the prospective customers for a product or service related to the market/industry to obtain data on how a product/service could fit into customers’ lives.

Secondary Research: The secondary data sources includes information published by the on-profit organizations such as World bank, WHO, company fillings, investor presentations, annual reports, national government documents, statistical databases, blogs, articles, white papers and others. From the annual report, we analyse a company’s revenue to understand the key segment and market share of that organization in a particular region. We analyse the company websites and adopt the product mapping technique which is important for deriving the segment revenue. In the product mapping method, we select and categorize the products offered by the companies catering to domain specific market, deduce the product revenue for each of the companies so as to get overall estimation of the market size. We also source data and analyses trends based on information received from supply side and demand side intermediaries in the value chain. The supply side denotes the data gathered from supplier, distributor, wholesaler and the demand side illustrates the data gathered from the end customers for respective market domain.

The supply side for a domain specific market is analysed by:
The demand side for the market is estimated through:
In-house Library: Apart from these third-party sources, we have our in-house library of qualitative and quantitative information. Our in-house database includes market data for various industry and domains. These data are updated on regular basis as per the changing market scenario. Our library includes, historic databases, internal audit reports and archives.
Sometimes there are instances where there is no metadata or raw data available for any domain specific market. For those cases, we use our expertise to forecast and estimate the market size in order to generate comprehensive data sets. Our analyst team adopt a robust research technique in order to produce the estimates:
Data Synthesis: This stage involves the analysis & mapping of all the information obtained from the previous step. It also involves in scrutinizing the data for any discrepancy observed while data gathering related to the market. The data is collected with consideration to the heterogeneity of sources. Robust scientific techniques are in place for synthesizing disparate data sets and provide the essential contextual information that can orient market strategies. The Brainy Insights has extensive experience in data synthesis where the data passes through various stages:


Market Deduction & Formulation: The final stage comprises of assigning data points at appropriate market spaces so as to deduce feasible conclusions. Analyst perspective & subject matter expert based holistic form of market sizing coupled with industry analysis also plays a crucial role in this stage.
This stage involves in finalization of the market size and numbers that we have collected from data integration step. With data interpolation, it is made sure that there is no gap in the market data. Successful trend analysis is done by our analysts using extrapolation techniques, which provide the best possible forecasts for the market.
Data Validation & Market Feedback: Validation is the most important step in the process. Validation & re-validation via an intricately designed process helps us finalize data-points to be used for final calculations.

The Brainy Insights interacts with leading companies and experts of the concerned domain to develop the analyst team’s market understanding and expertise. It improves and substantiates every single data presented in the market reports. The data validation interview and discussion panels are typically composed of the most experienced industry members. The participants include, however, are not limited to:
Moreover, we always validate our data and findings through primary respondents from all the major regions we are working on.


Free Customization
Fortune 500 Clients
Free Yearly Update On Purchase Of Multi/Corporate License
Companies Served Till Date