- +1-315-215-1633
- sales@thebrainyinsights.com

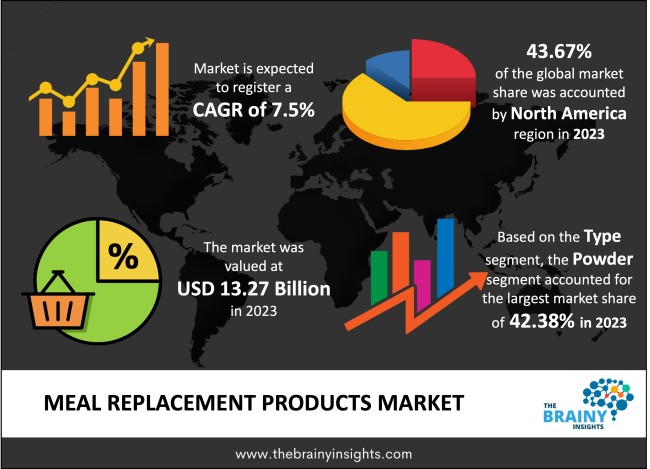
The global meal replacement products market was valued at USD 13.27 billion in 2023 and is anticipated to grow at a CAGR of 7.5% from 2024 to 2033. The market is expected to reach USD 27.34 billion by 2033. The modern, fast-paced way of life and hectic work timetables are prompting individuals to opt for nutritious alternatives over traditional snacks. This shift stands as a significant catalyst propelling the expansion of the worldwide market for meal replacement products. The growing incidence of diabetes and obesity cases and a growing requirement for easily manageable, portion-controlled food options are anticipated to witness significant market growth during the forecast years. Due to the increasing popularity of fitness and wellness, the demand for Meal Replacement Products is increasing. At the same time, due to the increasing demand for personalized nutrition, the demand for Meal Replacement Products is increasing. With this, customers can design their meals according to their needs and can take the quantity of protein or carbohydrates according to their needs.
Meal replacement products are convenient and nutritionally balanced alternatives to traditional meals. Meal replacement products are developed to provide essential nutrients such as vitamins, proteins, fats, carbohydrates, and minerals in a convenient and easily consumable form. They are often available in shakes, bars, or powders mixed with water or other liquids. The primary purpose of meal replacement products is to offer a quick and hassle-free option for individuals needing more time or resources to prepare a full meal. These products are trendy among busy individuals, athletes, and those aiming to manage their weight. Meal replacement products are formulated to provide controlled calories while ensuring a balance of macronutrients and micronutrients. It's important to note that while meal replacement products can be convenient, they should not wholly replace whole foods in a regular diet. Whole foods provide a more comprehensive range of nutrients and dietary components that might not be fully replicated in a processed meal replacement product. Before integrating meal replacement products into someone's diet, seeking guidance from a registered nutritionist or a healthcare professional is recommended. This step will help ensure that their nutritional requirements are appropriately fulfilled. Meal Replacement Products also help with weight management. A properly balanced diet can reduce weight. Sports personalities can enhance their performance and reduce their injury recovery time.
Get an overview of this study by requesting a free sample
Lifestyle Convenience - The frenetic lifestyles of modern consumers have driven the demand for convenient and quick nutrition options. Meal replacement products offer an on-the-go solution for individuals with busy schedules, providing a balanced meal without the need for extensive preparation.
Weight Management - Meal replacement products are often utilized as part of weight management strategies. They offer portion-controlled options with known calorie counts, making it easier for individuals to monitor their calorie intake and achieve their weight goals.
Fitness and Athletes - Fitness enthusiasts and athletes use meal replacement products as a convenient way to ensure they are getting the necessary nutrients to support their active lifestyles and post-workout recovery.
Nutritional Incompleteness - While meal replacement products offer convenience, they may only provide part of the spectrum of nutrients found in whole foods. Relying solely on these products could lead to potential nutrient deficiencies over time.
Taste and Satisfaction - Some consumers find meal replacement products less satisfying regarding taste and texture than traditional meals. This factor can impact long-term adherence to these products as a meal alternative.
Personalization and Customization - Developing meal replacement products tailored to individual dietary preferences, nutritional needs, and allergies presents a significant opportunity. Companies can leverage technology to create personalized formulations for consumers.
Functional Ingredients - Incorporating functional ingredients such as probiotics, prebiotics, antioxidants, and adaptogens can enhance the health benefits of meal replacement products, appealing to consumers looking for holistic wellness solutions.
Regulatory Compliance - The regulatory landscape for meal replacement products can be complex and varies across regions. Ensuring compliance with labelling, ingredient, and health claims regulations can be demanding.
Consumer Education - It is essential to educate consumers about the appropriate use of meal replacement products, their role in a balanced diet, and potential limitations. Misunderstandings about these products can lead to misuse and dissatisfaction.
The regions analyzed for the market include North America, Europe, South America, Asia Pacific, the Middle East, and Africa. The North American region emerged as the most prominent global meal replacement products market, with a 43.67% market revenue share in 2023.
North America, particularly the United States and Canada, has a high consumer health and wellness awareness. A strong focus on maintaining a balanced lifestyle has led to a substantial demand for convenient and nutritionally balanced options like meal replacement products. Additionally, the fast-paced lifestyles in North America, driven by urbanization and demanding work schedules, have increased the demand for time-efficient meal solutions. Meal replacement products offer a convenient way to obtain necessary nutrients without investing significant time in meal preparation. Furthermore, the region has a well-established fitness and weight management culture, with a significant portion of the population actively seeking solutions to manage their weight and support their fitness goals. Meal replacement products are often seen as a tool to achieve these objectives. The Asia Pacific region is projected to experience rapid growth during the forecast period. As urbanization continues to accelerate across many countries in Asia Pacific, busy urban lifestyles are becoming more common. This shift has increased demand for convenient and time-saving meal solutions, making meal replacement products appealing. The region is also witnessing a growing middle class with increased disposable income. As a result, consumers are more willing to invest in products that offer convenient health benefits and align with modern dietary preferences.
North America Region Meal Replacement Products Market Share in 2023 - 43.67%
www.thebrainyinsights.com
Check the geographical analysis of this market by requesting a free sample
The type segment includes top bars, powder, ready-to-drink and others. The powder segment accounted for the largest market share of around 42.38% in 2023. Powdered meal replacement products offer a high degree of customization. Consumers can adjust serving sizes and mix the powder with different liquids to achieve the desired consistency and flavour. Powdered formulations also allow for precise control over the amounts of proteins, carbohydrates, fats, and other nutrients. This characteristic appeals to individuals with specific dietary goals or requirements. Furthermore, powdered meal replacements are lightweight and compact, making them convenient for carrying and storing. This convenience suits consumers who are often on the go or need portable meal solutions. These factors are mainly driving the segment's growth.
The source segment is classified into plant-based and synthetic. The plant-based segment dominated the market, with a share of around 66.93% in 2023. Plant-based diets are usually associated with health benefits and environmental sustainability. Consumers prioritizing their health and the planet's well-being may prefer plant-based meal replacement products. Plant-based options are often free from common allergens such as dairy and eggs. This characteristic appeals to individuals with allergies or sensitivities seeking alternative sources of nutrition. Besides, the growing popularity of vegan and vegetarian diets has increased demand for plant-based products across various food categories, including meal replacement products. Consumers concerned about animal welfare and ethical considerations may also opt for plant-based products as a more ethical choice.
The application segment is classified into physical fitness, weight gain, weight loss, wound healing and others. The weight loss segment dominated the market, with a share of around 37.61% in 2023. There has been a consistent global focus on health and fitness; weight loss remains a primary goal for many individuals. Meal replacement products are often marketed as convenient tools to help manage calorie intake and achieve weight loss goals. Meal replacement products provide portion-controlled meals, making it easier for individuals to manage their calorie intake and avoid overeating. These products also offer a structured weight-loss approach by providing predetermined calorie and nutrient content. Thus, appeals to individuals who prefer clear guidelines in their weight loss journey. In the context of busy modern lifestyles, meal replacement products offer a convenient solution for individuals seeking to lose weight without spending excessive time on meal planning and preparation.
The distribution channel segment includes offline and online. The offline segment dominated the market, with a share of around 67.81% in 2023. Offline retail outlets, such as grocery stores, health food stores, and pharmacies, allow consumers to examine and select meal replacement products physically. This tactile experience can build consumer trust and confidence in the product's quality. In addition, physical retail stores offer face-to-face interactions with store staff who can provide product recommendations, answer customers' questions, and assist them in making informed choices. Moreover, consumers who purchase products immediately without waiting for shipping may prefer to shop offline. This point is particularly true for individuals who need meal replacement products on short notice.
| Attribute | Description |
|---|---|
| Market Size | Revenue (USD Billion) |
| Market size value in 2023 | USD 13.27 Billion |
| Market size value in 2033 | USD 27.34 Billion |
| CAGR (2024 to 2033) | 7.5% |
| Historical data | 2020-2022 |
| Base Year | 2023 |
| Forecast | 2024-2033 |
| Region | The regions analyzed for the market are Asia Pacific, Europe, South America, North America, and Middle East & Africa. Furthermore, the regions are further analyzed at the country level. |
| Segments | Type, Source, Application and Distribution Channel |
As per The Brainy Insights, the size of the meal replacement products market was valued at USD 13.27 billion in 2023 to USD 27.34 billion by 2033.
The global meal replacement products market is growing at a CAGR of 7.5% during the forecast period 2024-2033.
The North American region became the largest market for meal replacement products.
Growing number of fitness enthusiasts and athletes and rising awareness about body weight management are influencing the market's growth.
1. Introduction
1.1. Objectives of the Study
1.2. Market Definition
1.3. Research Scope
1.4. Currency
1.5. Key Target Audience
2. Research Methodology and Assumptions
3. Executive Summary
4. Premium Insights
4.1. Porter’s Five Forces Analysis
4.2. Value Chain Analysis
4.3. Top Investment Pockets
4.3.1. Market Attractiveness Analysis by Type
4.3.2. Market Attractiveness Analysis by Source
4.3.3. Market Attractiveness Analysis by Application
4.3.4. Market Attractiveness Analysis by Distribution Channel
4.3.5. Market Attractiveness Analysis by Region
4.4. Industry Trends
5. Market Dynamics
5.1. Market Evaluation
5.2. Drivers
5.2.1. Lifestyle Convenience
5.2.2. Weight Management
5.2.3. Fitness and Athletes
5.3. Restraints
5.3.1. Nutritional Incompleteness
5.3.2. Taste and Satisfaction
5.4. Opportunities
5.4.1. Personalization and Customization
5.4.2. Functional Ingredients
5.5. Challenges
5.5.1. Regulatory Compliance
5.5.2. Consumer Education
6. Global Meal Replacement Products Market Analysis and Forecast, By Type
6.1. Segment Overview
6.2. Bars
6.3. Powder
6.4. Ready to Drink
6.5. Others
7. Global Meal Replacement Products Market Analysis and Forecast, By Source
7.1. Segment Overview
7.2. Plant-based
7.3. Synthetic
8. Global Meal Replacement Products Market Analysis and Forecast, By Application
8.1. Segment Overview
8.2. Physical Fitness
8.3. Weight Gain
8.4. Weight Loss
8.5. Wound Healing
8.6. Others
9. Global Meal Replacement Products Market Analysis and Forecast, By Distribution Channel
9.1. Segment Overview
9.2. Offline
9.3. Online
10. Global Meal Replacement Products Market Analysis and Forecast, By Regional Analysis
10.1. Segment Overview
10.2. North America
10.2.1. U.S.
10.2.2. Canada
10.2.3. Mexico
10.3. Europe
10.3.1. Germany
10.3.2. France
10.3.3. U.K.
10.3.4. Italy
10.3.5. Spain
10.4. Asia-Pacific
10.4.1. Japan
10.4.2. China
10.4.3. India
10.5. South America
10.5.1. Brazil
10.6. Middle East and Africa
10.6.1. UAE
10.6.2. South Africa
11. Global Meal Replacement Products Market-Competitive Landscape
11.1. Overview
11.2. Market Share of Key Players in the Meal Replacement Products Market
11.2.1. Global Company Market Share
11.2.2. North America Company Market Share
11.2.3. Europe Company Market Share
11.2.4. APAC Company Market Share
11.3. Competitive Situations and Trends
11.3.1. Product Launches and Developments
11.3.2. Partnerships, Collaborations, and Agreements
11.3.3. Mergers & Acquisitions
11.3.4. Expansions
12. Company Profiles
12.1. Amway
12.1.1. Business Overview
12.1.2. Company Snapshot
12.1.3. Company Market Share Analysis
12.1.4. Company Product Portfolio
12.1.5. Recent Developments
12.1.6. SWOT Analysis
12.2. Abbott Laboratories
12.2.1. Business Overview
12.2.2. Company Snapshot
12.2.3. Company Market Share Analysis
12.2.4. Company Product Portfolio
12.2.5. Recent Developments
12.2.6. SWOT Analysis
12.3. Trinkkost GmbH
12.3.1. Business Overview
12.3.2. Company Snapshot
12.3.3. Company Market Share Analysis
12.3.4. Company Product Portfolio
12.3.5. Recent Developments
12.3.6. SWOT Analysis
12.4. Futricio
12.4.1. Business Overview
12.4.2. Company Snapshot
12.4.3. Company Market Share Analysis
12.4.4. Company Product Portfolio
12.4.5. Recent Developments
12.4.6. SWOT Analysis
12.5. Saturo Foods GmbH
12.5.1. Business Overview
12.5.2. Company Snapshot
12.5.3. Company Market Share Analysis
12.5.4. Company Product Portfolio
12.5.5. Recent Developments
12.5.6. SWOT Analysis
12.6. Orgain Inc.
12.6.1. Business Overview
12.6.2. Company Snapshot
12.6.3. Company Market Share Analysis
12.6.4. Company Product Portfolio
12.6.5. Recent Developments
12.6.6. SWOT Analysis
12.7. Herbalife International of America, Inc.
12.7.1. Business Overview
12.7.2. Company Snapshot
12.7.3. Company Market Share Analysis
12.7.4. Company Product Portfolio
12.7.5. Recent Developments
12.7.6. SWOT Analysis
12.8. Atlantic Essentials Products, Inc.
12.8.1. Business Overview
12.8.2. Company Snapshot
12.8.3. Company Market Share Analysis
12.8.4. Company Product Portfolio
12.8.5. Recent Developments
12.8.6. SWOT Analysis
12.9. Sklew Biotech
12.9.1. Business Overview
12.9.2. Company Snapshot
12.9.3. Company Market Share Analysis
12.9.4. Company Product Portfolio
12.9.5. Recent Developments
12.9.6. SWOT Analysis
12.10. RITS Health Care Products
12.10.1. Business Overview
12.10.2. Company Snapshot
12.10.3. Company Market Share Analysis
12.10.4. Company Product Portfolio
12.10.5. Recent Developments
12.10.6. SWOT Analysis
12.11. Glanbia
12.11.1. Business Overview
12.11.2. Company Snapshot
12.11.3. Company Market Share Analysis
12.11.4. Company Product Portfolio
12.11.5. Recent Developments
12.11.6. SWOT Analysis
12.12. Nestle
12.12.1. Business Overview
12.12.2. Company Snapshot
12.12.3. Company Market Share Analysis
12.12.4. Company Product Portfolio
12.12.5. Recent Developments
12.12.6. SWOT Analysis
12.13. Atkins
12.13.1. Business Overview
12.13.2. Company Snapshot
12.13.3. Company Market Share Analysis
12.13.4. Company Product Portfolio
12.13.5. Recent Developments
12.13.6. SWOT Analysis
12.14. Huel
12.14.1. Business Overview
12.14.2. Company Snapshot
12.14.3. Company Market Share Analysis
12.14.4. Company Product Portfolio
12.14.5. Recent Developments
12.14.6. SWOT Analysis
12.15. Kellogg Co.
12.15.1. Business Overview
12.15.2. Company Snapshot
12.15.3. Company Market Share Analysis
12.15.4. Company Product Portfolio
12.15.5. Recent Developments
12.15.6. SWOT Analysis
12.16. Bob’s Red Mill Natural Foods
12.16.1. Business Overview
12.16.2. Company Snapshot
12.16.3. Company Market Share Analysis
12.16.4. Company Product Portfolio
12.16.5. Recent Developments
12.16.6. SWOT Analysis
12.17. The Simply Good Foods Company
12.17.1. Business Overview
12.17.2. Company Snapshot
12.17.3. Company Market Share Analysis
12.17.4. Company Product Portfolio
12.17.5. Recent Developments
12.17.6. SWOT Analysis
12.18. The Kraft Heinz Company
12.18.1. Business Overview
12.18.2. Company Snapshot
12.18.3. Company Market Share Analysis
12.18.4. Company Product Portfolio
12.18.5. Recent Developments
12.18.6. SWOT Analysis
12.19. The Ritebite Group
12.19.1. Business Overview
12.19.2. Company Snapshot
12.19.3. Company Market Share Analysis
12.19.4. Company Product Portfolio
12.19.5. Recent Developments
12.19.6. SWOT Analysis
12.20. Unilever
12.20.1. Business Overview
12.20.2. Company Snapshot
12.20.3. Company Market Share Analysis
12.20.4. Company Product Portfolio
12.20.5. Recent Developments
12.20.6. SWOT Analysis
12.21. Blue Diamond (Global Ingredients Division)
12.21.1. Business Overview
12.21.2. Company Snapshot
12.21.3. Company Market Share Analysis
12.21.4. Company Product Portfolio
12.21.5. Recent Developments
12.21.6. SWOT Analysis
12.22. General Mills
12.22.1. Business Overview
12.22.2. Company Snapshot
12.22.3. Company Market Share Analysis
12.22.4. Company Product Portfolio
12.22.5. Recent Developments
12.22.6. SWOT Analysis
12.23. SlimFast
12.23.1. Business Overview
12.23.2. Company Snapshot
12.23.3. Company Market Share Analysis
12.23.4. Company Product Portfolio
12.23.5. Recent Developments
12.23.6. SWOT Analysis
12.24. Nu Skin Enterprises
12.24.1. Business Overview
12.24.2. Company Snapshot
12.24.3. Company Market Share Analysis
12.24.4. Company Product Portfolio
12.24.5. Recent Developments
12.24.6. SWOT Analysis
12.25. Usana Health Sciences, Inc.
12.25.1. Business Overview
12.25.2. Company Snapshot
12.25.3. Company Market Share Analysis
12.25.4. Company Product Portfolio
12.25.5. Recent Developments
12.25.6. SWOT Analysis
12.26. Levana Nourishments
12.26.1. Business Overview
12.26.2. Company Snapshot
12.26.3. Company Market Share Analysis
12.26.4. Company Product Portfolio
12.26.5. Recent Developments
12.26.6. SWOT Analysis
List of Table
1. Global Meal Replacement Products Market, By Type, 2020-2033 (USD Billion) (K Tons)
2. Global Bars, Meal Replacement Products Market, By Region, 2020-2033 (USD Billion) (K Tons)
3. Global Powder, Meal Replacement Products Market, By Region, 2020-2033 (USD Billion) (K Tons)
4. Global Ready to Drink, Meal Replacement Products Market, By Region, 2020-2033 (USD Billion) (K Tons)
5. Global Others, Meal Replacement Products Market, By Region, 2020-2033 (USD Billion) (K Tons)
6. Global Meal Replacement Products Market, By Source, 2020-2033 (USD Billion) (K Tons)
7. Global Plant-based Meal Replacement Products Market, By Region, 2020-2033 (USD Billion) (K Tons)
8. Global Synthetic Meal Replacement Products Market, By Region, 2020-2033 (USD Billion) (K Tons)
9. Global Meal Replacement Products Market, By Application, 2020-2033 (USD Billion) (K Tons)
10. Global Physical Fitness Meal Replacement Products Market, By Region, 2020-2033 (USD Billion) (K Tons)
11. Global Weight Gain Meal Replacement Products Market, By Region, 2020-2033 (USD Billion) (K Tons)
12. Global Weight Loss Meal Replacement Products Market, By Region, 2020-2033 (USD Billion) (K Tons)
13. Global Wound Healing Meal Replacement Products Market, By Region, 2020-2033 (USD Billion) (K Tons)
14. Global Others Meal Replacement Products Market, By Region, 2020-2033 (USD Billion) (K Tons)
15. Global Meal Replacement Products Market, By Application, 2020-2033 (USD Billion) (K Tons)
16. Global Offline Meal Replacement Products Market, By Region, 2020-2033 (USD Billion) (K Tons)
17. Global Online Meal Replacement Products Market, By Region, 2020-2033 (USD Billion) (K Tons)
18. Global Meal Replacement Products Market, By Region, 2020-2033 (USD Billion) (K Tons)
19. North America Meal Replacement Products Market, By Type, 2020-2033 (USD Billion) (K Tons)
20. North America Meal Replacement Products Market, By Source, 2020-2033 (USD Billion) (K Tons)
21. North America Meal Replacement Products Market, By Application, 2020-2033 (USD Billion) (K Tons)
22. North America Meal Replacement Products Market, By Distribution Channel, 2020-2033 (USD Billion) (K Tons)
23. U.S. Meal Replacement Products Market, By Type, 2020-2033 (USD Billion) (K Tons)
24. U.S. Meal Replacement Products Market, By Source, 2020-2033 (USD Billion) (K Tons)
25. U.S. Meal Replacement Products Market, By Application, 2020-2033 (USD Billion) (K Tons)
26. U.S. Meal Replacement Products Market, By Distribution Channel, 2020-2033 (USD Billion) (K Tons)
27. Canada Meal Replacement Products Market, By Type, 2020-2033 (USD Billion) (K Tons)
28. Canada Meal Replacement Products Market, By Source, 2020-2033 (USD Billion) (K Tons)
29. Canada Meal Replacement Products Market, By Application, 2020-2033 (USD Billion) (K Tons)
30. Canada Meal Replacement Products Market, By Distribution Channel, 2020-2033 (USD Billion) (K Tons)
31. Mexico Meal Replacement Products Market, By Type, 2020-2033 (USD Billion) (K Tons)
32. Mexico Meal Replacement Products Market, By Source, 2020-2033 (USD Billion) (K Tons)
33. Mexico Meal Replacement Products Market, By Application, 2020-2033 (USD Billion) (K Tons)
34. Mexico Meal Replacement Products Market, By Distribution Channel, 2020-2033 (USD Billion) (K Tons)
35. Europe Meal Replacement Products Market, By Type, 2020-2033 (USD Billion) (K Tons)
36. Europe Meal Replacement Products Market, By Source, 2020-2033 (USD Billion) (K Tons)
37. Europe Meal Replacement Products Market, By Application, 2020-2033 (USD Billion) (K Tons)
38. Europe Meal Replacement Products Market, By Distribution Channel, 2020-2033 (USD Billion) (K Tons)
39. Germany Meal Replacement Products Market, By Type, 2020-2033 (USD Billion) (K Tons)
40. Germany Meal Replacement Products Market, By Source, 2020-2033 (USD Billion) (K Tons)
41. Germany Meal Replacement Products Market, By Application, 2020-2033 (USD Billion) (K Tons)
42. Germany Meal Replacement Products Market, By Distribution Channel, 2020-2033 (USD Billion) (K Tons)
43. France Meal Replacement Products Market, By Type, 2020-2033 (USD Billion) (K Tons)
44. France Meal Replacement Products Market, By Source, 2020-2033 (USD Billion) (K Tons)
45. France Meal Replacement Products Market, By Application, 2020-2033 (USD Billion) (K Tons)
46. France Meal Replacement Products Market, By Distribution Channel, 2020-2033 (USD Billion) (K Tons)
47. U.K. Meal Replacement Products Market, By Type, 2020-2033 (USD Billion) (K Tons)
48. U.K. Meal Replacement Products Market, By Source, 2020-2033 (USD Billion) (K Tons)
49. U.K. Meal Replacement Products Market, By Application, 2020-2033 (USD Billion) (K Tons)
50. U.K. Meal Replacement Products Market, By Distribution Channel, 2020-2033 (USD Billion) (K Tons)
51. Italy Meal Replacement Products Market, By Type, 2020-2033 (USD Billion) (K Tons)
52. Italy Meal Replacement Products Market, By Source, 2020-2033 (USD Billion) (K Tons)
53. Italy Meal Replacement Products Market, By Application, 2020-2033 (USD Billion) (K Tons)
54. Italy Meal Replacement Products Market, By Distribution Channel, 2020-2033 (USD Billion) (K Tons)
55. Spain Meal Replacement Products Market, By Type, 2020-2033 (USD Billion) (K Tons)
56. Spain Meal Replacement Products Market, By Source, 2020-2033 (USD Billion) (K Tons)
57. Spain Meal Replacement Products Market, By Application, 2020-2033 (USD Billion) (K Tons)
58. Spain Meal Replacement Products Market, By Distribution Channel, 2020-2033 (USD Billion) (K Tons)
59. Asia Pacific Meal Replacement Products Market, By Type, 2020-2033 (USD Billion) (K Tons)
60. Asia Pacific Meal Replacement Products Market, By Source, 2020-2033 (USD Billion) (K Tons)
61. Asia Pacific Meal Replacement Products Market, By Application, 2020-2033 (USD Billion) (K Tons)
62. Asia Pacific Meal Replacement Products Market, By Distribution Channel, 2020-2033 (USD Billion) (K Tons)
63. Japan Meal Replacement Products Market, By Type, 2020-2033 (USD Billion) (K Tons)
64. Japan Meal Replacement Products Market, By Source, 2020-2033 (USD Billion) (K Tons)
65. Japan Meal Replacement Products Market, By Application, 2020-2033 (USD Billion) (K Tons)
66. Japan Meal Replacement Products Market, By Distribution Channel, 2020-2033 (USD Billion) (K Tons)
67. China Meal Replacement Products Market, By Type, 2020-2033 (USD Billion) (K Tons)
68. China Meal Replacement Products Market, By Source, 2020-2033 (USD Billion) (K Tons)
69. China Meal Replacement Products Market, By Application, 2020-2033 (USD Billion) (K Tons)
70. China Meal Replacement Products Market, By Distribution Channel, 2020-2033 (USD Billion) (K Tons)
71. India Meal Replacement Products Market, By Type, 2020-2033 (USD Billion) (K Tons)
72. India Meal Replacement Products Market, By Source, 2020-2033 (USD Billion) (K Tons)
73. India Meal Replacement Products Market, By Application, 2020-2033 (USD Billion) (K Tons)
74. India Meal Replacement Products Market, By Distribution Channel, 2020-2033 (USD Billion) (K Tons)
75. South America Meal Replacement Products Market, By Type, 2020-2033 (USD Billion) (K Tons)
76. South America Meal Replacement Products Market, By Source, 2020-2033 (USD Billion) (K Tons)
77. South America Meal Replacement Products Market, By Application, 2020-2033 (USD Billion) (K Tons)
78. South America Meal Replacement Products Market, By Distribution Channel, 2020-2033 (USD Billion) (K Tons)
79. Brazil Meal Replacement Products Market, By Type, 2020-2033 (USD Billion) (K Tons)
80. Brazil Meal Replacement Products Market, By Source, 2020-2033 (USD Billion) (K Tons)
81. Brazil Meal Replacement Products Market, By Application, 2020-2033 (USD Billion) (K Tons)
82. Brazil Meal Replacement Products Market, By Distribution Channel, 2020-2033 (USD Billion) (K Tons)
83. Middle East and Africa Meal Replacement Products Market, By Type, 2020-2033 (USD Billion) (K Tons)
84. Middle East and Africa Meal Replacement Products Market, By Source, 2020-2033 (USD Billion) (K Tons)
85. Middle East and Africa Meal Replacement Products Market, By Application, 2020-2033 (USD Billion) (K Tons)
86. Middle East and Africa Meal Replacement Products Market, By Distribution Channel, 2020-2033 (USD Billion) (K Tons)
87. UAE Meal Replacement Products Market, By Type, 2020-2033 (USD Billion) (K Tons)
88. UAE Meal Replacement Products Market, By Source, 2020-2033 (USD Billion) (K Tons)
89. UAE Meal Replacement Products Market, By Application, 2020-2033 (USD Billion) (K Tons)
90. UAE Meal Replacement Products Market, By Distribution Channel, 2020-2033 (USD Billion) (K Tons)
91. South Africa Meal Replacement Products Market, By Type, 2020-2033 (USD Billion) (K Tons)
92. South Africa Meal Replacement Products Market, By Source, 2020-2033 (USD Billion) (K Tons)
93. South Africa Meal Replacement Products Market, By Application, 2020-2033 (USD Billion) (K Tons)
94. South Africa Meal Replacement Products Market, By Distribution Channel, 2020-2033 (USD Billion) (K Tons)
List of Figures
1. Global Meal Replacement Products Market Segmentation
2. Meal Replacement Products Market: Research Methodology
3. Market Size Estimation Methodology: Bottom-Up Approach
4. Market Size Estimation Methodology: Top-Down Approach
5. Data Triangulation
6. Porter’s Five Forces Analysis
7. Value Chain Analysis
8. Global Meal Replacement Products Market Attractiveness Analysis by Type
9. Global Meal Replacement Products Market Attractiveness Analysis by Source
10. Global Meal Replacement Products Market Attractiveness Analysis by Application
11. Global Meal Replacement Products Market Attractiveness Analysis by Distribution Channel
12. Global Meal Replacement Products Market Attractiveness Analysis by Region
13. Global Meal Replacement Products Market: Dynamics
14. Global Meal Replacement Products Market Share by Type (2023 & 2033)
15. Global Meal Replacement Products Market Share by Source (2023 & 2033)
16. Global Meal Replacement Products Market Share by Application (2023 & 2033)
17. Global Meal Replacement Products Market Share by Distribution Channel (2023 & 2033)
18. Global Meal Replacement Products Market Share by Regions (2023 & 2033)
19. Global Meal Replacement Products Market Share by Company (2023)
This study forecasts revenue at global, regional, and country levels from 2020 to 2033. The Brainy Insights has segmented the global Meal Replacement Products market based on below-mentioned segments:
Global Meal Replacement Products Market by Type:
Global Meal Replacement Products Market by Source:
Global Meal Replacement Products Market by Application:
Global Meal Replacement Products Market by Distribution Channel:
Global Meal Replacement Products Market by Region:
Research has its special purpose to undertake marketing efficiently. In this competitive scenario, businesses need information across all industry verticals; the information about customer wants, market demand, competition, industry trends, distribution channels etc. This information needs to be updated regularly because businesses operate in a dynamic environment. Our organization, The Brainy Insights incorporates scientific and systematic research procedures in order to get proper market insights and industry analysis for overall business success. The analysis consists of studying the market from a miniscule level wherein we implement statistical tools which helps us in examining the data with accuracy and precision.
Our research reports feature both; quantitative and qualitative aspects for any market. Qualitative information for any market research process are fundamental because they reveal the customer needs and wants, usage and consumption for any product/service related to a specific industry. This in turn aids the marketers/investors in knowing certain perceptions of the customers. Qualitative research can enlighten about the different product concepts and designs along with unique service offering that in turn, helps define marketing problems and generate opportunities. On the other hand, quantitative research engages with the data collection process through interviews, e-mail interactions, surveys and pilot studies. Quantitative aspects for the market research are useful to validate the hypotheses generated during qualitative research method, explore empirical patterns in the data with the help of statistical tools, and finally make the market estimations.
The Brainy Insights offers comprehensive research and analysis, based on a wide assortment of factual insights gained through interviews with CXOs and global experts and secondary data from reliable sources. Our analysts and industry specialist assume vital roles in building up statistical tools and analysis models, which are used to analyse the data and arrive at accurate insights with exceedingly informative research discoveries. The data provided by our organization have proven precious to a diverse range of companies, facilitating them to address issues such as determining which products/services are the most appealing, whether or not customers use the product in the manner anticipated, the purchasing intentions of the market and many others.
Our research methodology encompasses an idyllic combination of primary and secondary initiatives. Key phases involved in this process are listed below:

The phase involves the gathering and collecting of market data and its related information with the help of different sources & research procedures.

The data procurement stage involves in data gathering and collecting through various data sources.
This stage involves in extensive research. These data sources includes:
Purchased Database: Purchased databases play a crucial role in estimating the market sizes irrespective of the domain. Our purchased database includes:
Primary Research: The Brainy Insights interacts with leading companies and experts of the concerned domain to develop the analyst team’s market understanding and expertise. It improves and substantiates every single data presented in the market reports. Primary research mainly involves in telephonic interviews, E-mail interactions and face-to-face interviews with the raw material providers, manufacturers/producers, distributors, & independent consultants. The interviews that we conduct provides valuable data on market size and industry growth trends prevailing in the market. Our organization also conducts surveys with the various industry experts in order to gain overall insights of the industry/market. For instance, in healthcare industry we conduct surveys with the pharmacists, doctors, surgeons and nurses in order to gain insights and key information of a medical product/device/equipment which the customers are going to usage. Surveys are conducted in the form of questionnaire designed by our own analyst team. Surveys plays an important role in primary research because surveys helps us to identify the key target audiences of the market. Additionally, surveys helps to identify the key target audience engaged with the market. Our survey team conducts the survey by targeting the key audience, thus gaining insights from them. Based on the perspectives of the customers, this information is utilized to formulate market strategies. Moreover, market surveys helps us to understand the current competitive situation of the industry. To be precise, our survey process typically involve with the 360 analysis of the market. This analytical process begins by identifying the prospective customers for a product or service related to the market/industry to obtain data on how a product/service could fit into customers’ lives.

Secondary Research: The secondary data sources includes information published by the on-profit organizations such as World bank, WHO, company fillings, investor presentations, annual reports, national government documents, statistical databases, blogs, articles, white papers and others. From the annual report, we analyse a company’s revenue to understand the key segment and market share of that organization in a particular region. We analyse the company websites and adopt the product mapping technique which is important for deriving the segment revenue. In the product mapping method, we select and categorize the products offered by the companies catering to domain specific market, deduce the product revenue for each of the companies so as to get overall estimation of the market size. We also source data and analyses trends based on information received from supply side and demand side intermediaries in the value chain. The supply side denotes the data gathered from supplier, distributor, wholesaler and the demand side illustrates the data gathered from the end customers for respective market domain.

The supply side for a domain specific market is analysed by:
The demand side for the market is estimated through:
In-house Library: Apart from these third-party sources, we have our in-house library of qualitative and quantitative information. Our in-house database includes market data for various industry and domains. These data are updated on regular basis as per the changing market scenario. Our library includes, historic databases, internal audit reports and archives.
Sometimes there are instances where there is no metadata or raw data available for any domain specific market. For those cases, we use our expertise to forecast and estimate the market size in order to generate comprehensive data sets. Our analyst team adopt a robust research technique in order to produce the estimates:
Data Synthesis: This stage involves the analysis & mapping of all the information obtained from the previous step. It also involves in scrutinizing the data for any discrepancy observed while data gathering related to the market. The data is collected with consideration to the heterogeneity of sources. Robust scientific techniques are in place for synthesizing disparate data sets and provide the essential contextual information that can orient market strategies. The Brainy Insights has extensive experience in data synthesis where the data passes through various stages:


Market Deduction & Formulation: The final stage comprises of assigning data points at appropriate market spaces so as to deduce feasible conclusions. Analyst perspective & subject matter expert based holistic form of market sizing coupled with industry analysis also plays a crucial role in this stage.
This stage involves in finalization of the market size and numbers that we have collected from data integration step. With data interpolation, it is made sure that there is no gap in the market data. Successful trend analysis is done by our analysts using extrapolation techniques, which provide the best possible forecasts for the market.
Data Validation & Market Feedback: Validation is the most important step in the process. Validation & re-validation via an intricately designed process helps us finalize data-points to be used for final calculations.

The Brainy Insights interacts with leading companies and experts of the concerned domain to develop the analyst team’s market understanding and expertise. It improves and substantiates every single data presented in the market reports. The data validation interview and discussion panels are typically composed of the most experienced industry members. The participants include, however, are not limited to:
Moreover, we always validate our data and findings through primary respondents from all the major regions we are working on.


Free Customization
Fortune 500 Clients
Free Yearly Update On Purchase Of Multi/Corporate License
Companies Served Till Date