- +1-315-215-1633
- sales@thebrainyinsights.com

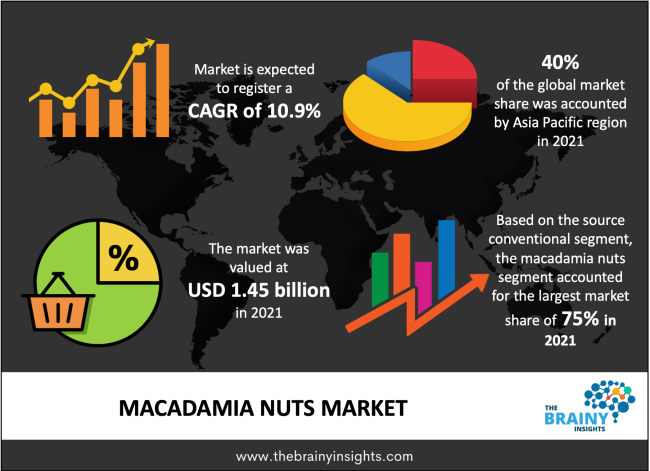
The macadamia nuts market was valued at USD 1.45 billion in 2021 and is expected to expand at a CAGR of 10.9% over the forecast period from 2022 to 2030. The growing demand for healthy snacks among a large group of consumers across the globe in recent years is one of the key factors driving the macadamia nuts market. Moreover, with an increase in consumer inclination for vegan diets, the consumption of salty nuts as a healthy snack and macadamia nut butter & spreads is fueling the demand for macadamia nuts across the globe.
Owing to growing consumer interest, macadamia nuts are gaining wide acceptance for the production of plant-based spread, dressing, butter, ice cream, and yogurt, and as an ingredient in the confectionery and bakery industry. Research has also shown that macadamia nut consumption may significantly lower the risk of heart disease.
Macadamia nuts are the most expensive nuts in the world, because of their rich butter-like flavor and creamy texture, and are widely used as high-quality dessert nuts. These nuts are gaining popularity as a healthy snack among consumers and find a wide range of applications in the bakery and confectionery industry, such as for preparing ice creams, chocolates, cookies, biscotti, cakes, muffins, and waffles as well as l in frostings and seasonings.
Get an overview of this study by requesting a free sample
Macadamia nuts are full of nutritional properties. They are high in healthy fats, minerals, vitamins, and antioxidants, and low in sugar and carbs. These nuts are also rich in monounsaturated fats, which help in boosting heart health by lowering the bad or low-density lipoprotein (LDL) cholesterol levels in the body. Moreover, these nuts also contain protein and fiber, both of which aid in improving metabolic syndrome and reducing weight.
There has been a shift in demand, trends, and consumption patterns within the context of the COVID-19 pandemic across the Americas, Europe, the Middle East, and Africa. The nut and dried fruit industry has however remained resilient and continued to progress, demonstrating the strength of the macadamia nut sector.
Raw macadamia nuts held the largest market share of more than 45% in 2021. Raw macadamia nuts are primarily supplied to bakery & confectionery, snack, and other food processing industries. Additionally, in recent years, macadamia butter has been gaining traction among consumers; hence, raw nuts are widely procured by butter and oil producers. Every region has different uses for raw macadamia nuts, such as in Australia, Japan, and the U.S., raw nuts are used as key ingredients in cooking, while in Europe, these are widely consumed as snacks.
Coated macadamia nuts are anticipated to register the fastest CAGR of 11.6% during the forecast period. Coated macadamia nuts come in varieties like chocolate, honey/sugar, and coffee-coated. People across the globe love the classic combination of crunchy nuts and the smoothness of their favorite chocolates. Hawaii is popularly known for its chocolate-covered macadamia nuts. Various companies such as Hawaiian Host and Mauna Loa have wide product portfolios, which include chocolate-coated macadamia nuts.
Conventional macadamia nuts led the market with a share of more than 75% in 2021. The rising consumption of nuts in general is boosting the demand for conventional macadamia nuts as they have a lower price in comparison to organic ones. Macadamia nuts are also used for producing macadamia oil, which has gained popularity among businesses as well as customers. The oil is primarily used in the pharmaceutical and cosmetic industries, as it quickly penetrates the epidermis of the skin and has a softening effect.
Organic macadamia nuts are anticipated to witness faster growth during the forecast period. The demand for organic food has been rising owing to growing concerns over personal health as well as the environment. Some companies are incorporating organic macadamia nuts in powdered supplements. Moreover, the growing interest in international ethnic cuisines, combined with the healthy living trend, offers several growth opportunities to organic macadamia nuts processors and manufacturers.
The high dependency of consumers on retail channels and the easy availability of product ranges are factors driving the growth of the offline distribution channel. Furthermore, the rise in the number of supermarkets & hypermarkets is expected to boost this segment’s growth. For instance, in May 2020, Lidl opened its 100th store in the US in Suwanee, Georgia.
The online distribution channel is anticipated to register faster growth. Factors such as the increasing online presence of companies, widespread penetration of the internet across the globe, the availability of various discounts and offers, as well as access to product information, and specifications, are driving the online sales of macadamia nuts. Further, rising trends from food bloggers on social media platforms and heavy advertisements through Instagram are also influencing consumers to purchase through this distribution channel.
Asia Pacific accounted for the largest share of more than 40% in 2021. Macadamia nuts are a popular snack in China, and they are usually eaten right out of the shell. The growth of value-added categories like oil, milk, spread, and milled powder, as well as the rising variety of flavored nuts as snacks, can be attributed to increasing health consciousness among consumers. According to data from the Australian Macadamia Society, China accounted for nearly 27% of all Australian macadamia nuts sales and 80% of Australia’s in-shell nuts exports in 2020.
Europe is anticipated to witness the fastest CAGR of 12.1% during the forecast period. The market for macadamia nuts in Europe is growing due to the increasing popularity of nut consumption. Macadamia nuts are generally consumed as snacks, but they are increasingly being incorporated as ingredients in a variety of food products. Between 2016 and 2020, European imports grew by 6% in value year on year, and by 4% in volume, to reach a value of USD 155 million and a quantity of 7.2 thousand tons in 2020.
With an increasing demand for macadamia nut products from consumers, brands have increased their production and storage capacities. For instance, in November 2021, Marquis Macadamias Australia, part of the Marquis Group, received development approval from the Bundaberg Regional Council for all three stages of expansion of the macadamia processing facility in the region.
Segments Covered in the Report
1. Introduction
1.1. Objectives of the Study
1.2. Market Definition
1.3. Research Scope
1.4. Currency
1.5. Key Target Audience
2. Research Methodology and Assumptions
3. Executive Summary
4. Premium Insights
4.1. Porter’s Five Forces Analysis
4.2. Value Chain Analysis
4.3. Top Investment Pockets
4.3.1. Market Attractiveness Analysis by Product
4.3.2. Market Attractiveness Analysis by Source
4.3.3. Market Attractiveness Analysis by Distribution Channel
4.3.4. Market Attractiveness Analysis by Region
4.4. Industry Trends
5. Market Dynamics
5.1. Market Evaluation
5.2. Drivers
5.2.1. Rising interest of consumer
5.3. Restraints
5.3.1. High cost of Macadamia Nuts
5.4. Opportunities
5.4.1. Rise in production of Macadamia Nuts
6. Global Macadamia Nuts Market Analysis and Forecast, By Product
6.1. Segment Overview
6.2. Raw
6.3. Coated
6.4. Roasted
7. Global Macadamia Nuts Market Analysis and Forecast, By Source
7.1. Segment Overview
7.2. Conventional
7.3. Organic
8. Global Macadamia Nuts Market Analysis and Forecast, By Distribution Channel
8.1. Segment Overview
8.2. Offline
8.3. Online
9. Global Macadamia Nuts Market Analysis and Forecast, By Regional Analysis
9.1. Segment Overview
9.2. North America
9.2.1. U.S.
9.2.2. Canada
9.2.3. Mexico
9.3. Europe
9.3.1. Germany
9.3.2. France
9.3.3. U.K.
9.3.4. Italy
9.3.5. Spain
9.4. Asia-Pacific
9.4.1. Japan
9.4.2. China
9.4.3. India
9.5. South America
9.5.1. Brazil
9.6. Middle East and Africa
9.6.1. UAE
9.6.2. South Africa
10. Global Macadamia Nuts Market-Competitive Landscape
10.1. Overview
10.2. Market Share of Key Players in the Macadamia Nuts Market
10.2.1. Global Company Market Share
10.2.2. North America Company Market Share
10.2.3. Europe Company Market Share
10.2.4. APAC Company Market Share
10.3. Competitive Situations and Trends
10.3.1. Product Launches and Developments
10.3.2. Partnerships, Collaborations, and Agreements
10.3.3. Mergers & Acquisitions
10.3.4. Expansions
11. Company Profiles
11.1. Patons Group
11.1.1. Business Overview
11.1.2. Company Snapshot
11.1.3. Company Market Share Analysis
11.1.4. Company Product Portfolio
11.1.5. Recent Developments
11.1.6. SWOT Analysis
11.2. Hawaiian Host Group
11.2.1. Business Overview
11.2.2. Company Snapshot
11.2.3. Company Market Share Analysis
11.2.4. Company Product Portfolio
11.2.5. Recent Developments
11.2.6. SWOT Analysis
11.3. Macadamias Australia
11.3.1. Business Overview
11.3.2. Company Snapshot
11.3.3. Company Market Share Analysis
11.3.4. Company Product Portfolio
11.3.5. Recent Developments
11.3.6. SWOT Analysis
11.4. Hamakua Macadamia Nut Company
11.4.1. Business Overview
11.4.2. Company Snapshot
11.4.3. Company Market Share Analysis
11.4.4. Company Product Portfolio
11.4.5. Recent Developments
11.4.6. SWOT Analysis
11.5. Marquis Group
11.5.1. Business Overview
11.5.2. Company Snapshot
11.5.3. Company Market Share Analysis
11.5.4. Company Product Portfolio
11.5.5. Recent Developments
11.5.6. SWOT Analysis
11.6. Pacific Farms
11.6.1. Business Overview
11.6.2. Company Snapshot
11.6.3. Company Market Share Analysis
11.6.4. Company Product Portfolio
11.6.5. Recent Developments
11.6.6. SWOT Analysis
11.7. Nambucca Macnuts
11.7.1. Business Overview
11.7.2. Company Snapshot
11.7.3. Company Market Share Analysis
11.7.4. Company Product Portfolio
11.7.5. Recent Developments
11.7.6. SWOT Analysis
11.8. Hand'nHoe Organics
11.8.1. Business Overview
11.8.2. Company Snapshot
11.8.3. Company Market Share Analysis
11.8.4. Company Product Portfolio
11.8.5. Recent Developments
11.8.6. SWOT Analysis
11.9. Agristar Group (Pty) Ltd
11.9.1. Business Overview
11.9.2. Company Snapshot
11.9.3. Company Market Share Analysis
11.9.4. Company Product Portfolio
11.9.5. Recent Developments
11.9.6. SWOT Analysis
11.10. Golden Macadamias
11.10.1. Business Overview
11.10.2. Company Snapshot
11.10.3. Company Market Share Analysis
11.10.4. Company Product Portfolio
11.10.5. Recent Developments
11.10.6. SWOT Analysis
List of Table
1. Global Macadamia Nuts Market, By Product, 2019-2030 (USD Billion)
2. Global Raw Macadamia Nuts Market, By Region, 2019-2030 (USD Billion)
3. Global Coated Macadamia Nuts Market, By Region, 2019-2030 (USD Billion)
4. Global Roasted Macadamia Nuts Market, By Region, 2019-2030 (USD Billion)
5. Global Macadamia Nuts Market, By Source, 2019-2030 (USD Billion)
6. Global Conventional Macadamia Nuts Market, By Region, 2019-2030 (USD Billion)
7. Global Organic Macadamia Nuts Market, By Region, 2019-2030 (USD Billion)
8. Global Macadamia Nuts Market, By Distribution Channel, 2019-2030 (USD Billion)
9. Global Offline Macadamia Nuts Market, By Region, 2019-2030 (USD Billion)
10. Global Online Macadamia Nuts Market, By Region, 2019-2030 (USD Billion)
11. Global Macadamia Nuts Market, By Region, 2019-2030 (USD Billion)
12. North America Macadamia Nuts Market, By Product, 2019-2030 (USD Billion)
13. North America Macadamia Nuts Market, By Source, 2019-2030 (USD Billion)
14. North America Macadamia Nuts Market, By Distribution Channel, 2019-2030 (USD Billion)
15. U.S. Macadamia Nuts Market, By Product, 2019-2030 (USD Billion)
16. U.S. Macadamia Nuts Market, By Source, 2019-2030 (USD Billion)
17. U.S. Macadamia Nuts Market, By Distribution Channel, 2019-2030 (USD Billion)
18. Canada Macadamia Nuts Market, By Product, 2019-2030 (USD Billion)
19. Canada Macadamia Nuts Market, By Source, 2019-2030 (USD Billion)
20. Canada Macadamia Nuts Market, By Distribution Channel, 2019-2030 (USD Billion)
21. Mexico Macadamia Nuts Market, By Product, 2019-2030 (USD Billion)
22. Mexico Macadamia Nuts Market, By Source, 2019-2030 (USD Billion)
23. Mexico Macadamia Nuts Market, By Distribution Channel, 2019-2030 (USD Billion)
24. Europe Macadamia Nuts Market, By Product, 2019-2030 (USD Billion)
25. Europe Macadamia Nuts Market, By Source, 2019-2030 (USD Billion)
26. Europe Macadamia Nuts Market, By Distribution Channel, 2019-2030 (USD Billion)
27. Germany Macadamia Nuts Market, By Product, 2019-2030 (USD Billion)
28. Germany Macadamia Nuts Market, By Source, 2019-2030 (USD Billion)
29. Germany Macadamia Nuts Market, By Distribution Channel, 2019-2030 (USD Billion)
30. France Macadamia Nuts Market, By Product, 2019-2030 (USD Billion)
31. France Macadamia Nuts Market, By Source, 2019-2030 (USD Billion)
32. France Macadamia Nuts Market, By Distribution Channel, 2019-2030 (USD Billion)
33. U.K. Macadamia Nuts Market, By Product, 2019-2030 (USD Billion)
34. U.K. Macadamia Nuts Market, By Source, 2019-2030 (USD Billion)
35. U.K. Macadamia Nuts Market, By Distribution Channel, 2019-2030 (USD Billion)
36. Italy Macadamia Nuts Market, By Product, 2019-2030 (USD Billion)
37. Italy Macadamia Nuts Market, By Source, 2019-2030 (USD Billion)
38. Italy Macadamia Nuts Market, By Distribution Channel, 2019-2030 (USD Billion)
39. Spain Macadamia Nuts Market, By Product, 2019-2030 (USD Billion)
40. Spain Macadamia Nuts Market, By Source, 2019-2030 (USD Billion)
41. Spain Macadamia Nuts Market, By Distribution Channel, 2019-2030 (USD Billion)
42. Asia Pacific Macadamia Nuts Market, By Product, 2019-2030 (USD Billion)
43. Asia Pacific Macadamia Nuts Market, By Source, 2019-2030 (USD Billion)
44. Asia Pacific Macadamia Nuts Market, By Distribution Channel, 2019-2030 (USD Billion)
45. Japan Macadamia Nuts Market, By Product, 2019-2030 (USD Billion)
46. Japan Macadamia Nuts Market, By Source, 2019-2030 (USD Billion)
47. Japan Macadamia Nuts Market, By Distribution Channel, 2019-2030 (USD Billion)
48. China Macadamia Nuts Market, By Product, 2019-2030 (USD Billion)
49. China Macadamia Nuts Market, By Source, 2019-2030 (USD Billion)
50. China Macadamia Nuts Market, By Distribution Channel, 2019-2030 (USD Billion)
51. India Macadamia Nuts Market, By Product, 2019-2030 (USD Billion)
52. India Macadamia Nuts Market, By Source, 2019-2030 (USD Billion)
53. India Macadamia Nuts Market, By Distribution Channel, 2019-2030 (USD Billion)
54. South America Macadamia Nuts Market, By Product, 2019-2030 (USD Billion)
55. South America Macadamia Nuts Market, By Source, 2019-2030 (USD Billion)
56. South America Macadamia Nuts Market, By Distribution Channel, 2019-2030 (USD Billion)
57. Brazil Macadamia Nuts Market, By Product, 2019-2030 (USD Billion)
58. Brazil Macadamia Nuts Market, By Source, 2019-2030 (USD Billion)
59. Brazil Macadamia Nuts Market, By Distribution Channel, 2019-2030 (USD Billion)
60. Middle East and Africa Macadamia Nuts Market, By Product, 2019-2030 (USD Billion)
61. Middle East and Africa Macadamia Nuts Market, By Source, 2019-2030 (USD Billion)
62. Middle East and Africa Macadamia Nuts Market, By Distribution Channel, 2019-2030 (USD Billion)
63. UAE Macadamia Nuts Market, By Product, 2019-2030 (USD Billion)
64. UAE Macadamia Nuts Market, By Source, 2019-2030 (USD Billion)
65. UAE Macadamia Nuts Market, By Distribution Channel, 2019-2030 (USD Billion)
66. South Africa Macadamia Nuts Market, By Product, 2019-2030 (USD Billion)
67. South Africa Macadamia Nuts Market, By Source, 2019-2030 (USD Billion)
68. South Africa Macadamia Nuts Market, By Distribution Channel, 2019-2030 (USD Billion)
List of Figures
1. Global Macadamia Nuts Market Segmentation
2. Macadamia Nuts Market: Research Methodology
3. Market Size Estimation Methodology: Bottom-Up Approach
4. Market Size Estimation Methodology: Top-Down Approach
5. Data Triangulation
6. Porter’s Five Forces Analysis
7. Value Chain Analysis
8. Global Macadamia Nuts Market Attractiveness Analysis by Product
9. Global Macadamia Nuts Market Attractiveness Analysis by Source
10. Global Macadamia Nuts Market Attractiveness Analysis by Distribution Channel
11. Global Macadamia Nuts Market Attractiveness Analysis by Region
12. Global Macadamia Nuts Market: Dynamics
13. Global Macadamia Nuts Market Share by Product (2022 & 2030)
14. Global Macadamia Nuts Market Share by Source (2022 & 2030)
15. Global Macadamia Nuts Market Share by Distribution Channel (2022 & 2030)
16. Global Macadamia Nuts Market Share by Regions (2022 & 2030)
17. Global Macadamia Nuts Market Share by Company (2021)
Research has its special purpose to undertake marketing efficiently. In this competitive scenario, businesses need information across all industry verticals; the information about customer wants, market demand, competition, industry trends, distribution channels etc. This information needs to be updated regularly because businesses operate in a dynamic environment. Our organization, The Brainy Insights incorporates scientific and systematic research procedures in order to get proper market insights and industry analysis for overall business success. The analysis consists of studying the market from a miniscule level wherein we implement statistical tools which helps us in examining the data with accuracy and precision.
Our research reports feature both; quantitative and qualitative aspects for any market. Qualitative information for any market research process are fundamental because they reveal the customer needs and wants, usage and consumption for any product/service related to a specific industry. This in turn aids the marketers/investors in knowing certain perceptions of the customers. Qualitative research can enlighten about the different product concepts and designs along with unique service offering that in turn, helps define marketing problems and generate opportunities. On the other hand, quantitative research engages with the data collection process through interviews, e-mail interactions, surveys and pilot studies. Quantitative aspects for the market research are useful to validate the hypotheses generated during qualitative research method, explore empirical patterns in the data with the help of statistical tools, and finally make the market estimations.
The Brainy Insights offers comprehensive research and analysis, based on a wide assortment of factual insights gained through interviews with CXOs and global experts and secondary data from reliable sources. Our analysts and industry specialist assume vital roles in building up statistical tools and analysis models, which are used to analyse the data and arrive at accurate insights with exceedingly informative research discoveries. The data provided by our organization have proven precious to a diverse range of companies, facilitating them to address issues such as determining which products/services are the most appealing, whether or not customers use the product in the manner anticipated, the purchasing intentions of the market and many others.
Our research methodology encompasses an idyllic combination of primary and secondary initiatives. Key phases involved in this process are listed below:

The phase involves the gathering and collecting of market data and its related information with the help of different sources & research procedures.

The data procurement stage involves in data gathering and collecting through various data sources.
This stage involves in extensive research. These data sources includes:
Purchased Database: Purchased databases play a crucial role in estimating the market sizes irrespective of the domain. Our purchased database includes:
Primary Research: The Brainy Insights interacts with leading companies and experts of the concerned domain to develop the analyst team’s market understanding and expertise. It improves and substantiates every single data presented in the market reports. Primary research mainly involves in telephonic interviews, E-mail interactions and face-to-face interviews with the raw material providers, manufacturers/producers, distributors, & independent consultants. The interviews that we conduct provides valuable data on market size and industry growth trends prevailing in the market. Our organization also conducts surveys with the various industry experts in order to gain overall insights of the industry/market. For instance, in healthcare industry we conduct surveys with the pharmacists, doctors, surgeons and nurses in order to gain insights and key information of a medical product/device/equipment which the customers are going to usage. Surveys are conducted in the form of questionnaire designed by our own analyst team. Surveys plays an important role in primary research because surveys helps us to identify the key target audiences of the market. Additionally, surveys helps to identify the key target audience engaged with the market. Our survey team conducts the survey by targeting the key audience, thus gaining insights from them. Based on the perspectives of the customers, this information is utilized to formulate market strategies. Moreover, market surveys helps us to understand the current competitive situation of the industry. To be precise, our survey process typically involve with the 360 analysis of the market. This analytical process begins by identifying the prospective customers for a product or service related to the market/industry to obtain data on how a product/service could fit into customers’ lives.

Secondary Research: The secondary data sources includes information published by the on-profit organizations such as World bank, WHO, company fillings, investor presentations, annual reports, national government documents, statistical databases, blogs, articles, white papers and others. From the annual report, we analyse a company’s revenue to understand the key segment and market share of that organization in a particular region. We analyse the company websites and adopt the product mapping technique which is important for deriving the segment revenue. In the product mapping method, we select and categorize the products offered by the companies catering to domain specific market, deduce the product revenue for each of the companies so as to get overall estimation of the market size. We also source data and analyses trends based on information received from supply side and demand side intermediaries in the value chain. The supply side denotes the data gathered from supplier, distributor, wholesaler and the demand side illustrates the data gathered from the end customers for respective market domain.

The supply side for a domain specific market is analysed by:
The demand side for the market is estimated through:
In-house Library: Apart from these third-party sources, we have our in-house library of qualitative and quantitative information. Our in-house database includes market data for various industry and domains. These data are updated on regular basis as per the changing market scenario. Our library includes, historic databases, internal audit reports and archives.
Sometimes there are instances where there is no metadata or raw data available for any domain specific market. For those cases, we use our expertise to forecast and estimate the market size in order to generate comprehensive data sets. Our analyst team adopt a robust research technique in order to produce the estimates:
Data Synthesis: This stage involves the analysis & mapping of all the information obtained from the previous step. It also involves in scrutinizing the data for any discrepancy observed while data gathering related to the market. The data is collected with consideration to the heterogeneity of sources. Robust scientific techniques are in place for synthesizing disparate data sets and provide the essential contextual information that can orient market strategies. The Brainy Insights has extensive experience in data synthesis where the data passes through various stages:


Market Deduction & Formulation: The final stage comprises of assigning data points at appropriate market spaces so as to deduce feasible conclusions. Analyst perspective & subject matter expert based holistic form of market sizing coupled with industry analysis also plays a crucial role in this stage.
This stage involves in finalization of the market size and numbers that we have collected from data integration step. With data interpolation, it is made sure that there is no gap in the market data. Successful trend analysis is done by our analysts using extrapolation techniques, which provide the best possible forecasts for the market.
Data Validation & Market Feedback: Validation is the most important step in the process. Validation & re-validation via an intricately designed process helps us finalize data-points to be used for final calculations.

The Brainy Insights interacts with leading companies and experts of the concerned domain to develop the analyst team’s market understanding and expertise. It improves and substantiates every single data presented in the market reports. The data validation interview and discussion panels are typically composed of the most experienced industry members. The participants include, however, are not limited to:
Moreover, we always validate our data and findings through primary respondents from all the major regions we are working on.


Free Customization
Fortune 500 Clients
Free Yearly Update On Purchase Of Multi/Corporate License
Companies Served Till Date