- +1-315-215-1633
- sales@thebrainyinsights.com

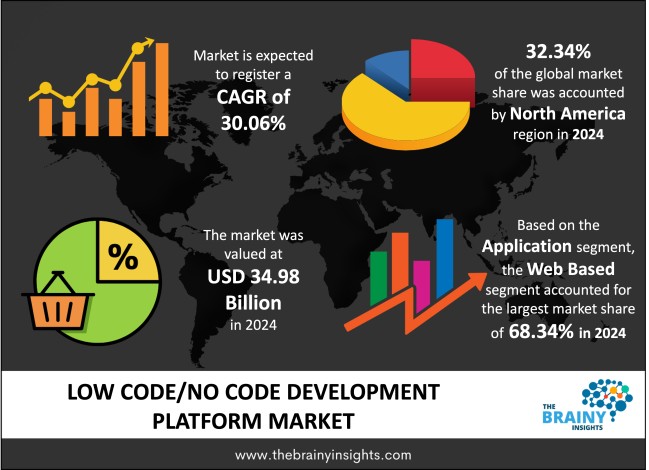
The global Low Code/No Code Development Platform market was valued at USD 34.98 Billion in 2024 and grew at a CAGR of 30.06% from 2025 to 2034. The market is expected to reach USD 484.51 Billion by 2034. The rapid development of software technologies largely drives the market. It has been observed that the development of various types of software, such as websites and apps, is now easier. It is more feasible now. These changes are attributed to the increasing adoption of low-code and no-code development platforms. Low-code platforms enable the swift deployment of applications with minimal or no IT involvement. These are becoming the ideal solutions for businesses which require quick development and deployment of applications with fewer resources. It helps the single business unit in building, modifying, and managing apps. Solutions to this can be developed by those who face the problems and provide an efficient way to fast-track digital transformation projects. Hence, both low-code and no-code platforms have gained momentum within organizations. Low-code and no-code tools have become a valuable way to mitigate talent shortages, as they enable organisations to build software systems without the need for a large team of developers.
Low-code/No-Code platforms generally feature visual development tools with a drag-and-drop interface. Thus, it streamlines the process, making it faster, easier, and more affordable by decreasing the dependency on IT professionals, agencies, and organizations. There is a growing demand for the digitization of business and automation of workflows. Moreover, the need for websites and apps has increased significantly. Many other technical aspects and infrastructures are creating the need for an alternative to custom development, and hence, the demand for Low Code and No Code Development platforms is growing. These professional developers generally charge a significant amount of money, as their expertise is indispensable. There is a great demand for their skill set, but the supply is less. Good developers are difficult to find, but the company's requirement for them is more than ever. Many small businesses generally don't have software engineers as the cost of employing the developer is higher. A low-code approach to developing an organisational app requires fewer resources and is also suitable for small businesses. The use of low-code/no-code is transforming the development method. It is also helping in reducing the workload of the engineering teams. Based on one of the studies, around 80% of the respondents agreed that the integration of low-code solutions helped free up the developer's time, allowing them to focus on more strategic and high-level projects. Additionally, it was noted that continuous cost optimization optimizations were implemented during the COVID-19 pandemic; however, the surge in remote production increased demand for low-code development platforms. All businesses are demanding their IT departments to develop more apps, and hence, the demand for code development platforms is gradually increasing. Its demand is growing due to a surge in the need for custom applications driven by the growing digitalization age. All these factors are ultimately driving the global Low Code/No Code Development Platform market.
Get an overview of this study by requesting a free sample
Demand for hyper-automation– There is a surge in the adoption of low-code platforms due to the high demand for hyper-automation. Business systems are being swiftly automated, along with IT processes. Low-code and no-code platforms help businesses quickly develop and automate their systems with the use of citizen developers, eliminating the need for high technical expertise. These platforms need less or no code to operate. There is no need to write each line of code manually, as these platforms offer a drag-and-drop approach. These platforms utilise a set of building blocks that individuals with limited or no coding experience can use for development, such as creating custom apps. Microsoft, Salesforce, Appian, Oracle and Mendix are some of the leading players which offer such solutions. As AI becomes more popular, Organisations like Salesforce, Microsoft, and Mendix, among others, have introduced AI into their platforms, allowing developers to farm out tasks to virtual AI assistants. All these factors will eventually propel the growth of the Low Code/No Code Development Platform market.
Integration issues – Low-code/no-code development platforms often face integration issues with existing systems, and they struggle to seamlessly integrate with all types of software systems. It thus potentially disrupts workflows and increases the cost of business, which relies on numerous software applications. Additionally, there are some limited customisation options and security concerns. All these factors are acting as restraints for the market.
Need for quick development process – The low-code/no-code development platform appears to be experiencing tremendous growth due to its ease of use and rapid development process. Instead of starting from scratch to create an app, an individual with limited or no coding experience can develop the app using a set of pre-programmed building blocks. It helps save time in the building process and also significantly decreases the cost associated with app development. Hence, low-code solutions are becoming an important tool for the hyper-automation process. Many organisations are adopting the composable mindset, and hence, there is a need for component-based architecture, which enables the reuse, combination, and reorientation of app components to provide significant efficiency and flexibility during app creation. Low code solutions offer component-based model development due to their modular building block interface. All these factors will increase the demand for Low-Code/No-Code Development Platforms during the forecasting period.
The regions analysed for the market include North America, Europe, South America, Asia Pacific, the Middle East, and Africa. North America emerged as the most significant global Low Code/No Code Development Platform market, with a 32.34% market revenue share in 2024.
The North American region leads the Low Code/No Code Development Platform market, primarily due to the presence of numerous leading players in the region. These organisations are primarily focused on developing technologically advanced products. The leaders in the market are focusing on increasing their offerings of low-code/no-code development platforms and services to meet the demands of their clients. These factors are driving a high demand for Low-Code/No-Code Development Platforms in the region.
North America Region Low Code/No Code Development Platform Market Share in 2024 – 32.34%
www.thebrainyinsights.com
Check the geographical analysis of this market by requesting a free sample
The application segment is divided into web based and mobile based. Web based segment dominated the market, with a market share of around 68.34% in 2024. This significant share is attributed to its high demand. It is largely driven by the speedy growth in digital transformation globally and the surge in the requirement for faster application development cycles, especially among non-IT professionals. These web-based platforms help in faster development and broader accessibility. It also reduces the development cost. This platform has become popular among businesses of all sizes.
The end user segment is divided into BFSI, retail, education, automotive & manufacturing, transportation & logistics, IT & telecom and Others. The BFSI segment dominated the market, with a market share of around 26.23% in 2024. This significant share is due to a surge in demand for digitisation in financial services. It consists of several processes, including back-office operations, client origination, onboarding, and self-service options. These platforms are increasing due to digital transformation, streamlining of operations and the requirement for enhanced customer experiences.
| Attribute | Description |
|---|---|
| Market Size | Revenue (USD Billion) |
| Market size value in 2024 | USD 34.98 Billion |
| Market size value in 2034 | USD 484.51 Billion |
| CAGR (2025 to 2034) | 30.06% |
| Historical data | 2021-2023 |
| Base Year | 2024 |
| Forecast | 2025-2034 |
| Region | The regions analyzed for the market are Asia Pacific, Europe, South America, North America, and Middle East and Africa. Furthermore, the regions are further analyzed at the country level. |
| Segments | Application and End User |
As per The Brainy Insights, the size of the global Low Code/No Code Development Platform market was valued at USD 34.98 Billion in 2024 to USD 484.51 Billion by 2034.
Global Low Code/No Code Development Platform market is growing at a CAGR of 30.06% during the forecast period 2025-2034.
The market's growth will be influenced by the demand for hyper-automation.
Integration issues could hamper the market growth.
This study forecasts revenue at global, regional, and country levels from 2021 to 2034. The Brainy Insights has segmented the global Low Code/No Code Development Platform market based on below mentioned segments:
Global Low Code/No Code Development Platform Market by Application:
Global Low Code/No Code Development Platform Market by End User:
Global Low Code/No Code Development Platform Market by Region:
Research has its special purpose to undertake marketing efficiently. In this competitive scenario, businesses need information across all industry verticals; the information about customer wants, market demand, competition, industry trends, distribution channels etc. This information needs to be updated regularly because businesses operate in a dynamic environment. Our organization, The Brainy Insights incorporates scientific and systematic research procedures in order to get proper market insights and industry analysis for overall business success. The analysis consists of studying the market from a miniscule level wherein we implement statistical tools which helps us in examining the data with accuracy and precision.
Our research reports feature both; quantitative and qualitative aspects for any market. Qualitative information for any market research process are fundamental because they reveal the customer needs and wants, usage and consumption for any product/service related to a specific industry. This in turn aids the marketers/investors in knowing certain perceptions of the customers. Qualitative research can enlighten about the different product concepts and designs along with unique service offering that in turn, helps define marketing problems and generate opportunities. On the other hand, quantitative research engages with the data collection process through interviews, e-mail interactions, surveys and pilot studies. Quantitative aspects for the market research are useful to validate the hypotheses generated during qualitative research method, explore empirical patterns in the data with the help of statistical tools, and finally make the market estimations.
The Brainy Insights offers comprehensive research and analysis, based on a wide assortment of factual insights gained through interviews with CXOs and global experts and secondary data from reliable sources. Our analysts and industry specialist assume vital roles in building up statistical tools and analysis models, which are used to analyse the data and arrive at accurate insights with exceedingly informative research discoveries. The data provided by our organization have proven precious to a diverse range of companies, facilitating them to address issues such as determining which products/services are the most appealing, whether or not customers use the product in the manner anticipated, the purchasing intentions of the market and many others.
Our research methodology encompasses an idyllic combination of primary and secondary initiatives. Key phases involved in this process are listed below:

The phase involves the gathering and collecting of market data and its related information with the help of different sources & research procedures.

The data procurement stage involves in data gathering and collecting through various data sources.
This stage involves in extensive research. These data sources includes:
Purchased Database: Purchased databases play a crucial role in estimating the market sizes irrespective of the domain. Our purchased database includes:
Primary Research: The Brainy Insights interacts with leading companies and experts of the concerned domain to develop the analyst team’s market understanding and expertise. It improves and substantiates every single data presented in the market reports. Primary research mainly involves in telephonic interviews, E-mail interactions and face-to-face interviews with the raw material providers, manufacturers/producers, distributors, & independent consultants. The interviews that we conduct provides valuable data on market size and industry growth trends prevailing in the market. Our organization also conducts surveys with the various industry experts in order to gain overall insights of the industry/market. For instance, in healthcare industry we conduct surveys with the pharmacists, doctors, surgeons and nurses in order to gain insights and key information of a medical product/device/equipment which the customers are going to usage. Surveys are conducted in the form of questionnaire designed by our own analyst team. Surveys plays an important role in primary research because surveys helps us to identify the key target audiences of the market. Additionally, surveys helps to identify the key target audience engaged with the market. Our survey team conducts the survey by targeting the key audience, thus gaining insights from them. Based on the perspectives of the customers, this information is utilized to formulate market strategies. Moreover, market surveys helps us to understand the current competitive situation of the industry. To be precise, our survey process typically involve with the 360 analysis of the market. This analytical process begins by identifying the prospective customers for a product or service related to the market/industry to obtain data on how a product/service could fit into customers’ lives.

Secondary Research: The secondary data sources includes information published by the on-profit organizations such as World bank, WHO, company fillings, investor presentations, annual reports, national government documents, statistical databases, blogs, articles, white papers and others. From the annual report, we analyse a company’s revenue to understand the key segment and market share of that organization in a particular region. We analyse the company websites and adopt the product mapping technique which is important for deriving the segment revenue. In the product mapping method, we select and categorize the products offered by the companies catering to domain specific market, deduce the product revenue for each of the companies so as to get overall estimation of the market size. We also source data and analyses trends based on information received from supply side and demand side intermediaries in the value chain. The supply side denotes the data gathered from supplier, distributor, wholesaler and the demand side illustrates the data gathered from the end customers for respective market domain.

The supply side for a domain specific market is analysed by:
The demand side for the market is estimated through:
In-house Library: Apart from these third-party sources, we have our in-house library of qualitative and quantitative information. Our in-house database includes market data for various industry and domains. These data are updated on regular basis as per the changing market scenario. Our library includes, historic databases, internal audit reports and archives.
Sometimes there are instances where there is no metadata or raw data available for any domain specific market. For those cases, we use our expertise to forecast and estimate the market size in order to generate comprehensive data sets. Our analyst team adopt a robust research technique in order to produce the estimates:
Data Synthesis: This stage involves the analysis & mapping of all the information obtained from the previous step. It also involves in scrutinizing the data for any discrepancy observed while data gathering related to the market. The data is collected with consideration to the heterogeneity of sources. Robust scientific techniques are in place for synthesizing disparate data sets and provide the essential contextual information that can orient market strategies. The Brainy Insights has extensive experience in data synthesis where the data passes through various stages:


Market Deduction & Formulation: The final stage comprises of assigning data points at appropriate market spaces so as to deduce feasible conclusions. Analyst perspective & subject matter expert based holistic form of market sizing coupled with industry analysis also plays a crucial role in this stage.
This stage involves in finalization of the market size and numbers that we have collected from data integration step. With data interpolation, it is made sure that there is no gap in the market data. Successful trend analysis is done by our analysts using extrapolation techniques, which provide the best possible forecasts for the market.
Data Validation & Market Feedback: Validation is the most important step in the process. Validation & re-validation via an intricately designed process helps us finalize data-points to be used for final calculations.

The Brainy Insights interacts with leading companies and experts of the concerned domain to develop the analyst team’s market understanding and expertise. It improves and substantiates every single data presented in the market reports. The data validation interview and discussion panels are typically composed of the most experienced industry members. The participants include, however, are not limited to:
Moreover, we always validate our data and findings through primary respondents from all the major regions we are working on.


Free Customization
Fortune 500 Clients
Free Yearly Update On Purchase Of Multi/Corporate License
Companies Served Till Date