- +1-315-215-1633
- sales@thebrainyinsights.com

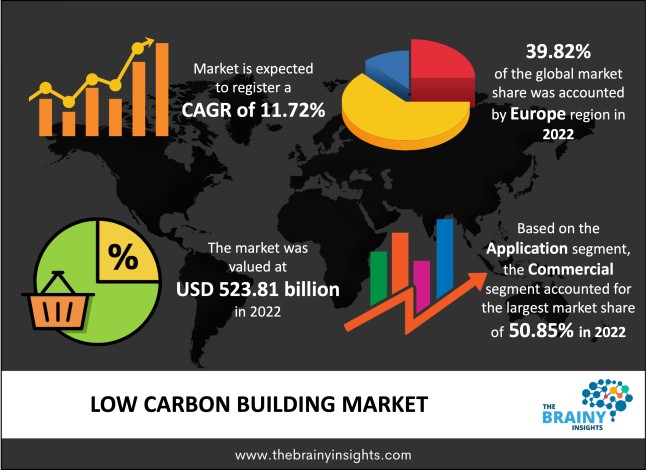
The global low-carbon building market was valued at USD 523.81 Billion in 2022 and grew at a CAGR of 11.72% from 2023 to 2032. The market is expected to reach USD 1586.65 Billion by 2032. The growth of the low-carbon building market can be attributed to the rising regulations demanding decarbonization of the construction industry. Further, the increasing technological advancement in the development of low-carbon components has played a pivotal role in the market growth.
A building that produces noticeably fewer greenhouse gases than a typical building is called a low-carbon building. A low-carbon building must reduce greenhouse gas emissions from traditional buildings by at least 80% to qualify as climate change neutral. As LCBs are made of materials with lower embodied carbon, buildings have higher energy efficiency. Reducing the direct consumption of fossil fuels, such as gas, coal, and oil, is necessary to achieve low carbon. It also necessitates cutting back on cooking and cleaning that indirectly use fossil fuels. Optimizing the structure, orientation, size, window/glazing position, and appropriate material selection for the building envelope are low-energy or low-carbon building design goals. The low-energy building idea also includes integrating energy-efficient HVAC (heating, ventilation, and air conditioning) systems with TES.
Get an overview of this study by requesting a free sample
Increasing construction for low-carbon buildings: Approximately half of all fuel burned in most of the nation is accounted for by buildings, with commercial buildings accounting for half of this total. Reduced embodied carbon materials are used to create and construct low-carbon structures, which increase building energy efficiency. With increasing urbanization, carbon emissions from building energy use account for a sizable portion of anthropogenic emissions in metropolitan areas. Construction of low-carbon buildings requires reducing energy use during the decades-long building operating period. While other significant characteristics of buildings and cities are disregarded, many frameworks, such as low-carbon buildings/cities and zero-energy buildings, significantly emphasize the influence of greenhouse gas emissions on sustainability.
Cost of installation: The installation of low-carbon buildings can be costly depending on the size of the structure and the material utilized. This also depends on the existing structure's quality, which must be strong enough to sustain the retrofits. The cost of components determines the actual cost of the instalment. As many components are used to construct low-carbon buildings, the final installation cost must be lowered. For market participants, this volatility in material cost impacts the market's growth.
Favourable government initiatives: The increase in the imposition of stringent regulations to reduce ecological footprints and decarbonization has pushed regional governments to take suitable measures. Also, the increase in energy costs and the continuous demand from the industries have pressured the regional governments to set up low-carbon buildings, which will reduce the cost and increase the optimality of the industries. In many regions, the government is offering tax initiatives to companies installing low-carbon buildings and complying with energy-efficient laws. The regional agencies are also setting up low-carbon buildings for industries such as energy auditing and consulting, optimizing processes and verifying the energy units.
The regions analyzed for the market include North America, Europe, South America, Asia Pacific, the Middle East, and Africa. Europe emerged as the most significant low-carbon building market, with a 39.82% market revenue share in 2022.
Europe region will account for the largest market share with revenue growth. The region has a high demand for decarbonized buildings, especially in the commercial and industrial sectors. The imposition of stringent regulations regarding sustainable building practices propels the regional market's growth. The regional authorities prioritize energy-efficient structures over traditional ones and thus invest resources in developing such buildings.
Europe region Low Carbon Building Market Share in 2022 - 39.82%
www.thebrainyinsights.com
Check the geographical analysis of this market by requesting a free sample
The product type segment is divided into renewable energy systems, low-carbon HVAC systems, energy-efficient systems and others. The energy-efficient systems segment dominated the market, with a share of around 47.91% in 2022. Energy-efficient buildings are made to use less energy, produce less waste, and emit fewer emissions. Energy conservation is maximized when a building is energy efficient since it provides a suitable living space with low energy usage and waste.
The application segment is divided into commercial, residential, industrial and others. The commercial segment dominated the market, with a share of around 50.85% in 2022. The commercial industry is moving away from non-renewable building materials like steel and concrete. It is shifting towards low-carbon and renewable because construction materials account for 11% of the world's CO2 emissions today.
| Attribute | Description |
|---|---|
| Market Size | Revenue (USD Billion) |
| Market size value in 2022 | USD 523.81 Billion |
| Market size value in 2032 | USD 1586.65 Billion |
| CAGR (2023 to 2032) | 11.72% |
| Historical data | 2019-2021 |
| Base Year | 2022 |
| Forecast | 2023-2032 |
| Region | The regions analyzed for the market are Asia Pacific, Europe, South America, North America, and Middle East & Africa. Furthermore, the regions are further analyzed at the country level. |
| Segments | Type and Application |
As per The Brainy Insights, the size of the low carbon buildings market was valued 523.81 Billion in 2022 to USD 1586.65 Billion by 2032.
Global low carbon buildings market is growing at a CAGR of 11.72% during the forecast period 2023-2032.
The global low carbon buildings market has been segmented based on type, application, and regions. Energy efficient systems led the market in 2022 in the type segment. Commercial led the market in 2022 in the application segment.
Europe region emerged as the largest market for the low carbon buildings.
The market's growth will be influenced by the growing construction of low carbon buildings.
The high installation cost can hamper the market growth.
The increasing investments in decarbonisation of construction industry are providing huge opportunities to the market.
This study forecasts revenue at global, regional, and country levels from 2019 to 2032. The Brainy Insights has segmented the global low carbon buildings market based on below mentioned segments:
Global Low Carbon Buildings Market by Type:
Global Low Carbon Buildings Market by Application:
Global Low Carbon Buildings Market by Region:
Research has its special purpose to undertake marketing efficiently. In this competitive scenario, businesses need information across all industry verticals; the information about customer wants, market demand, competition, industry trends, distribution channels etc. This information needs to be updated regularly because businesses operate in a dynamic environment. Our organization, The Brainy Insights incorporates scientific and systematic research procedures in order to get proper market insights and industry analysis for overall business success. The analysis consists of studying the market from a miniscule level wherein we implement statistical tools which helps us in examining the data with accuracy and precision.
Our research reports feature both; quantitative and qualitative aspects for any market. Qualitative information for any market research process are fundamental because they reveal the customer needs and wants, usage and consumption for any product/service related to a specific industry. This in turn aids the marketers/investors in knowing certain perceptions of the customers. Qualitative research can enlighten about the different product concepts and designs along with unique service offering that in turn, helps define marketing problems and generate opportunities. On the other hand, quantitative research engages with the data collection process through interviews, e-mail interactions, surveys and pilot studies. Quantitative aspects for the market research are useful to validate the hypotheses generated during qualitative research method, explore empirical patterns in the data with the help of statistical tools, and finally make the market estimations.
The Brainy Insights offers comprehensive research and analysis, based on a wide assortment of factual insights gained through interviews with CXOs and global experts and secondary data from reliable sources. Our analysts and industry specialist assume vital roles in building up statistical tools and analysis models, which are used to analyse the data and arrive at accurate insights with exceedingly informative research discoveries. The data provided by our organization have proven precious to a diverse range of companies, facilitating them to address issues such as determining which products/services are the most appealing, whether or not customers use the product in the manner anticipated, the purchasing intentions of the market and many others.
Our research methodology encompasses an idyllic combination of primary and secondary initiatives. Key phases involved in this process are listed below:

The phase involves the gathering and collecting of market data and its related information with the help of different sources & research procedures.

The data procurement stage involves in data gathering and collecting through various data sources.
This stage involves in extensive research. These data sources includes:
Purchased Database: Purchased databases play a crucial role in estimating the market sizes irrespective of the domain. Our purchased database includes:
Primary Research: The Brainy Insights interacts with leading companies and experts of the concerned domain to develop the analyst team’s market understanding and expertise. It improves and substantiates every single data presented in the market reports. Primary research mainly involves in telephonic interviews, E-mail interactions and face-to-face interviews with the raw material providers, manufacturers/producers, distributors, & independent consultants. The interviews that we conduct provides valuable data on market size and industry growth trends prevailing in the market. Our organization also conducts surveys with the various industry experts in order to gain overall insights of the industry/market. For instance, in healthcare industry we conduct surveys with the pharmacists, doctors, surgeons and nurses in order to gain insights and key information of a medical product/device/equipment which the customers are going to usage. Surveys are conducted in the form of questionnaire designed by our own analyst team. Surveys plays an important role in primary research because surveys helps us to identify the key target audiences of the market. Additionally, surveys helps to identify the key target audience engaged with the market. Our survey team conducts the survey by targeting the key audience, thus gaining insights from them. Based on the perspectives of the customers, this information is utilized to formulate market strategies. Moreover, market surveys helps us to understand the current competitive situation of the industry. To be precise, our survey process typically involve with the 360 analysis of the market. This analytical process begins by identifying the prospective customers for a product or service related to the market/industry to obtain data on how a product/service could fit into customers’ lives.

Secondary Research: The secondary data sources includes information published by the on-profit organizations such as World bank, WHO, company fillings, investor presentations, annual reports, national government documents, statistical databases, blogs, articles, white papers and others. From the annual report, we analyse a company’s revenue to understand the key segment and market share of that organization in a particular region. We analyse the company websites and adopt the product mapping technique which is important for deriving the segment revenue. In the product mapping method, we select and categorize the products offered by the companies catering to domain specific market, deduce the product revenue for each of the companies so as to get overall estimation of the market size. We also source data and analyses trends based on information received from supply side and demand side intermediaries in the value chain. The supply side denotes the data gathered from supplier, distributor, wholesaler and the demand side illustrates the data gathered from the end customers for respective market domain.

The supply side for a domain specific market is analysed by:
The demand side for the market is estimated through:
In-house Library: Apart from these third-party sources, we have our in-house library of qualitative and quantitative information. Our in-house database includes market data for various industry and domains. These data are updated on regular basis as per the changing market scenario. Our library includes, historic databases, internal audit reports and archives.
Sometimes there are instances where there is no metadata or raw data available for any domain specific market. For those cases, we use our expertise to forecast and estimate the market size in order to generate comprehensive data sets. Our analyst team adopt a robust research technique in order to produce the estimates:
Data Synthesis: This stage involves the analysis & mapping of all the information obtained from the previous step. It also involves in scrutinizing the data for any discrepancy observed while data gathering related to the market. The data is collected with consideration to the heterogeneity of sources. Robust scientific techniques are in place for synthesizing disparate data sets and provide the essential contextual information that can orient market strategies. The Brainy Insights has extensive experience in data synthesis where the data passes through various stages:


Market Deduction & Formulation: The final stage comprises of assigning data points at appropriate market spaces so as to deduce feasible conclusions. Analyst perspective & subject matter expert based holistic form of market sizing coupled with industry analysis also plays a crucial role in this stage.
This stage involves in finalization of the market size and numbers that we have collected from data integration step. With data interpolation, it is made sure that there is no gap in the market data. Successful trend analysis is done by our analysts using extrapolation techniques, which provide the best possible forecasts for the market.
Data Validation & Market Feedback: Validation is the most important step in the process. Validation & re-validation via an intricately designed process helps us finalize data-points to be used for final calculations.

The Brainy Insights interacts with leading companies and experts of the concerned domain to develop the analyst team’s market understanding and expertise. It improves and substantiates every single data presented in the market reports. The data validation interview and discussion panels are typically composed of the most experienced industry members. The participants include, however, are not limited to:
Moreover, we always validate our data and findings through primary respondents from all the major regions we are working on.


Free Customization
Fortune 500 Clients
Free Yearly Update On Purchase Of Multi/Corporate License
Companies Served Till Date