- +1-315-215-1633
- sales@thebrainyinsights.com

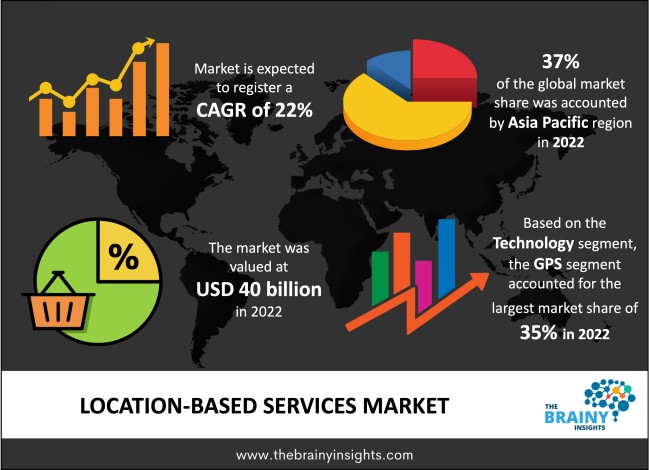
The global location-based services market was valued at USD 40 billion in 2022 and grew at a CAGR of 22% from 2023 to 2032. The market is expected to reach USD 292.18 billion by 2032. The increasing ownership of smart connected devices will drive the growth of the global location-based services market.
A broad name for software applications that employ geographic data and information to offer users services or information is "location-based services." it means that the mobile applications of the software use the location or the geographical latitude and longitude to offer various services as requested by the consumer. Google Maps is an excellent example of location-based services. Similarly, location-based services are utilized in various situations, including health, entertainment, mobility solutions, hospitality and others. Consumers use location-based services to navigate cities and find transportation through applications like Uber and Ola and nearby restaurants, hotels, stays, eateries, café, clubs and other institutions. Businesses use these services to learn more about their market and consumers. Businesses may learn more about their clients' purchasing habits by using location-based services, such as how frequently they visit the business, what time of day they come, whether they take advantage of your offers, and more, all of which help create successful marketing initiatives. Lacation-based services are also used for security purposes wherein they help users broadcast their location to speed up rescue attempts or live-tracking of loved ones, especially females. In real-time, location-based services combine geospatial technology, information and communication technologies, and the Internet to deliver targeted information to people based on their geographic position.
Get an overview of this study by requesting a free sample
The increasing ownership of smart connected devices – The digital age has transformed the world economy with growing ownership of smart connected devices. Given the increasing number of players and technological advancements, the increasing disposable income of the population and the decreasing retail costs of smartphones have augmented the digital economy's growth. The government initiatives to transform the market economy by improving the IT infrastructure have also assisted the market's growth by improving and expanding the internet penetration, accessibility and affordability of data services. Introducing location-based services through mobile applications is also augmenting the market's growth. The young population is driving the demand for more location-based services, given the high digital literacy in this niche segment of the population. Therefore, increasing smart connected device ownership will drive the growth of the global location-based services market.
The high costs of infrastructure and installation – The backend of location-based services requires substantial capital, research, infrastructure, and personnel for maintenance, upgradation, Monitoring, etc. It is a time-consuming and capital-intensive process. Deploying location-based services' accuracy is also a concern that needs attention and capital. Therefore, the high infrastructure and installation costs hamper the market's growth.
The introduction of new technologies – the constant technological innovation has led to the development and improvement in the IT infrastructure with the introduction of 5G network, optic fibre, AI, IoT and others. These technologies can significantly improve the applications and features of location-based services, thereby offering lucrative opportunities for the market during the forecast period.
The regions analyzed for the market include North America, Europe, South America, Asia Pacific, the Middle East, and Africa. Asia Pacific emerged as the largest global location-based services market, with a 37% market revenue share in 2022.
The growth in the digital infrastructure and adoption of advanced technologies drive the region's growth. The development of India's indigenous Navigation technology is a prime example of the strides the region is making in location-based services. The vast consumer market using location-based services given the increasing ownership of smartphones and expanding internet penetration given the telecom boom and favourable government regulation towards improving the digital economy. The increasing innovation driven by both public and private players, rising collaboration between stakeholders, and growing adoption and acceptance of technology-driven solutions will augment the regional market's growth.
Asia Pacific Region Location-Based Services Market Share in 2022 - 37%
www.thebrainyinsights.com
Check the geographical analysis of this market by requesting a free sample
The technology segment is divided into GPS, enhanced GPS, observed time difference, Wi-Fi, assisted GPS, enhanced observed time difference, cell ID and others. The GPS segment dominated the market, with a market share of around 35% in 2022. GPS stands for Global Positioning System. It is a satellite-based radio navigation system. Trilateration is a method used by GPS to operate. GPS was initially deployed to manage resources, safeguard ground troops, and map the whereabouts of vehicles and other assets on numerous battlefields in real-time by the United States. GPS makes navigation incredibly simple. GPS operates in all types of weather. It has a wide range of applications, demonstrating its dominance in the global market. It is used for navigation, Monitoring, mapping, etc.
The application segment is divided into social networking and entertainment, asset tracking, mapping and navigation, fleet management, local search and information, proximity marketing, business intelligence and analytics, location-based advertising, and others. The mapping and navigation segment dominated the market, with a market share of around 36% in 2022. Google Maps is the prime example of mapping and navigation, and its highly prevalent use explains its dominance in the market. Mapping helps in planning and Monitoring and enables control and regulations. Mapping and navigation find applications in various sectors, from agriculture to entertainment. In its simplest form, it helps individuals navigate cities or areas, find places, assist in movement or reach a destination. It aids in the tracking of packages, stolen goods, missing people, properties, etc. It helps to enhance vehicular traffic flow and other public utilities by improving city development plans.
The industry vertical segment is divided into transportation and logistics, government and public utilities, healthcare and life sciences, IT and telecom, hospitality, manufacturing, retail, media and entertainment, BFSI and others. The transportation and logistics segment dominated the market, with a market share of around 32% in 2022. Location-based services have a wide variety of applications in transportation and logistics. For instance, they are used to manage traffic flow or navigate through it for better road management. They are used for mapping routes for better mobility solutions. It can also be used for travel behaviour analytics, which helps public administration to design effective public transportation systems and reduce congestion. It also allows real-time vehicle tracking and fleet management systems to improve product delivery and customer satisfaction. Location-based services enhance Safety as well.
| Attribute | Description |
|---|---|
| Market Size | Revenue (USD Billion) |
| Market size value in 2022 | USD 40 Billion |
| Market size value in 2032 | USD 292.18 Billion |
| CAGR (2023 to 2032) | 22% |
| Historical data | 2019-2021 |
| Base Year | 2022 |
| Forecast | 2023-2032 |
| Region | The regions analyzed for the market are Asia Pacific, Europe, South America, North America, the Middle East and Africa. Furthermore, the regions are further analyzed at the country level. |
| Segments | Technology, Application, and Industry Vertical |
As per The Brainy Insights, the size of the global location-based services market was valued at USD 40 billion in 2022 to USD 292.18 billion by 2032.
Global location-based services market is growing at a CAGR of 22% during the forecast period 2023-2032.
The market's growth will be influenced by the increasing ownership of smart connected devices.
The high costs of infrastructure and installation could hamper the market growth.
1. Introduction
1.1. Objectives of the Study
1.2. Market Definition
1.3. Research Scope
1.4. Currency
1.5. Key Target Audience
2. Research Methodology and Assumptions
3. Executive Summary
4. Premium Insights
4.1. Porter’s Five Forces Analysis
4.2. Value Chain Analysis
4.3. Top Investment Pockets
4.3.1. Market Attractiveness Analysis by Technology
4.3.2. Market Attractiveness Analysis by Application
4.3.3. Market Attractiveness Analysis by Industry Vertical
4.3.4. Market Attractiveness Analysis by Region
4.4. Industry Trends
5. Market Dynamics
5.1. Market Evaluation
5.2. Drivers
5.2.1. The increasing ownership of smart connected devices
5.3. Restraints
5.3.1. The high costs of infrastructure and installation
5.4. Opportunities
5.4.1. The introduction of new technologies
5.5. Challenges
5.5.1. Data safety and security risks
6. Global Location-Based Services Market Analysis and Forecast, By Technology
6.1. Segment Overview
6.2. GPS
6.3. Enhanced GPS
6.4. Observed Time Difference
6.5. Wi-Fi
6.6. Assisted GPS
6.7. Enhanced Observed Time Difference
6.8. Cell ID
6.9. Others
7. Global Location-Based Services Market Analysis and Forecast, By Application
7.1. Segment Overview
7.2. Social Networking and Entertainment
7.3. Asset Tracking
7.4. Mapping and Navigation
7.5. Fleet Management
7.6. Local Search and Information
7.7. Proximity Marketing
7.8. Business Intelligence and Analytics
7.9. Location-Based Advertising
7.10. Others
8. Global Location-Based Services Market Analysis and Forecast, By Industry Vertical
8.1. Segment Overview
8.2. Transportation and Logistics
8.3. Government and Public Utilities
8.4. Healthcare and Life Sciences
8.5. IT and Telecom
8.6. Hospitality
8.7. Manufacturing
8.8. Retail
8.9. Media and Entertainment
8.10. BFSI
8.11. Others
9. Global Location-Based Services Market Analysis and Forecast, By Regional Analysis
9.1. Segment Overview
9.2. North America
9.2.1. U.S.
9.2.2. Canada
9.2.3. Mexico
9.3. Europe
9.3.1. Germany
9.3.2. France
9.3.3. U.K.
9.3.4. Italy
9.3.5. Spain
9.4. Asia-Pacific
9.4.1. Japan
9.4.2. China
9.4.3. India
9.5. South America
9.5.1. Brazil
9.6. Middle East and Africa
9.6.1. UAE
9.6.2. South Africa
10. Global Location-Based Services Market-Competitive Landscape
10.1. Overview
10.2. Market Share of Key Players in the Location-Based Services Market
10.2.1. Global Company Market Share
10.2.2. North America Company Market Share
10.2.3. Europe Company Market Share
10.2.4. APAC Company Market Share
10.3. Competitive Situations and Trends
10.3.1. Product Launches and Developments
10.3.2. Partnerships, Collaborations, and Agreements
10.3.3. Mergers & Acquisitions
10.3.4. Expansions
11. Company Profiles
11.1. ALE International
11.1.1. Business Overview
11.1.2. Company Snapshot
11.1.3. Company Market Share Analysis
11.1.4. Company Product Portfolio
11.1.5. Recent Developments
11.1.6. SWOT Analysis
11.2. Apple, Inc.
11.2.1. Business Overview
11.2.2. Company Snapshot
11.2.3. Company Market Share Analysis
11.2.4. Company Product Portfolio
11.2.5. Recent Developments
11.2.6. SWOT Analysis
11.3. AT&T Inc.
11.3.1. Business Overview
11.3.2. Company Snapshot
11.3.3. Company Market Share Analysis
11.3.4. Company Product Portfolio
11.3.5. Recent Developments
11.3.6. SWOT Analysis
11.4. Cisco Systems, Inc.
11.4.1. Business Overview
11.4.2. Company Snapshot
11.4.3. Company Market Share Analysis
11.4.4. Company Product Portfolio
11.4.5. Recent Developments
11.4.6. SWOT Analysis
11.5. Google LLC
11.5.1. Business Overview
11.5.2. Company Snapshot
11.5.3. Company Market Share Analysis
11.5.4. Company Product Portfolio
11.5.5. Recent Developments
11.5.6. SWOT Analysis
11.6. HERE Technologies
11.6.1. Business Overview
11.6.2. Company Snapshot
11.6.3. Company Market Share Analysis
11.6.4. Company Product Portfolio
11.6.5. Recent Developments
11.6.6. SWOT Analysis
11.7. IBM Corporation
11.7.1. Business Overview
11.7.2. Company Snapshot
11.7.3. Company Market Share Analysis
11.7.4. Company Product Portfolio
11.7.5. Recent Developments
11.7.6. SWOT Analysis
11.8. Microsoft Corporation
11.8.1. Business Overview
11.8.2. Company Snapshot
11.8.3. Company Market Share Analysis
11.8.4. Company Product Portfolio
11.8.5. Recent Developments
11.8.6. SWOT Analysis
11.9. Oracle Corporation
11.9.1. Business Overview
11.9.2. Company Snapshot
11.9.3. Company Market Share Analysis
11.9.4. Company Product Portfolio
11.9.5. Recent Developments
11.9.6. SWOT Analysis
11.10. Qualcomm Technologies Inc.
11.10.1. Business Overview
11.10.2. Company Snapshot
11.10.3. Company Market Share Analysis
11.10.4. Company Product Portfolio
11.10.5. Recent Developments
11.10.6. SWOT Analysis
List of Table
1. Global Location-Based Services Market, By Technology, 2019-2032 (USD Billion)
2. Global GPS Location-Based Services Market, By Region, 2019-2032 (USD Billion)
3. Global Enhanced GPS Location-Based Services Market, By Region, 2019-2032 (USD Billion)
4. Global Observed Time Difference Location-Based Services Market, By Region, 2019-2032 (USD Billion)
5. Global Wi-Fi Location-Based Services Market, By Region, 2019-2032 (USD Billion)
6. Global Assisted GPS Location-Based Services Market, By Region, 2019-2032 (USD Billion)
7. Global Enhanced Observed Time Difference Location-Based Services Market, By Region, 2019-2032 (USD Billion)
8. Global Cell ID Location-Based Services Market, By Region, 2019-2032 (USD Billion)
9. Global Others Location-Based Services Market, By Region, 2019-2032 (USD Billion)
10. Global Location-Based Services Market, By Application, 2019-2032 (USD Billion)
11. Global Social Networking and Entertainment Location-Based Services Market, By Region, 2019-2032 (USD Billion)
12. Global Asset Tracking Location-Based Services Market, By Region, 2019-2032 (USD Billion)
13. Global Mapping and Navigation Location-Based Services Market, By Region, 2019-2032 (USD Billion)
14. Global Fleet Management Location-Based Services Market, By Region, 2019-2032 (USD Billion)
15. Global Local Search and Information Location-Based Services Market, By Region, 2019-2032 (USD Billion)
16. Global Proximity Marketing Location-Based Services Market, By Region, 2019-2032 (USD Billion)
17. Global Business Intelligence and Analytics Location-Based Services Market, By Region, 2019-2032 (USD Billion)
18. Global Location-Based Advertising Location-Based Services Market, By Region, 2019-2032 (USD Billion)
19. Global Others Location-Based Services Market, By Region, 2019-2032 (USD Billion)
20. Global Location-Based Services Market, By Industry Vertical, 2019-2032 (USD Billion)
21. Global Transportation and Logistics Location-Based Services Market, By Region, 2019-2032 (USD Billion)
22. Global Government and Public Utilities Location-Based Services Market, By Region, 2019-2032 (USD Billion)
23. Global Healthcare and Life Sciences Location-Based Services Market, By Region, 2019-2032 (USD Billion)
24. Global IT and Telecom Location-Based Services Market, By Region, 2019-2032 (USD Billion)
25. Global Hospitality Location-Based Services Market, By Region, 2019-2032 (USD Billion)
26. Global Manufacturing Location-Based Services Market, By Region, 2019-2032 (USD Billion)
27. Global Retail Location-Based Services Market, By Region, 2019-2032 (USD Billion)
28. Global Media and Entertainment Location-Based Services Market, By Region, 2019-2032 (USD Billion)
29. Global BFSI Location-Based Services Market, By Region, 2019-2032 (USD Billion)
30. Global Others Location-Based Services Market, By Region, 2019-2032 (USD Billion)
31. Global Location-Based Services Market, By Region, 2019-2032 (USD Billion)
32. North America Location-Based Services Market, By Technology, 2019-2032 (USD Billion)
33. North America Location-Based Services Market, By Application, 2019-2032 (USD Billion)
34. North America Location-Based Services Market, By Industry Vertical, 2019-2032 (USD Billion)
35. U.S. Location-Based Services Market, By Technology, 2019-2032 (USD Billion)
36. U.S. Location-Based Services Market, By Application, 2019-2032 (USD Billion)
37. U.S. Location-Based Services Market, By Industry Vertical, 2019-2032 (USD Billion)
38. Canada Location-Based Services Market, By Technology, 2019-2032 (USD Billion)
39. Canada Location-Based Services Market, By Application, 2019-2032 (USD Billion)
40. Canada Location-Based Services Market, By Industry Vertical, 2019-2032 (USD Billion)
41. Mexico Location-Based Services Market, By Technology, 2019-2032 (USD Billion)
42. Mexico Location-Based Services Market, By Application, 2019-2032 (USD Billion)
43. Mexico Location-Based Services Market, By Industry Vertical, 2019-2032 (USD Billion)
44. Europe Location-Based Services Market, By Technology, 2019-2032 (USD Billion)
45. Europe Location-Based Services Market, By Application, 2019-2032 (USD Billion)
46. Europe Location-Based Services Market, By Industry Vertical, 2019-2032 (USD Billion)
47. Germany Location-Based Services Market, By Technology, 2019-2032 (USD Billion)
48. Germany Location-Based Services Market, By Application, 2019-2032 (USD Billion)
49. Germany Location-Based Services Market, By Industry Vertical, 2019-2032 (USD Billion)
50. France Location-Based Services Market, By Technology, 2019-2032 (USD Billion)
51. France Location-Based Services Market, By Application, 2019-2032 (USD Billion)
52. France Location-Based Services Market, By Industry Vertical, 2019-2032 (USD Billion)
53. U.K. Location-Based Services Market, By Technology, 2019-2032 (USD Billion)
54. U.K. Location-Based Services Market, By Application, 2019-2032 (USD Billion)
55. U.K. Location-Based Services Market, By Industry Vertical, 2019-2032 (USD Billion)
56. Italy Location-Based Services Market, By Technology, 2019-2032 (USD Billion)
57. Italy Location-Based Services Market, By Application, 2019-2032 (USD Billion)
58. Italy Location-Based Services Market, By Industry Vertical, 2019-2032 (USD Billion)
59. Spain Location-Based Services Market, By Technology, 2019-2032 (USD Billion)
60. Spain Location-Based Services Market, By Application, 2019-2032 (USD Billion)
61. Spain Location-Based Services Market, By Industry Vertical, 2019-2032 (USD Billion)
62. Asia Pacific Location-Based Services Market, By Technology, 2019-2032 (USD Billion)
63. Asia Pacific Location-Based Services Market, By Application, 2019-2032 (USD Billion)
64. Asia Pacific Location-Based Services Market, By Industry Vertical, 2019-2032 (USD Billion)
65. Japan Location-Based Services Market, By Technology, 2019-2032 (USD Billion)
66. Japan Location-Based Services Market, By Application, 2019-2032 (USD Billion)
67. Japan Location-Based Services Market, By Industry Vertical, 2019-2032 (USD Billion)
68. China Location-Based Services Market, By Technology, 2019-2032 (USD Billion)
69. China Location-Based Services Market, By Application, 2019-2032 (USD Billion)
70. China Location-Based Services Market, By Industry Vertical, 2019-2032 (USD Billion)
71. India Location-Based Services Market, By Technology, 2019-2032 (USD Billion)
72. India Location-Based Services Market, By Application, 2019-2032 (USD Billion)
73. India Location-Based Services Market, By Industry Vertical, 2019-2032 (USD Billion)
74. South America Location-Based Services Market, By Technology, 2019-2032 (USD Billion)
75. South America Location-Based Services Market, By Application, 2019-2032 (USD Billion)
76. South America Location-Based Services Market, By Industry Vertical, 2019-2032 (USD Billion)
77. Brazil Location-Based Services Market, By Technology, 2019-2032 (USD Billion)
78. Brazil Location-Based Services Market, By Application, 2019-2032 (USD Billion)
79. Brazil Location-Based Services Market, By Industry Vertical, 2019-2032 (USD Billion)
80. Middle East and Africa Location-Based Services Market, By Technology, 2019-2032 (USD Billion)
81. Middle East and Africa Location-Based Services Market, By Application, 2019-2032 (USD Billion)
82. Middle East and Africa Location-Based Services Market, By Industry Vertical, 2019-2032 (USD Billion)
83. UAE Location-Based Services Market, By Technology, 2019-2032 (USD Billion)
84. UAE Location-Based Services Market, By Application, 2019-2032 (USD Billion)
85. UAE Location-Based Services Market, By Industry Vertical, 2019-2032 (USD Billion)
86. South Africa Location-Based Services Market, By Technology, 2019-2032 (USD Billion)
87. South Africa Location-Based Services Market, By Application, 2019-2032 (USD Billion)
88. South Africa Location-Based Services Market, By Industry Vertical, 2019-2032 (USD Billion)
List of Figures
1. Global Location-Based Services Market Segmentation
2. Location-Based Services Market: Research Methodology
3. Market Size Estimation Methodology: Bottom-Up Approach
4. Market Size Estimation Methodology: Top-Down Approach
5. Data Triangulation
6. Porter’s Five Forces Analysis
7. Value Chain Analysis
8. Global Location-Based Services Market Attractiveness Analysis by Technology
9. Global Location-Based Services Market Attractiveness Analysis by Application
10. Global Location-Based Services Market Attractiveness Analysis by Industry Vertical
11. Global Location-Based Services Market Attractiveness Analysis by Region
12. Global Location-Based Services Market: Dynamics
13. Global Location-Based Services Market Share by Technology (2022 & 2032)
14. Global Location-Based Services Market Share by Application (2022 & 2032)
15. Global Location-Based Services Market Share by Industry Vertical (2022 & 2032)
16. Global Location-Based Services Market Share by Regions (2022 & 2032)
17. Global Location-Based Services Market Share by Company (2022)
This study forecasts revenue at global, regional, and country levels from 2019 to 2032. The Brainy Insights has segmented the global location-based services market based on below mentioned segments:
Global Location-Based Services Market by Technology:
Global Location-Based Services Market by Application:
Global Location-Based Services Market by Industry Vertical:
Global Location-Based Services Market by Region:
Research has its special purpose to undertake marketing efficiently. In this competitive scenario, businesses need information across all industry verticals; the information about customer wants, market demand, competition, industry trends, distribution channels etc. This information needs to be updated regularly because businesses operate in a dynamic environment. Our organization, The Brainy Insights incorporates scientific and systematic research procedures in order to get proper market insights and industry analysis for overall business success. The analysis consists of studying the market from a miniscule level wherein we implement statistical tools which helps us in examining the data with accuracy and precision.
Our research reports feature both; quantitative and qualitative aspects for any market. Qualitative information for any market research process are fundamental because they reveal the customer needs and wants, usage and consumption for any product/service related to a specific industry. This in turn aids the marketers/investors in knowing certain perceptions of the customers. Qualitative research can enlighten about the different product concepts and designs along with unique service offering that in turn, helps define marketing problems and generate opportunities. On the other hand, quantitative research engages with the data collection process through interviews, e-mail interactions, surveys and pilot studies. Quantitative aspects for the market research are useful to validate the hypotheses generated during qualitative research method, explore empirical patterns in the data with the help of statistical tools, and finally make the market estimations.
The Brainy Insights offers comprehensive research and analysis, based on a wide assortment of factual insights gained through interviews with CXOs and global experts and secondary data from reliable sources. Our analysts and industry specialist assume vital roles in building up statistical tools and analysis models, which are used to analyse the data and arrive at accurate insights with exceedingly informative research discoveries. The data provided by our organization have proven precious to a diverse range of companies, facilitating them to address issues such as determining which products/services are the most appealing, whether or not customers use the product in the manner anticipated, the purchasing intentions of the market and many others.
Our research methodology encompasses an idyllic combination of primary and secondary initiatives. Key phases involved in this process are listed below:

The phase involves the gathering and collecting of market data and its related information with the help of different sources & research procedures.

The data procurement stage involves in data gathering and collecting through various data sources.
This stage involves in extensive research. These data sources includes:
Purchased Database: Purchased databases play a crucial role in estimating the market sizes irrespective of the domain. Our purchased database includes:
Primary Research: The Brainy Insights interacts with leading companies and experts of the concerned domain to develop the analyst team’s market understanding and expertise. It improves and substantiates every single data presented in the market reports. Primary research mainly involves in telephonic interviews, E-mail interactions and face-to-face interviews with the raw material providers, manufacturers/producers, distributors, & independent consultants. The interviews that we conduct provides valuable data on market size and industry growth trends prevailing in the market. Our organization also conducts surveys with the various industry experts in order to gain overall insights of the industry/market. For instance, in healthcare industry we conduct surveys with the pharmacists, doctors, surgeons and nurses in order to gain insights and key information of a medical product/device/equipment which the customers are going to usage. Surveys are conducted in the form of questionnaire designed by our own analyst team. Surveys plays an important role in primary research because surveys helps us to identify the key target audiences of the market. Additionally, surveys helps to identify the key target audience engaged with the market. Our survey team conducts the survey by targeting the key audience, thus gaining insights from them. Based on the perspectives of the customers, this information is utilized to formulate market strategies. Moreover, market surveys helps us to understand the current competitive situation of the industry. To be precise, our survey process typically involve with the 360 analysis of the market. This analytical process begins by identifying the prospective customers for a product or service related to the market/industry to obtain data on how a product/service could fit into customers’ lives.

Secondary Research: The secondary data sources includes information published by the on-profit organizations such as World bank, WHO, company fillings, investor presentations, annual reports, national government documents, statistical databases, blogs, articles, white papers and others. From the annual report, we analyse a company’s revenue to understand the key segment and market share of that organization in a particular region. We analyse the company websites and adopt the product mapping technique which is important for deriving the segment revenue. In the product mapping method, we select and categorize the products offered by the companies catering to domain specific market, deduce the product revenue for each of the companies so as to get overall estimation of the market size. We also source data and analyses trends based on information received from supply side and demand side intermediaries in the value chain. The supply side denotes the data gathered from supplier, distributor, wholesaler and the demand side illustrates the data gathered from the end customers for respective market domain.

The supply side for a domain specific market is analysed by:
The demand side for the market is estimated through:
In-house Library: Apart from these third-party sources, we have our in-house library of qualitative and quantitative information. Our in-house database includes market data for various industry and domains. These data are updated on regular basis as per the changing market scenario. Our library includes, historic databases, internal audit reports and archives.
Sometimes there are instances where there is no metadata or raw data available for any domain specific market. For those cases, we use our expertise to forecast and estimate the market size in order to generate comprehensive data sets. Our analyst team adopt a robust research technique in order to produce the estimates:
Data Synthesis: This stage involves the analysis & mapping of all the information obtained from the previous step. It also involves in scrutinizing the data for any discrepancy observed while data gathering related to the market. The data is collected with consideration to the heterogeneity of sources. Robust scientific techniques are in place for synthesizing disparate data sets and provide the essential contextual information that can orient market strategies. The Brainy Insights has extensive experience in data synthesis where the data passes through various stages:


Market Deduction & Formulation: The final stage comprises of assigning data points at appropriate market spaces so as to deduce feasible conclusions. Analyst perspective & subject matter expert based holistic form of market sizing coupled with industry analysis also plays a crucial role in this stage.
This stage involves in finalization of the market size and numbers that we have collected from data integration step. With data interpolation, it is made sure that there is no gap in the market data. Successful trend analysis is done by our analysts using extrapolation techniques, which provide the best possible forecasts for the market.
Data Validation & Market Feedback: Validation is the most important step in the process. Validation & re-validation via an intricately designed process helps us finalize data-points to be used for final calculations.

The Brainy Insights interacts with leading companies and experts of the concerned domain to develop the analyst team’s market understanding and expertise. It improves and substantiates every single data presented in the market reports. The data validation interview and discussion panels are typically composed of the most experienced industry members. The participants include, however, are not limited to:
Moreover, we always validate our data and findings through primary respondents from all the major regions we are working on.


Free Customization
Fortune 500 Clients
Free Yearly Update On Purchase Of Multi/Corporate License
Companies Served Till Date