- +1-315-215-1633
- sales@thebrainyinsights.com

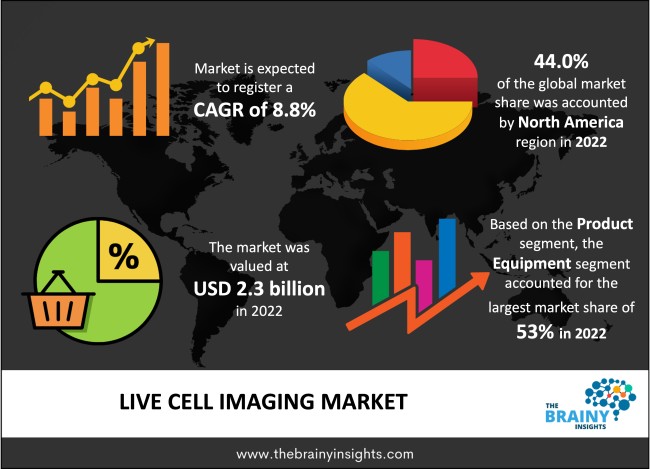
The global live cell imaging market was valued at USD 2.3 billion in 2022, growing at a CAGR of 8.8% from 2023 to 2032. While they are alive in their growing media, the process of imaging cells is known as live cell imaging. Live cells are active cells that alter and move over time. Cells and smaller structures within cells are fluid and transparent; hence, some dye or stain is required to visualize these structures. However, fluorescence microscopy is the best option for cell imaging if dyes do not stain the living cells. Green fluorescence protein is a well-known protein. Advanced technologies such as HCS (High Content Screening), FRET (Fluorescence Resonance Energy Transfer), and other technologies are used in live cell imaging. In laboratories, live cell imaging has become essential for analyzing and researching biomedical studies such as pharmacology, cell biology, developmental biology, neurobiology, and other applications.
Live cell imaging is a revolutionary approach that has emerged as a valuable tool in the biological field. It enables scientists to observe and study living cells in real-time, allowing them to gain an interactive and dynamic understanding of biological processes. Compared to traditional imaging techniques that entail labelling and fixing cells, live cell imaging allows researchers to observe cellular behaviour as it occurs spontaneously within the living cell. This method has transformed the overall understanding of cellular dynamics, providing essential insights into fundamental biological processes and setting the benchmark for significant discoveries in various scientific fields within the healthcare industry. Live cell imaging originated at the beginning of the 20th century when progressions in cell culture techniques and microscopy enabled researchers to examine living cells under the microscope. Due to a lack of fluorescent labelling methods and specialized equipment, initial findings were confined to basic cellular structures and motions. The live cell imaging process began to flourish with the introduction of genetically encoded fluorescent proteins and fluorescent dyes in the late 20th century. This technique enabled scientists to follow proteins, organelles, and other substances within living cells by targeting specific cellular components. As technology advanced, many imaging modalities and sophisticated instrumentation became available, giving researchers unequalled access to detailed studies of cellular processes.
Get an overview of this study by requesting a free sample
Rising Demand for Personalized Medicine- The growing emphasis on personalized medicine has emerged as the primary driving factor for the global live cell imaging market. Personalized medicine provides customized healthcare solutions based on a person's genetic makeup, lifestyle, and illness features. Live cell imaging is critical in this method because it allows for the real-time assessment of cellular responses to specific treatments and medications. Researchers can uncover personalized therapy tactics that are most successful and least hazardous to a particular patient by watching how living cells react to different medications. Furthermore, live cell imaging enables the screening and development of targeted medicines and precision medicine, improving patient outcomes and reducing the burden of side effects. As the demand for personalized medicine grows, the live cell imaging technologies market also grows substantially.
High Costs of Equipment and Reagents- The high equipment prices and the high costs associated with the reagents are significant restraining factors in the global live cell imaging market. Live cell imaging necessitates complex and specialized imaging technologies, such as fluorescence microscopes, confocal microscopes, and high-resolution cameras, which can be costly to acquire and maintain. Furthermore, the genetically encoded probes, fluorescent dyes, and other reagents required in live cell imaging are expensive, making it a capital-intensive industry for research centres and academic institutions. These high prices may discourage smaller research facilities and universities with limited funds from adopting live cell imaging methods, limiting universal access and the use of this crucial technology. Thus, this factor is hindering market growth and development.
Technological Advancements- In the present scenario, technology has become essential for organizations engaged in the medical and healthcare industry and is continuously gaining momentum. The ongoing technological developments and advancements within the field of imaging technology are anticipated to provide lucrative growth opportunities in the upcoming years. In the past few decades, substantial advancements in detector sensitivity, microscope design, and the introduction of imaging software have resulted in better image quality with spatial and temporal resolution. Researchers have captured dynamic biological processes with exceptional precision and clarity owing to the development of advanced imaging techniques such as total internal reflection fluorescence (TIRF) microscopy, light sheet microscopy, and confocal microscopy. These advancements have widened the spectrum of live cell imaging applications and boosted the real-time analysis/study of protein-protein interactions, organelle dynamics, and subcellular structures. As technology advances, advanced imaging modalities are expected to emerge, propelling the live cell imaging market growth and development.
The regions analyzed for the market include Europe, North America, South America, Asia Pacific, and Middle East & Africa. North America emerged as the most significant global live cell imaging market, with a 44.0% market revenue share in 2022. Rising investments in ongoing research and development activities fuel regional growth and development. Within the North American region, the U.S. held a prominent share owing to the growing number of research and development activities. Additionally, the regional market players engage in various market strategies such as mergers, acquisitions, partnerships, and strategic alliances to maintain their competitive edge.
North America Region Live Cell Imaging Market Share in 2022 - 44.0%
www.thebrainyinsights.com
Check the geographical analysis of this market by requesting a free sample
The product segment is divided into equipment, software and consumables. The equipment segment dominated, with a market share of around 53% in 2022. The equipment product category includes various imaging platforms and systems that let scientists monitor living cells at different temporal and geographical resolutions. Fluorescence microscopes, confocal microscopes, spinning disc confocal microscopes, and total internal reflection fluorescence (TIRF) microscopes are some of this category's most common pieces of equipment. These imaging systems use sophisticated optics, high-resolution cameras, and specialized light sources to record dynamic cellular activities sensitively and precisely. The equipment product category serves the needs of clinical laboratories, pharmaceutical corporations, biotechnology companies, and academic research centres.
The application segment is divided into cell biology, developmental biology, stem cell, and drug discovery. The cell biology segment dominated the market, with a market share of around 38% in 2022. Cell biology is a leading application for the global live cell imaging market. The application includes cell behaviour, function, and structure analysis and presents a fundamental understanding of the molecular principles underpinning many biological activities. With the assistance of live cell imaging, scientists and researchers analyze and observe the dynamic processes occurring inside living cells, such as cell division, organelle movements, cell signalling, and cellular reactions to external stimuli. Academic research organizations, biotechnology firms, and pharmaceutical laboratories utilize cell biology extensively in the field of biology. This is expected to impact the development of the global market positively.
The technology segment is divided into fluorescence resonance energy transfer (FRET), fluorescence recovery after photobleaching (FRAP), high content screening (HCS) and others. The into fluorescence resonance energy transfer (FRET) segment dominated the market, with a share of around 56% in 2022. Using the potent and popular Fluorescence Resonance Energy Transfer (FRET) technology, researchers can examine molecular interactions and conformational changes within living cells. FRET is based on the energy exchange between two closely separated fluorophores, frequently fluorescent proteins or dyes deliberately positioned on particular target biological molecules. FRET is widely used in cell biology to study protein-protein interactions, structural changes, and signal transduction processes. It can be used to comprehend receptor-ligand interactions, intracellular signalling cascades, and protein clustering inside biological compartments. FRET is beneficial for real-time research into dynamic processes such as membrane fusion, enzymes, and other activities. These factors are boosting the segment's growth and development.
| Attribute | Description |
|---|---|
| Market Size | Revenue (USD Billion) |
| Market size value in 2022 | USD 2.3 Billion |
| Market size value in 2032 | USD 4.91 Billion |
| CAGR (2023 to 2032) | 8.8% |
| Historical data | 2019-2021 |
| Base Year | 2022 |
| Forecast | 2023-2032 |
| Region | The regions analyzed for the market are Asia Pacific, Europe, South America, North America, and Middle East & Africa. Furthermore, the regions are further analyzed at the country level. |
| Segments | Product, Application, Technology |
As per The Brainy Insights, the market size of the global live cell imaging market was valued at USD 2.3 billion in 2022 to USD 4.91 billion by 2032.
Global live cell imaging market is growing at a CAGR of 8.8% during the forecast period 2023-2032.
The market's growth will be influenced by the rising demand for personalized medicines.
The lack of skilled workforce hamper the market growth.
1. Introduction
1.1. Objectives of the Study
1.2. Market Definition
1.3. Research Scope
1.4. Currency
1.5. Key Target Audience
2. Research Methodology and Assumptions
3. Executive Summary
4. Premium Insights
4.1. Porter’s Five Forces Analysis
4.2. Value Chain Analysis
4.3. Top Investment Pockets
4.3.1. Market Attractiveness Analysis by Product
4.3.2. Market Attractiveness Analysis by Application
4.3.3. Market Attractiveness Analysis by Technology
4.3.4. Market Attractiveness Analysis by Region
4.4. Industry Trends
5. Market Dynamics
5.1. Market Evaluation
5.2. Drivers
5.2.1. Rising Demand for Personalized Medicine
5.3. Restraints
5.3.1. Lack of Skilled Workforce
5.4. Opportunities
5.4.1. Technological Advancements
6. Global Live Cell Imaging Market Analysis and Forecast, By Product
6.1. Segment Overview
6.2. Equipment
6.3. Consumables
6.4. Software
7. Global Live Cell Imaging Market Analysis and Forecast, By Application
7.1. Segment Overview
7.2. Cell Biology
7.3. Developmental Biology
7.4. Stem Cell
7.5. Drug Discovery
8. Global Live Cell Imaging Market Analysis and Forecast, By Technology
8.1. Segment Overview
8.2. Fluorescence Resonance Energy Transfer (FRET)
8.3. Fluorescence Recovery After Photobleaching (FRAP)
8.4. High Content Screening (HCS)
8.5. Others
9. Global Live Cell Imaging Market Analysis and Forecast, By Regional Analysis
9.1. Segment Overview
9.2. North America
9.2.1. U.S.
9.2.2. Canada
9.2.3. Mexico
9.3. Europe
9.3.1. Germany
9.3.2. France
9.3.3. U.K.
9.3.4. Italy
9.3.5. Spain
9.4. Asia-Pacific
9.4.1. Japan
9.4.2. China
9.4.3. India
9.4.4. South Korea
9.4.5. Australia
9.5. South America
9.5.1. Brazil
9.5.2. Argentina
9.6. Middle East and Africa
9.6.1. UAE
9.6.2. South Africa
9.6.3. Saudi Arabia
10. Global Live Cell Imaging Market-Competitive Landscape
10.1. Overview
10.2. Market Share of Key Players in the Live Cell Imaging Market
10.2.1. Global Company Market Share
10.2.2. North America Company Market Share
10.2.3. Europe Company Market Share
10.2.4. APAC Company Market Share
10.3. Competitive Situations and Trends
10.3.1. Product Launches and Developments
10.3.2. Partnerships, Collaborations, and Agreements
10.3.3. Mergers & Acquisitions
10.3.4. Expansions
11. Company Profiles
11.1. Nikon Corporation
11.1.1. Business Overview
11.1.2. Company Snapshot
11.1.3. Company Market Share Analysis
11.1.4. Company Product Portfolio
11.1.5. Recent Developments
11.1.6. SWOT Analysis
11.2. Carl Zeiss AG
11.2.1. Business Overview
11.2.2. Company Snapshot
11.2.3. Company Market Share Analysis
11.2.4. Company Product Portfolio
11.2.5. Recent Developments
11.2.6. SWOT Analysis
11.3. GE Healthcare
11.3.1. Business Overview
11.3.2. Company Snapshot
11.3.3. Company Market Share Analysis
11.3.4. Company Product Portfolio
11.3.5. Recent Developments
11.3.6. SWOT Analysis
11.4. PerkinElmer Inc.
11.4.1. Business Overview
11.4.2. Company Snapshot
11.4.3. Company Market Share Analysis
11.4.4. Company Product Portfolio
11.4.5. Recent Developments
11.4.6. SWOT Analysis
11.5. Leica Microsystems GmbH
11.5.1. Business Overview
11.5.2. Company Snapshot
11.5.3. Company Market Share Analysis
11.5.4. Company Product Portfolio
11.5.5. Recent Developments
11.5.6. SWOT Analysis
11.6. Olympus Corporation
11.6.1. Business Overview
11.6.2. Company Snapshot
11.6.3. Company Market Share Analysis
11.6.4. Company Product Portfolio
11.6.5. Recent Developments
11.6.6. SWOT Analysis
11.7. Biotech Instruments Inc.
11.7.1. Business Overview
11.7.2. Company Snapshot
11.7.3. Company Market Share Analysis
11.7.4. Company Product Portfolio
11.7.5. Recent Developments
11.7.6. SWOT Analysis
11.8. Thermo Fisher Scientific Inc.
11.8.1. Business Overview
11.8.2. Company Snapshot
11.8.3. Company Market Share Analysis
11.8.4. Company Product Portfolio
11.8.5. Recent Developments
11.8.6. SWOT Analysis
11.9. CYTENA GmbH
11.9.1. Business Overview
11.9.2. Company Snapshot
11.9.3. Company Market Share Analysis
11.9.4. Company Product Portfolio
11.9.5. Recent Developments
11.9.6. SWOT Analysis
11.10. Corning Incorporated
11.10.1. Business Overview
11.10.2. Company Snapshot
11.10.3. Company Market Share Analysis
11.10.4. Company Product Portfolio
11.10.5. Recent Developments
11.10.6. SWOT Analysis
11.11. Bruker Corporation
11.11.1. Business Overview
11.11.2. Company Snapshot
11.11.3. Company Market Share Analysis
11.11.4. Company Product Portfolio
11.11.5. Recent Developments
11.11.6. SWOT Analysis
List of Table
1. Global Live Cell Imaging Market, By Product, 2019-2032 (USD Billion)
2. Global Equipment Live Cell Imaging Market, By Region, 2019-2032 (USD Billion)
3. Global Consumables Live Cell Imaging Market, By Region, 2019-2032 (USD Billion)
4. Global Software Live Cell Imaging Market, By Region, 2019-2032 (USD Billion)
5. Global Live Cell Imaging Market, By Application, 2019-2032 (USD Billion)
6. Global Cell Biology Live Cell Imaging Market, By Region, 2019-2032 (USD Billion)
7. Global Developmental Biology Live Cell Imaging Market, By Region, 2019-2032 (USD Billion)
8. Global Stem Cell Live Cell Imaging Market, By Region, 2019-2032 (USD Billion)
9. Global Drug Discovery Live Cell Imaging Market, By Region, 2019-2032 (USD Billion)
10. Global Live Cell Imaging Market, By Technology, 2019-2032 (USD Billion)
11. Global Fluorescence Resonance Energy Transfer (FRET) Live Cell Imaging Market, By Region, 2019-2032 (USD Billion)
12. Global Fluorescence Recovery After Photobleaching (FRAP) Live Cell Imaging Market, By Region, 2019-2032 (USD Billion)
13. Global High Content Screening (HCS) Live Cell Imaging Market, By Region, 2019-2032 (USD Billion)
14. Global Others Live Cell Imaging Market, By Region, 2019-2032 (USD Billion)
15. Global Live Cell Imaging Market, By Region, 2019-2032 (USD Billion)
16. North America Live Cell Imaging Market, By Product, 2019-2032 (USD Billion)
17. North America Live Cell Imaging Market, By Application, 2019-2032 (USD Billion)
18. North America Live Cell Imaging Market, By Technology, 2019-2032 (USD Billion)
19. U.S. Live Cell Imaging Market, By Product, 2019-2032 (USD Billion)
20. U.S. Live Cell Imaging Market, By Application, 2019-2032 (USD Billion)
21. U.S. Live Cell Imaging Market, By Technology, 2019-2032 (USD Billion)
22. Canada Live Cell Imaging Market, By Product, 2019-2032 (USD Billion)
23. Canada Live Cell Imaging Market, By Application, 2019-2032 (USD Billion)
24. Canada Live Cell Imaging Market, By Technology, 2019-2032 (USD Billion)
25. Mexico Live Cell Imaging Market, By Product, 2019-2032 (USD Billion)
26. Mexico Live Cell Imaging Market, By Application, 2019-2032 (USD Billion)
27. Mexico Live Cell Imaging Market, By Technology, 2019-2032 (USD Billion)
28. Europe Live Cell Imaging Market, By Product, 2019-2032 (USD Billion)
29. Europe Live Cell Imaging Market, By Application, 2019-2032 (USD Billion)
30. Europe Live Cell Imaging Market, By Technology, 2019-2032 (USD Billion)
31. Germany Live Cell Imaging Market, By Product, 2019-2032 (USD Billion)
32. Germany Live Cell Imaging Market, By Application, 2019-2032 (USD Billion)
33. Germany Live Cell Imaging Market, By Technology, 2019-2032 (USD Billion)
34. France Live Cell Imaging Market, By Product, 2019-2032 (USD Billion)
35. France Live Cell Imaging Market, By Application, 2019-2032 (USD Billion)
36. France Live Cell Imaging Market, By Technology, 2019-2032 (USD Billion)
37. U.K. Live Cell Imaging Market, By Product, 2019-2032 (USD Billion)
38. U.K. Live Cell Imaging Market, By Application, 2019-2032 (USD Billion)
39. U.K. Live Cell Imaging Market, By Technology, 2019-2032 (USD Billion)
40. Italy Live Cell Imaging Market, By Product, 2019-2032 (USD Billion)
41. Italy Live Cell Imaging Market, By Application, 2019-2032 (USD Billion)
42. Italy Live Cell Imaging Market, By Technology, 2019-2032 (USD Billion)
43. Italy Live Cell Imaging Market, By Application, 2019-2032 (USD Billion)
44. Spain Live Cell Imaging Market, By Product, 2019-2032 (USD Billion)
45. Spain Live Cell Imaging Market, By Technology, 2019-2032 (USD Billion)
46. Spain Live Cell Imaging Market, By Application, 2019-2032 (USD Billion)
47. Asia Pacific Live Cell Imaging Market, By Product, 2019-2032 (USD Billion)
48. Asia Pacific Live Cell Imaging Market, By Application, 2019-2032 (USD Billion)
49. Asia Pacific Live Cell Imaging Market, By Technology, 2019-2032 (USD Billion)
50. Japan Live Cell Imaging Market, By Product, 2019-2032 (USD Billion)
51. Japan Live Cell Imaging Market, By Technology, 2019-2032 (USD Billion)
52. Japan Live Cell Imaging Market, By Application, 2019-2032 (USD Billion)
53. China Live Cell Imaging Market, By Product, 2019-2032 (USD Billion)
54. China Live Cell Imaging Market, By Technology, 2019-2032 (USD Billion)
55. China Live Cell Imaging Market, By Application, 2019-2032 (USD Billion)
56. India Live Cell Imaging Market, By Product, 2019-2032 (USD Billion)
57. India Live Cell Imaging Market, By Technology, 2019-2032 (USD Billion)
58. India Live Cell Imaging Market, By Application, 2019-2032 (USD Billion)
59. South Korea Live Cell Imaging Market, By Product, 2019-2032 (USD Billion)
60. South Korea Live Cell Imaging Market, By Application, 2019-2032 (USD Billion)
61. South Korea Live Cell Imaging Market, By Technology, 2019-2032 (USD Billion)
62. Australia Live Cell Imaging Market, By Product, 2019-2032 (USD Billion)
63. Australia Live Cell Imaging Market, By Technology, 2019-2032 (USD Billion)
64. Australia Live Cell Imaging Market, By Application, 2019-2032 (USD Billion)
65. South America Live Cell Imaging Market, By Product, 2019-2032 (USD Billion)
66. South America Live Cell Imaging Market, By Application, 2019-2032 (USD Billion)
67. South America Live Cell Imaging Market, By Technology, 2019-2032 (USD Billion)
68. Brazil Live Cell Imaging Market, By Product, 2019-2032 (USD Billion)
69. Brazil Live Cell Imaging Market, By Technology, 2019-2032 (USD Billion)
70. Brazil Live Cell Imaging Market, By Application, 2019-2032 (USD Billion)
71. Argentina Live Cell Imaging Market, By Product, 2019-2032 (USD Billion)
72. Argentina Live Cell Imaging Market, By Technology, 2019-2032 (USD Billion)
73. Argentina Live Cell Imaging Market, By Application, 2019-2032 (USD Billion)
74. Middle East and Africa Live Cell Imaging Market, By Product, 2019-2032 (USD Billion)
75. Middle East and Africa Live Cell Imaging Market, By Technology, 2019-2032 (USD Billion)
76. Middle East and Africa Live Cell Imaging Market, By Application, 2019-2032 (USD Billion)
77. UAE Live Cell Imaging Market, By Product, 2019-2032 (USD Billion)
78. UAE Live Cell Imaging Market, By Technology, 2019-2032 (USD Billion)
79. UAE Live Cell Imaging Market, By Application, 2019-2032 (USD Billion)
80. South Africa Live Cell Imaging Market, By Product, 2019-2032 (USD Billion)
81. South Africa Live Cell Imaging Market, By Technology, 2019-2032 (USD Billion)
82. South Africa Live Cell Imaging Market, By Application, 2019-2032 (USD Billion)
83. Saudi Arabia Live Cell Imaging Market, By Product, 2019-2032 (USD Billion)
84. Saudi Arabia Live Cell Imaging Market, By Technology, 2019-2032 (USD Billion)
85. Saudi Arabia Live Cell Imaging Market, By Application, 2019-2032 (USD Billion)
List of Figures
1. Global Live Cell Imaging Market Segmentation
2. Live Cell Imaging Market: Research Methodology
3. Market Size Estimation Methodology: Bottom-Up Approach
4. Market Size Estimation Methodology: Top-Down Approach
5. Data Triangulation
6. Porter’s Five Forces Analysis
7. Value Chain Analysis
8. Global Live Cell Imaging Market Attractiveness Analysis by Product
9. Global Live Cell Imaging Market Attractiveness Analysis by Application
10. Global Live Cell Imaging Market Attractiveness Analysis by Technology
11. Global Live Cell Imaging Market Attractiveness Analysis by Region
12. Global Live Cell Imaging Market: Dynamics
13. Global Live Cell Imaging Market Share By Product (2023 & 2032)
14. Global Live Cell Imaging Market Share by Application (2023 & 2032)
15. Global Live Cell Imaging Market Share by Technology (2023 & 2032)
16. Global Live Cell Imaging Market Share by Regions (2023 & 2032)
17. Global Live Cell Imaging Market Share by Company (2022)
This study forecasts revenue at global, regional, and country levels from 2019 to 2032. The Brainy Insights has segmented the global live cell imaging market based on below mentioned segments:
Global Live Cell Imaging Market by Product:
Global Live Cell Imaging Market by Application:
Global Live Cell Imaging Market by Technology:
Global Live Cell Imaging Market by Region:
Research has its special purpose to undertake marketing efficiently. In this competitive scenario, businesses need information across all industry verticals; the information about customer wants, market demand, competition, industry trends, distribution channels etc. This information needs to be updated regularly because businesses operate in a dynamic environment. Our organization, The Brainy Insights incorporates scientific and systematic research procedures in order to get proper market insights and industry analysis for overall business success. The analysis consists of studying the market from a miniscule level wherein we implement statistical tools which helps us in examining the data with accuracy and precision.
Our research reports feature both; quantitative and qualitative aspects for any market. Qualitative information for any market research process are fundamental because they reveal the customer needs and wants, usage and consumption for any product/service related to a specific industry. This in turn aids the marketers/investors in knowing certain perceptions of the customers. Qualitative research can enlighten about the different product concepts and designs along with unique service offering that in turn, helps define marketing problems and generate opportunities. On the other hand, quantitative research engages with the data collection process through interviews, e-mail interactions, surveys and pilot studies. Quantitative aspects for the market research are useful to validate the hypotheses generated during qualitative research method, explore empirical patterns in the data with the help of statistical tools, and finally make the market estimations.
The Brainy Insights offers comprehensive research and analysis, based on a wide assortment of factual insights gained through interviews with CXOs and global experts and secondary data from reliable sources. Our analysts and industry specialist assume vital roles in building up statistical tools and analysis models, which are used to analyse the data and arrive at accurate insights with exceedingly informative research discoveries. The data provided by our organization have proven precious to a diverse range of companies, facilitating them to address issues such as determining which products/services are the most appealing, whether or not customers use the product in the manner anticipated, the purchasing intentions of the market and many others.
Our research methodology encompasses an idyllic combination of primary and secondary initiatives. Key phases involved in this process are listed below:

The phase involves the gathering and collecting of market data and its related information with the help of different sources & research procedures.

The data procurement stage involves in data gathering and collecting through various data sources.
This stage involves in extensive research. These data sources includes:
Purchased Database: Purchased databases play a crucial role in estimating the market sizes irrespective of the domain. Our purchased database includes:
Primary Research: The Brainy Insights interacts with leading companies and experts of the concerned domain to develop the analyst team’s market understanding and expertise. It improves and substantiates every single data presented in the market reports. Primary research mainly involves in telephonic interviews, E-mail interactions and face-to-face interviews with the raw material providers, manufacturers/producers, distributors, & independent consultants. The interviews that we conduct provides valuable data on market size and industry growth trends prevailing in the market. Our organization also conducts surveys with the various industry experts in order to gain overall insights of the industry/market. For instance, in healthcare industry we conduct surveys with the pharmacists, doctors, surgeons and nurses in order to gain insights and key information of a medical product/device/equipment which the customers are going to usage. Surveys are conducted in the form of questionnaire designed by our own analyst team. Surveys plays an important role in primary research because surveys helps us to identify the key target audiences of the market. Additionally, surveys helps to identify the key target audience engaged with the market. Our survey team conducts the survey by targeting the key audience, thus gaining insights from them. Based on the perspectives of the customers, this information is utilized to formulate market strategies. Moreover, market surveys helps us to understand the current competitive situation of the industry. To be precise, our survey process typically involve with the 360 analysis of the market. This analytical process begins by identifying the prospective customers for a product or service related to the market/industry to obtain data on how a product/service could fit into customers’ lives.

Secondary Research: The secondary data sources includes information published by the on-profit organizations such as World bank, WHO, company fillings, investor presentations, annual reports, national government documents, statistical databases, blogs, articles, white papers and others. From the annual report, we analyse a company’s revenue to understand the key segment and market share of that organization in a particular region. We analyse the company websites and adopt the product mapping technique which is important for deriving the segment revenue. In the product mapping method, we select and categorize the products offered by the companies catering to domain specific market, deduce the product revenue for each of the companies so as to get overall estimation of the market size. We also source data and analyses trends based on information received from supply side and demand side intermediaries in the value chain. The supply side denotes the data gathered from supplier, distributor, wholesaler and the demand side illustrates the data gathered from the end customers for respective market domain.

The supply side for a domain specific market is analysed by:
The demand side for the market is estimated through:
In-house Library: Apart from these third-party sources, we have our in-house library of qualitative and quantitative information. Our in-house database includes market data for various industry and domains. These data are updated on regular basis as per the changing market scenario. Our library includes, historic databases, internal audit reports and archives.
Sometimes there are instances where there is no metadata or raw data available for any domain specific market. For those cases, we use our expertise to forecast and estimate the market size in order to generate comprehensive data sets. Our analyst team adopt a robust research technique in order to produce the estimates:
Data Synthesis: This stage involves the analysis & mapping of all the information obtained from the previous step. It also involves in scrutinizing the data for any discrepancy observed while data gathering related to the market. The data is collected with consideration to the heterogeneity of sources. Robust scientific techniques are in place for synthesizing disparate data sets and provide the essential contextual information that can orient market strategies. The Brainy Insights has extensive experience in data synthesis where the data passes through various stages:


Market Deduction & Formulation: The final stage comprises of assigning data points at appropriate market spaces so as to deduce feasible conclusions. Analyst perspective & subject matter expert based holistic form of market sizing coupled with industry analysis also plays a crucial role in this stage.
This stage involves in finalization of the market size and numbers that we have collected from data integration step. With data interpolation, it is made sure that there is no gap in the market data. Successful trend analysis is done by our analysts using extrapolation techniques, which provide the best possible forecasts for the market.
Data Validation & Market Feedback: Validation is the most important step in the process. Validation & re-validation via an intricately designed process helps us finalize data-points to be used for final calculations.

The Brainy Insights interacts with leading companies and experts of the concerned domain to develop the analyst team’s market understanding and expertise. It improves and substantiates every single data presented in the market reports. The data validation interview and discussion panels are typically composed of the most experienced industry members. The participants include, however, are not limited to:
Moreover, we always validate our data and findings through primary respondents from all the major regions we are working on.


Free Customization
Fortune 500 Clients
Free Yearly Update On Purchase Of Multi/Corporate License
Companies Served Till Date