- +1-315-215-1633
- sales@thebrainyinsights.com

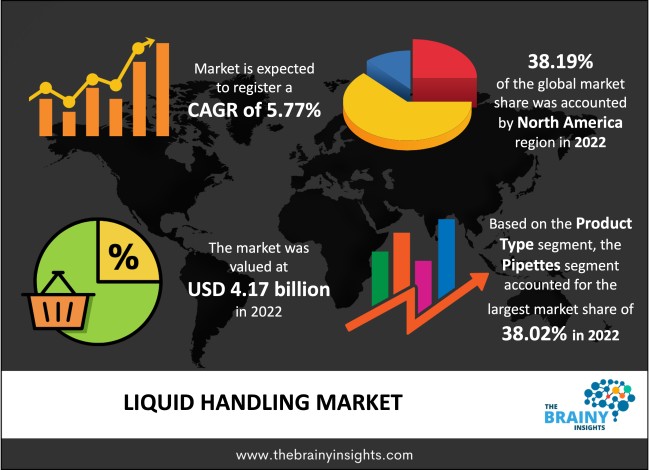
The global liquid handling market was valued at USD 4.17 Billion in 2022 and grew at a CAGR of 5.77% from 2023 to 2032. The market is expected to reach USD 7.30 Billion by 2032. The growth of the liquid handling market can be attributed to the rising investment in research studies, drug discovery and clinical diagnostics. Further, the increasing technological advancement has provided lucrative opportunities to the market.
Transferring reagents for testing purposes in a laboratory from one place to another, such as from one equipment to another, is known as liquid handling. While managing liquids initially appears simple, accuracy is a difficult and important skill. Despite its seeming simplicity, liquid handling is crucial for conducting research and experimentation, finding new ingredients, and using them in healthcare settings. By utilizing liquid handling tools, researchers may correctly finish their investigations while removing the possibility of contamination and human error. RNA/DNA purification, cell culture, automated detection assays, and protein purification are among the methods that require liquid handling. A laboratory's available space, budget, adaptability, and daily sample processing volume are all factors to be considered when choosing liquid handling equipment.
Get an overview of this study by requesting a free sample
Increasing demand for liquid handling products in different studies: In labs studying biological sciences, manipulating liquids is essential. Liquid biosamples sometimes need to be moved between containers of different sizes and poured onto substrates of different sorts in investigations, including protein crystallization, gene sequencing, antibody testing, and drug screening. When examining large-scope combinatorial circumstances, the sample volumes are typically tiny—micro- or nanoliter level—and the number of transferred samples can be enormous. Handling liquids by hand is inconvenient, time-consuming, and tiresome in these circumstances. As a result, there is a high demand for automated liquid-handling products, consumables, and software.
Lack of skilled labour: The increased burden for the current workforce contributes to the skills shortage. The success and cost-effectiveness of production processes are significantly influenced by the skill level of the workforce in the dynamic and competitive pharmaceutical business. The need for a more skilled labour force is restraining the growth of the liquid handling market.
Expansion of the pharmaceutical and biotechnology industry: Many industry participants reported record sales, primarily driven by robust growth in emerging countries like China and India and an increasing number of others. The factors contributing to this growth included growing government spending on pharmaceutical R&D in emerging countries, rising expenditures for life science research and development, drug discovery and clinical diagnostics, technological advancements, emerging applications, growing ageing populations, rising prevalence of chronic diseases, and changing demographics. Technological developments like proteomics and human genome mapping, as well as advances in life science research, have contributed to the rise of the biotechnology business. Thus, the market for liquid handling is further driven by the need for high-end research projects to use high-quality instruments with high throughput capacities.
The regions analyzed for the market include North America, Europe, South America, Asia Pacific, the Middle East, and Africa. North America emerged as the most significant liquid handling market, with a 38.19% market revenue share in 2022.
North America region will account for the largest market share with revenue growth. The region has a well-developed research infrastructure, and thus, many research agencies have been set up there, which boosts the demand for liquid handling products. The prominent global players are present in the U.S. and have a wide distribution network, propelling the regional market's growth. Regional academic institutions, pharmaceutical companies, and biotech companies invest substantially in the life science sector.
North America region Liquid Handling Market Share in 2022 - 38.19%
www.thebrainyinsights.com
Check the geographical analysis of this market by requesting a free sample
The product type segment is divided into pipettes, dispensers, burettes, consumables, software, automated workstations, microplate readers, and others. The pipettes segment dominated the market, with a share of around 38.02% in 2022. A pipette is a scientific instrument frequently used in biology and chemistry to transfer a precisely measured volume of liquid, serving as a media dispenser. Pipettes range in complexity from simple glass pipettes to more intricate adjustable or electronic pipettes, and they are designed for various uses with varying degrees of accuracy and precision.
The technology segment is divided into manual, electronic and automated. The electronic segment dominated the market, with a share of around 45.91% in 2022. Scientists now use pipettes with electronic sensors, which have numerous heads, Bluetooth connectivity, and other capabilities. With the push of a button, laboratory personnel may now aspirate, transfer, and dispense liquids more quickly and efficiently due to electronic liquid handling products, which have set new standards for efficiency.
The application segment is divided into clinical diagnostics, drug discovery, genomics, proteomics and others. The drug discovery segment dominated the market, with a share of around 37.70% in 2022. The initial steps in drug discovery methods, including compound reformatting or sample transfer, often call for extremely flexible liquid transfers from single tubes or tube racks containing microtiter plates. Further, many processes during the phase require such laboratory products.
The end-user segment is divided into research institutions, hospitals and diagnostic laboratories, biotechnology and pharmaceutical companies and others. The hospitals and diagnostic laboratories segment dominated the market, with a share of around 41.26% in 2022. Liquid handling products are employed in the pharmaceutical sector for clinical diagnostics and medication development. These products may safely handle compounds and are compatible with various materials.
| Attribute | Description |
|---|---|
| Market Size | Revenue (USD Billion) |
| Market size value in 2022 | USD 4.17 Billion |
| Market size value in 2032 | USD 7.30 Billion |
| CAGR (2023 to 2032) | 5.77% |
| Historical data | 2019-2021 |
| Base Year | 2022 |
| Forecast | 2023-2032 |
| Region | The regions analyzed for the market are Asia Pacific, Europe, South America, North America, and Middle East & Africa. Furthermore, the regions are further analyzed at the country level. |
| Segments | Product Type, Technology, Application and End-user |
As per The Brainy Insights, the size of the liquid handling market was valued 4.17 billion in 2022 to USD 7.30 Billion by 2032.
Global liquid handling market is growing at a CAGR of 5.77% during the forecast period 2023-2032.
North America region emerged as the largest market for the liquid handling.
The market's growth will be influenced by the growing usage of liquid handling products in research studies.
The lack of skilled labour can hamper the market growth.
The expansion of pharmaceutical and biotech industry are providing huge opportunities to the market.
1. Introduction
1.1. Objectives of the Study
1.2. Market Definition
1.3. Research Scope
1.4. Currency
1.5. Key Target Audience
2. Research Methodology and Assumptions
3. Executive Summary
4. Premium Insights
4.1. Porter’s Five Forces Analysis
4.2. Value Chain Analysis
4.3. Top Investment Pockets
4.3.1. Market Attractiveness Analysis by Product Type
4.3.2. Market Attractiveness Analysis by Technology
4.3.3. Market Attractiveness Analysis by Application
4.3.4. Market Attractiveness Analysis by End-users
4.3.5. Market Attractiveness Analysis by Region
4.4. Industry Trends
5. Market Dynamics
5.1. Market Evaluation
5.2. Drivers
5.2.1. Increasing usage of liquid handling products in different applications
5.3. Restraints
5.3.1. High cost of automated products
5.4. Opportunities
5.4.1. Increasing advancement in disease diagnostics
5.5. Challenges
5.5.1. Stringent regulations for product approval
6. Global Liquid Handling Market Analysis and Forecast, By Product Type
6.1. Segment Overview
6.2. Pipettes
6.3. Dispensers
6.4. Burettes
6.5. Consumables
6.6. Software
6.7. Automated Workstation
6.8. Microplate Readers
6.9. Others
7. Global Liquid Handling Market Analysis and Forecast, By Technology
7.1. Segment Overview
7.2. Manual
7.3. Electronic
7.4. Automated
8. Global Liquid Handling Market Analysis and Forecast, By Application
8.1. Segment Overview
8.2. Clinical Diagnostics
8.3. Drug Discovery
8.4. Genomics
8.5. Proteomics
8.6. Others
9. Global Liquid Handling Market Analysis and Forecast, By End-users
9.1. Segment Overview
9.2. Research Institutions
9.3. Hospitals and Diagnostic Laboratories
9.4. Biotechnology and Pharmaceutical Companies
9.5. Others
10. Global Liquid Handling Market Analysis and Forecast, By Regional Analysis
10.1. Segment Overview
10.2. North America
10.2.1. U.S.
10.2.2. Canada
10.2.3. Mexico
10.3. Europe
10.3.1. Germany
10.3.2. France
10.3.3. U.K.
10.3.4. Italy
10.3.5. Spain
10.4. Asia-Pacific
10.4.1. Japan
10.4.2. China
10.4.3. India
10.5. South America
10.5.1. Brazil
10.6. Middle East and Africa
10.6.1. UAE
10.6.2. South Africa
11. Global Liquid Handling Market-Competitive Landscape
11.1. Overview
11.2. Market Share of Key Players in the Liquid Handling Market
11.2.1. Global Company Market Share
11.2.2. North America Company Market Share
11.2.3. Europe Company Market Share
11.2.4. APAC Company Market Share
11.3. Competitive Situations and Trends
11.3.1. Product Launches and Developments
11.3.2. Partnerships, Collaborations, and Agreements
11.3.3. Mergers & Acquisitions
11.3.4. Expansions
12. Company Profiles
12.1. Danaher Corp.
12.1.1. Business Overview
12.1.2. Company Snapshot
12.1.3. Company Market Share Analysis
12.1.4. Company Product Portfolio
12.1.5. Recent Developments
12.1.6. SWOT Analysis
12.2. Thermo Fisher Scientific
12.2.1. Business Overview
12.2.2. Company Snapshot
12.2.3. Company Market Share Analysis
12.2.4. Company Product Portfolio
12.2.5. Recent Developments
12.2.6. SWOT Analysis
12.3. Agilent Technologies
12.3.1. Business Overview
12.3.2. Company Snapshot
12.3.3. Company Market Share Analysis
12.3.4. Company Product Portfolio
12.3.5. Recent Developments
12.3.6. SWOT Analysis
12.4. PerkinElmer
12.4.1. Business Overview
12.4.2. Company Snapshot
12.4.3. Company Market Share Analysis
12.4.4. Company Product Portfolio
12.4.5. Recent Developments
12.4.6. SWOT Analysis
12.5. Gilson, Inc.
12.5.1. Business Overview
12.5.2. Company Snapshot
12.5.3. Company Market Share Analysis
12.5.4. Company Product Portfolio
12.5.5. Recent Developments
12.5.6. SWOT Analysis
12.6. Hamilton Company
12.6.1. Business Overview
12.6.2. Company Snapshot
12.6.3. Company Market Share Analysis
12.6.4. Company Product Portfolio
12.6.5. Recent Developments
12.6.6. SWOT Analysis
12.7. Tecan Group Ltd.
12.7.1. Business Overview
12.7.2. Company Snapshot
12.7.3. Company Market Share Analysis
12.7.4. Company Product Portfolio
12.7.5. Recent Developments
12.7.6. SWOT Analysis
12.8. Eppendorf AG
12.8.1. Business Overview
12.8.2. Company Snapshot
12.8.3. Company Market Share Analysis
12.8.4. Company Product Portfolio
12.8.5. Recent Developments
12.8.6. SWOT Analysis
12.9. Mettler-Toledo International Inc
12.9.1. Business Overview
12.9.2. Company Snapshot
12.9.3. Company Market Share Analysis
12.9.4. Company Product Portfolio
12.9.5. Recent Developments
12.9.6. SWOT Analysis
12.10. Lonza Group Ltd.
12.10.1. Business Overview
12.10.2. Company Snapshot
12.10.3. Company Market Share Analysis
12.10.4. Company Product Portfolio
12.10.5. Recent Developments
12.10.6. SWOT Analysis
12.11. Sartorius AG
12.11.1. Business Overview
12.11.2. Company Snapshot
12.11.3. Company Market Share Analysis
12.11.4. Company Product Portfolio
12.11.5. Recent Developments
12.11.6. SWOT Analysis
12.12. QIAGEN
12.12.1. Business Overview
12.12.2. Company Snapshot
12.12.3. Company Market Share Analysis
12.12.4. Company Product Portfolio
12.12.5. Recent Developments
12.12.6. SWOT Analysis
12.13. Metrohm A.G.
12.13.1. Business Overview
12.13.2. Company Snapshot
12.13.3. Company Market Share Analysis
12.13.4. Company Product Portfolio
12.13.5. Recent Developments
12.13.6. SWOT Analysis
12.14. Corning Incorporated
12.14.1. Business Overview
12.14.2. Company Snapshot
12.14.3. Company Market Share Analysis
12.14.4. Company Product Portfolio
12.14.5. Recent Developments
12.14.6. SWOT Analysis
12.15. Orochem Technologies Inc.
12.15.1. Business Overview
12.15.2. Company Snapshot
12.15.3. Company Market Share Analysis
12.15.4. Company Product Portfolio
12.15.5. Recent Developments
12.15.6. SWOT Analysis
List of Table
1. Global Liquid Handling Market, By Product Type, 2019-2032 (USD Billion)
2. Global Pipettes, Liquid Handling Market, By Region, 2019-2032 (USD Billion)
3. Global Dispensers, Liquid Handling Market, By Region, 2019-2032 (USD Billion)
4. Global Burettes, Liquid Handling Market, By Region, 2019-2032 (USD Billion)
5. Global Consumables, Liquid Handling Market, By Region, 2019-2032 (USD Billion)
6. Global Software, Liquid Handling Market, By Region, 2019-2032 (USD Billion)
7. Global Automated Workstation, Liquid Handling Market, By Region, 2019-2032 (USD Billion)
8. Global Microplate Readers, Liquid Handling Market, By Region, 2019-2032 (USD Billion)
9. Global Others, Liquid Handling Market, By Region, 2019-2032 (USD Billion)
10. Global Liquid Handling Market, By Technology, 2019-2032 (USD Billion)
11. Global Manual, Liquid Handling Market, By Region, 2019-2032 (USD Billion)
12. Global Electronic, Liquid Handling Market, By Region, 2019-2032 (USD Billion)
13. Global Automated, Liquid Handling Market, By Region, 2019-2032 (USD Billion)
14. Global Liquid Handling Market, By Application, 2019-2032 (USD Billion)
15. Global Clinical Diagnostics, Liquid Handling Market, By Region, 2019-2032 (USD Billion)
16. Global Drug Discovery, Liquid Handling Market, By Region, 2019-2032 (USD Billion)
17. Global Genomics, Liquid Handling Market, By Region, 2019-2032 (USD Billion)
18. Global Proteomics, Liquid Handling Market, By Region, 2019-2032 (USD Billion)
19. Global Others, Liquid Handling Market, By Region, 2019-2032 (USD Billion)
20. Global Liquid Handling Market, By End-users, 2019-2032 (USD Billion)
21. Global Research Institutions, Liquid Handling Market, By Region, 2019-2032 (USD Billion)
22. Global Hospitals and Diagnostic Laboratories, Liquid Handling Market, By Region, 2019-2032 (USD Billion)
23. Global Biotechnology and Pharmaceutical Companies, Liquid Handling Market, By Region, 2019-2032 (USD Billion)
24. Global Others, Liquid Handling Market, By Region, 2019-2032 (USD Billion)
25. Global Liquid Handling Market, By Region, 2019-2032 (USD Billion)
26. North America Liquid Handling Market, By Product Type, 2019-2032 (USD Billion)
27. North America Liquid Handling Market, By Technology, 2019-2032 (USD Billion)
28. North America Liquid Handling Market, By Application, 2019-2032 (USD Billion)
29. North America Liquid Handling Market, By End-users, 2019-2032 (USD Billion)
30. U.S. Liquid Handling Market, By Product Type, 2019-2032 (USD Billion)
31. U.S. Liquid Handling Market, By Technology, 2019-2032 (USD Billion)
32. U.S. Liquid Handling Market, By Application, 2019-2032 (USD Billion)
33. U.S. Liquid Handling Market, By End-users, 2019-2032 (USD Billion)
34. Canada Liquid Handling Market, By Product Type, 2019-2032 (USD Billion)
35. Canada Liquid Handling Market, By Technology, 2019-2032 (USD Billion)
36. Canada Liquid Handling Market, By Application, 2019-2032 (USD Billion)
37. Canada Liquid Handling Market, By End-users, 2019-2032 (USD Billion)
38. Mexico Liquid Handling Market, By Product Type, 2019-2032 (USD Billion)
39. Mexico Liquid Handling Market, By Technology, 2019-2032 (USD Billion)
40. Mexico Liquid Handling Market, By Application, 2019-2032 (USD Billion)
41. Mexico Liquid Handling Market, By End-users, 2019-2032 (USD Billion)
42. Europe Liquid Handling Market, By Product Type, 2019-2032 (USD Billion)
43. Europe Liquid Handling Market, By Technology, 2019-2032 (USD Billion)
44. Europe Liquid Handling Market, By Application, 2019-2032 (USD Billion)
45. Europe Liquid Handling Market, By End-users, 2019-2032 (USD Billion)
46. Germany Liquid Handling Market, By Product Type, 2019-2032 (USD Billion)
47. Germany Liquid Handling Market, By Technology, 2019-2032 (USD Billion)
48. Germany Liquid Handling Market, By Application, 2019-2032 (USD Billion)
49. Germany Liquid Handling Market, By End-users, 2019-2032 (USD Billion)
50. France Liquid Handling Market, By Product Type, 2019-2032 (USD Billion)
51. France Liquid Handling Market, By Technology, 2019-2032 (USD Billion)
52. France Liquid Handling Market, By Application, 2019-2032 (USD Billion)
53. France Liquid Handling Market, By End-users, 2019-2032 (USD Billion)
54. U.K. Liquid Handling Market, By Product Type, 2019-2032 (USD Billion)
55. U.K. Liquid Handling Market, By Technology, 2019-2032 (USD Billion)
56. U.K. Liquid Handling Market, By Application, 2019-2032 (USD Billion)
57. U.K. Liquid Handling Market, By End-users, 2019-2032 (USD Billion)
58. Italy Liquid Handling Market, By Product Type, 2019-2032 (USD Billion)
59. Italy Liquid Handling Market, By Technology, 2019-2032 (USD Billion)
60. Italy Liquid Handling Market, By Application, 2019-2032 (USD Billion)
61. Italy Liquid Handling Market, By End-users, 2019-2032 (USD Billion)
62. Spain Liquid Handling Market, By Product Type, 2019-2032 (USD Billion)
63. Spain Liquid Handling Market, By Technology, 2019-2032 (USD Billion)
64. Spain Liquid Handling Market, By Application, 2019-2032 (USD Billion)
65. Spain Liquid Handling Market, By End-users, 2019-2032 (USD Billion)
66. Asia Pacific Liquid Handling Market, By Product Type, 2019-2032 (USD Billion)
67. Asia Pacific Liquid Handling Market, By Technology, 2019-2032 (USD Billion)
68. Asia Pacific Liquid Handling Market, By Application, 2019-2032 (USD Billion)
69. Asia Pacific Liquid Handling Market, By End-users, 2019-2032 (USD Billion)
70. Japan Liquid Handling Market, By Product Type, 2019-2032 (USD Billion)
71. Japan Liquid Handling Market, By Technology, 2019-2032 (USD Billion)
72. Japan Liquid Handling Market, By Application, 2019-2032 (USD Billion)
73. Japan Liquid Handling Market, By End-users, 2019-2032 (USD Billion)
74. China Liquid Handling Market, By Product Type, 2019-2032 (USD Billion)
75. China Liquid Handling Market, By Technology, 2019-2032 (USD Billion)
76. China Liquid Handling Market, By Application, 2019-2032 (USD Billion)
77. China Liquid Handling Market, By End-users, 2019-2032 (USD Billion)
78. India Liquid Handling Market, By Product Type, 2019-2032 (USD Billion)
79. India Liquid Handling Market, By Technology, 2019-2032 (USD Billion)
80. India Liquid Handling Market, By Application, 2019-2032 (USD Billion)
81. India Liquid Handling Market, By End-users, 2019-2032 (USD Billion)
82. South America Liquid Handling Market, By Product Type, 2019-2032 (USD Billion)
83. South America Liquid Handling Market, By Technology, 2019-2032 (USD Billion)
84. South America Liquid Handling Market, By Application, 2019-2032 (USD Billion)
85. South America Liquid Handling Market, By End-users, 2019-2032 (USD Billion)
86. Brazil Liquid Handling Market, By Product Type, 2019-2032 (USD Billion)
87. Brazil Liquid Handling Market, By Technology, 2019-2032 (USD Billion)
88. Brazil Liquid Handling Market, By Application, 2019-2032 (USD Billion)
89. BrazilLiquid Handling Market, By End-users, 2019-2032 (USD Billion)
90. Middle East and Africa Liquid Handling Market, By Product Type, 2019-2032 (USD Billion)
91. Middle East and Africa Liquid Handling Market, By Technology, 2019-2032 (USD Billion)
92. Middle East and Africa Liquid Handling Market, By Application, 2019-2032 (USD Billion)
93. Middle East and Africa Liquid Handling Market, By End-users, 2019-2032 (USD Billion)
94. UAE Liquid Handling Market, By Product Type, 2019-2032 (USD Billion)
95. UAE Liquid Handling Market, By Technology, 2019-2032 (USD Billion)
96. UAE Liquid Handling Market, By Application, 2019-2032 (USD Billion)
97. UAE Liquid Handling Market, By End-users, 2019-2032 (USD Billion)
98. South Africa Liquid Handling Market, By Product Type, 2019-2032 (USD Billion)
99. South Africa Liquid Handling Market, By Technology, 2019-2032 (USD Billion)
100. South Africa Liquid Handling Market, By Application, 2019-2032 (USD Billion)
101. South Africa Liquid Handling Market, By End-users, 2019-2032 (USD Billion)
List of Figures
1. Global Liquid Handling Market Segmentation
2. Liquid Handling Market: Research Methodology
3. Market Size Estimation Methodology: Bottom-Up Approach
4. Market Size Estimation Methodology: Top-Down Approach
5. Data Triangulation
6. Porter’s Five Forces Analysis
7. Value Chain Analysis
8. Global Liquid Handling Market Attractiveness Analysis by Product Type
9. Global Liquid Handling Market Attractiveness Analysis by Technology
10. Global Liquid Handling Market Attractiveness Analysis by Application
11. Global Liquid Handling Market Attractiveness Analysis by End-users
12. Global Liquid Handling Market Attractiveness Analysis by Region
13. Global Liquid Handling Market: Dynamics
14. Global Liquid Handling Market Share by Product Type (2022 & 2032)
15. Global Liquid Handling Market Share by Technology (2022 & 2032)
16. Global Liquid Handling Market Share by Application (2022 & 2032)
17. Global Liquid Handling Market Share by End-users (2022 & 2032)
18. Global Liquid Handling Market Share by Regions (2022 & 2032)
19. Global Liquid Handling Market Share by Company (2022)
This study forecasts revenue at global, regional, and country levels from 2019 to 2032. The Brainy Insights has segmented the global liquid handling market based on below mentioned segments:
Global Liquid Handling Market by Product Type:
Global Liquid Handling Market by Technology:
Global Liquid Handling Market by Application:
Global Liquid Handling Market by End-user:
Global Liquid Handling Market by Region:
Research has its special purpose to undertake marketing efficiently. In this competitive scenario, businesses need information across all industry verticals; the information about customer wants, market demand, competition, industry trends, distribution channels etc. This information needs to be updated regularly because businesses operate in a dynamic environment. Our organization, The Brainy Insights incorporates scientific and systematic research procedures in order to get proper market insights and industry analysis for overall business success. The analysis consists of studying the market from a miniscule level wherein we implement statistical tools which helps us in examining the data with accuracy and precision.
Our research reports feature both; quantitative and qualitative aspects for any market. Qualitative information for any market research process are fundamental because they reveal the customer needs and wants, usage and consumption for any product/service related to a specific industry. This in turn aids the marketers/investors in knowing certain perceptions of the customers. Qualitative research can enlighten about the different product concepts and designs along with unique service offering that in turn, helps define marketing problems and generate opportunities. On the other hand, quantitative research engages with the data collection process through interviews, e-mail interactions, surveys and pilot studies. Quantitative aspects for the market research are useful to validate the hypotheses generated during qualitative research method, explore empirical patterns in the data with the help of statistical tools, and finally make the market estimations.
The Brainy Insights offers comprehensive research and analysis, based on a wide assortment of factual insights gained through interviews with CXOs and global experts and secondary data from reliable sources. Our analysts and industry specialist assume vital roles in building up statistical tools and analysis models, which are used to analyse the data and arrive at accurate insights with exceedingly informative research discoveries. The data provided by our organization have proven precious to a diverse range of companies, facilitating them to address issues such as determining which products/services are the most appealing, whether or not customers use the product in the manner anticipated, the purchasing intentions of the market and many others.
Our research methodology encompasses an idyllic combination of primary and secondary initiatives. Key phases involved in this process are listed below:

The phase involves the gathering and collecting of market data and its related information with the help of different sources & research procedures.

The data procurement stage involves in data gathering and collecting through various data sources.
This stage involves in extensive research. These data sources includes:
Purchased Database: Purchased databases play a crucial role in estimating the market sizes irrespective of the domain. Our purchased database includes:
Primary Research: The Brainy Insights interacts with leading companies and experts of the concerned domain to develop the analyst team’s market understanding and expertise. It improves and substantiates every single data presented in the market reports. Primary research mainly involves in telephonic interviews, E-mail interactions and face-to-face interviews with the raw material providers, manufacturers/producers, distributors, & independent consultants. The interviews that we conduct provides valuable data on market size and industry growth trends prevailing in the market. Our organization also conducts surveys with the various industry experts in order to gain overall insights of the industry/market. For instance, in healthcare industry we conduct surveys with the pharmacists, doctors, surgeons and nurses in order to gain insights and key information of a medical product/device/equipment which the customers are going to usage. Surveys are conducted in the form of questionnaire designed by our own analyst team. Surveys plays an important role in primary research because surveys helps us to identify the key target audiences of the market. Additionally, surveys helps to identify the key target audience engaged with the market. Our survey team conducts the survey by targeting the key audience, thus gaining insights from them. Based on the perspectives of the customers, this information is utilized to formulate market strategies. Moreover, market surveys helps us to understand the current competitive situation of the industry. To be precise, our survey process typically involve with the 360 analysis of the market. This analytical process begins by identifying the prospective customers for a product or service related to the market/industry to obtain data on how a product/service could fit into customers’ lives.

Secondary Research: The secondary data sources includes information published by the on-profit organizations such as World bank, WHO, company fillings, investor presentations, annual reports, national government documents, statistical databases, blogs, articles, white papers and others. From the annual report, we analyse a company’s revenue to understand the key segment and market share of that organization in a particular region. We analyse the company websites and adopt the product mapping technique which is important for deriving the segment revenue. In the product mapping method, we select and categorize the products offered by the companies catering to domain specific market, deduce the product revenue for each of the companies so as to get overall estimation of the market size. We also source data and analyses trends based on information received from supply side and demand side intermediaries in the value chain. The supply side denotes the data gathered from supplier, distributor, wholesaler and the demand side illustrates the data gathered from the end customers for respective market domain.

The supply side for a domain specific market is analysed by:
The demand side for the market is estimated through:
In-house Library: Apart from these third-party sources, we have our in-house library of qualitative and quantitative information. Our in-house database includes market data for various industry and domains. These data are updated on regular basis as per the changing market scenario. Our library includes, historic databases, internal audit reports and archives.
Sometimes there are instances where there is no metadata or raw data available for any domain specific market. For those cases, we use our expertise to forecast and estimate the market size in order to generate comprehensive data sets. Our analyst team adopt a robust research technique in order to produce the estimates:
Data Synthesis: This stage involves the analysis & mapping of all the information obtained from the previous step. It also involves in scrutinizing the data for any discrepancy observed while data gathering related to the market. The data is collected with consideration to the heterogeneity of sources. Robust scientific techniques are in place for synthesizing disparate data sets and provide the essential contextual information that can orient market strategies. The Brainy Insights has extensive experience in data synthesis where the data passes through various stages:


Market Deduction & Formulation: The final stage comprises of assigning data points at appropriate market spaces so as to deduce feasible conclusions. Analyst perspective & subject matter expert based holistic form of market sizing coupled with industry analysis also plays a crucial role in this stage.
This stage involves in finalization of the market size and numbers that we have collected from data integration step. With data interpolation, it is made sure that there is no gap in the market data. Successful trend analysis is done by our analysts using extrapolation techniques, which provide the best possible forecasts for the market.
Data Validation & Market Feedback: Validation is the most important step in the process. Validation & re-validation via an intricately designed process helps us finalize data-points to be used for final calculations.

The Brainy Insights interacts with leading companies and experts of the concerned domain to develop the analyst team’s market understanding and expertise. It improves and substantiates every single data presented in the market reports. The data validation interview and discussion panels are typically composed of the most experienced industry members. The participants include, however, are not limited to:
Moreover, we always validate our data and findings through primary respondents from all the major regions we are working on.


Free Customization
Fortune 500 Clients
Free Yearly Update On Purchase Of Multi/Corporate License
Companies Served Till Date