- +1-315-215-1633
- sales@thebrainyinsights.com

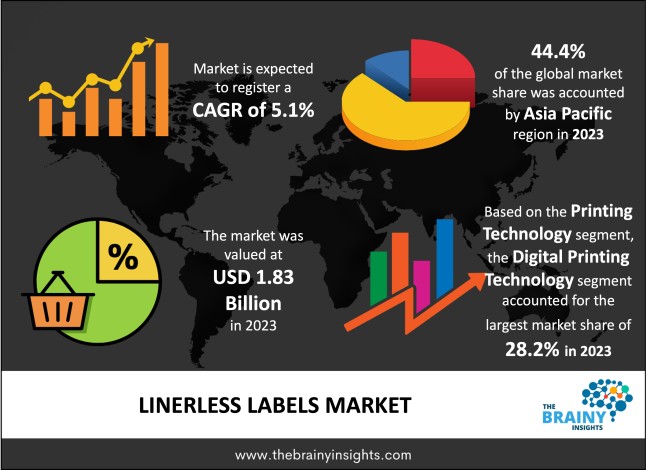
The global linerless labels market is expected to reach USD 3.01 billion by 2033, at a CAGR of 5.1% from 2024 to 2033. The rise in demand for packed food & beverages drives the expansion of the linerless labels market.
Linerless labels can be printed utilizing the PW2NX Series, SATO MB Series, and CLNX Series printers. Different accessories are known for comfort & convenience, including swivel belt clips, shoulder straps, weather-resistant carrying cases, holsters, single and multiple-unit battery chargers, and cables. Linerless labels are available with repositionable, removable, and permanent adhesives. Linerless labels are the perfect option for corporations considering switching to a sustainable, environmentally friendly solution. Linerless labels have plenty of options, involving permanent labels among hot melt adhesive & semi-permanent reusable labels amidst acrylic adhesive. Also, the linerless labels have a longer ledge life because their silicone coating shields againt moisture, chemical, and UV exposure. Further, the coating is also less abrasive to printer heads, covering expensive printing equipment from wear & tear, ultimately saving on prices. The advantages of utilizing linerless labels are that no liner waste dismisses the risk of injury via slippage, reduces transportation prices, less storage space needed, supports a low carbon footprint, and less waste removal translates to less CO2 emission.
Get an overview of this study by requesting a free sample
The growing health awareness & per capita income has driven the increasing demand for packaged products to drive market growth. Further, the significant expansion in food & beverage packaging goods, increasing customer goods demand, the need for sustainable & innovative labeling solutions are also helping to boost the demand for market growth. Moreover, the rising demand for biodegradable, versatile, and environmental labels in emerging economies is also helping to drive market growth.
The stringent government rules & regulations and the high prices of printing systems are the restraining factors of the market growth. Moreover, the industrial labels are fabricated in an eco-friendly way according to guidelines due to the packaging regulations. There is no liner, but these labels are multi-layered & need the production of plastic resin & other raw materials. The controllers regularly check the labeling materials and their advantages. Further, the manufacturers of linerless labels must concede to government rules to meet key needs like the sustainability, legitimacy, and durability of industrial brands. Additionally, different stringent regulations & codes of conduct are imposed on production concerning plastic resins in labels that may hinder production & operation in the linerless label industry. These factors are restraining the market growth.
The increasing advancement for linerless labels is the opportunity factor for market growth. The linerless labels industry has experienced developments & innovations in equipment, products, machinery, and new technologies like color printing, digital printing, and laser printing. Moreover, the increasing healthcare spending in different countries and rising expenditure development are likely to drive the market growth as pharmaceutical goods & services utilize linerless labels in the enterprises. Additionally, the increasing demand for environmental, versatile, and biodegradable labels in emerging economies and the prevention of waste, preservation of natural resources, and energy efficiency is the key factor to driving the growth of the linerless labels market.
The global linerless labels market has been segmented based on printing technology, printing ink, product, composition, end-user industry, and regions.
The regions analyzed for the market include North America, Europe, South America, Asia Pacific, the Middle East, and Africa. Asia Pacific region emerged as the largest market for the global linerless labels market, with a 44.4% share of the market revenue in 2023.
Asia Pacific Region Linerless Labels Market Share in 2023 - 44.4%
www.thebrainyinsights.com
Check the geographical analysis of this market by requesting a free sample
The key players are now concentrating on implementing strategies such as adopting new technology, product innovations, mergers & acquisitions, joint venture, alliances, and partnerships to improve their market position in the global linerless labels industry.
For example, in June 2020, Hub Labels Company announced the procurement of a hot melt adhesive & new silicone coater from ETI Converting Equipment.
As per The Brainy Insights, the size of the linerless labels market was valued at USD 1.83 billion in 2023 to USD 3.01 billion by 2033.
Global linerless labels market is growing at a CAGR of 5.1% during the forecast period 2024-2033.
Asia Pacific region emerged as the largest market for the linerless labels.
The market's growth will be influenced by the rising demand for packed food & beverage.
The stringent government rules & regulations could hamper the market growth.
The increasing advancement for linerless labels will provide considerable opportunities to the market.
1. Introduction
1.1. Objectives of the Study
1.2. Market Definition
1.3. Research Scope
1.4. Currency
1.5. Key Target Audience
2. Research Methodology and Assumptions
3. Executive Summary
4. Premium Insights
4.1. Porter’s Five Forces Analysis
4.2. Value Chain Analysis
4.3. Top Investment Pockets
4.3.1. Market Attractiveness Analysis By Printing Technology
4.3.2. Market Attractiveness Analysis By Printing Ink
4.3.3. Market Attractiveness Analysis By Product
4.3.4. Market Attractiveness Analysis By Composition
4.3.5. Market Attractiveness Analysis By End-User Industry
4.3.6. Market Attractiveness Analysis By Region
4.4. Industry Trends
5. Market Dynamics
5.1. Market Evaluation
5.2. Drivers
5.2.1. The rising demand from customer durables, retail, personal care, and pharmaceuticals sectors
5.2.2. Rising disposable incomes
5.2.3. Expanding e-commerce enterprise
5.3. Restraints
5.3.1. Fluctuating price of raw materials
5.3.2. Stringent government regulations & rules
5.4. Opportunities
5.4.1. Rising adoption of advanced linerless labels in emerging economies
6. Global Linerless Labels Market Analysis and Forecast, By Printing Technology
6.1. Segment Overview
6.2. Flexographic Printing
6.3. Digital Printing
6.4. Letter Press Printing
6.5. Offset Printing
6.6. Others
7. Global Linerless Labels Market Analysis and Forecast, By Printing Ink
7.1. Segment Overview
7.2. Water-based Ink
7.3. Solvent-based Ink
7.4. UV Curable Ink
7.5. Others
8. Global Linerless Labels Market Analysis and Forecast, By Product
8.1. Segment Overview
8.2. Variable Information Print
8.3. Primary
9. Global Linerless Labels Market Analysis and Forecast, By Composition
9.1. Segment Overview
9.2. Topcoat
9.3. Adhesive
9.4. Face Stock
10. Global Linerless Labels Market Analysis and Forecast, By End-User Industry
10.1. Segment Overview
10.2. Retail
10.3. Food & Beverage
10.4. Home & Personal Care
10.5. Others
11. Global Linerless Labels Market Analysis and Forecast, By Regional Analysis
11.1. Segment Overview
11.2. North America
11.2.1. U.S.
11.2.2. Canada
11.2.3. Mexico
11.3. Europe
11.3.1. Germany
11.3.2. France
11.3.3. U.K.
11.3.4. Italy
11.3.5. Spain
11.4. Asia-Pacific
11.4.1. Japan
11.4.2. China
11.4.3. India
11.5. South America
11.5.1. Brazil
11.6. Middle East and Africa
11.6.1. UAE
11.6.2. South Africa
12. Global Linerless Labels Market-Competitive Landscape
12.1. Overview
12.2. Market Share of Key Players in Global Linerless Labels Market
12.2.1. Global Company Market Share
12.2.2. North America Company Market Share
12.2.3. Europe Company Market Share
12.2.4. APAC Company Market Share
12.3. Competitive Situations and Trends
12.3.1. Product Launches and Developments
12.3.2. Partnerships, Collaborations, and Agreements
12.3.3. Mergers & Acquisitions
12.3.4. Expansions
13. Company Profiles
13.1. Avery Dennison Corp.
13.1.1. Business Overview
13.1.2. Company Snapshot
13.1.3. Company Market Share Analysis
13.1.4. Company Product Portfolio
13.1.5. Recent Developments
13.1.6. SWOT Analysis
13.2. RR Donnelley & Sons Company
13.2.1. Business Overview
13.2.2. Company Snapshot
13.2.3. Company Market Share Analysis
13.2.4. Company Product Portfolio
13.2.5. Recent Developments
13.2.6. SWOT Analysis
13.3. Yupo Corporation
13.3.1. Business Overview
13.3.2. Company Snapshot
13.3.3. Company Market Share Analysis
13.3.4. Company Product Portfolio
13.3.5. Recent Developments
13.3.6. SWOT Analysis
13.4. General Data Company Inc.
13.4.1. Business Overview
13.4.2. Company Snapshot
13.4.3. Company Market Share Analysis
13.4.4. Company Product Portfolio
13.4.5. Recent Developments
13.4.6. SWOT Analysis
13.5. SATO Holdings Corporation
13.5.1. Business Overview
13.5.2. Company Snapshot
13.5.3. Company Market Share Analysis
13.5.4. Company Product Portfolio
13.5.5. Recent Developments
13.5.6. SWOT Analysis
13.6. Zebra Technologies Corp.
13.6.1. Business Overview
13.6.2. Company Snapshot
13.6.3. Company Market Share Analysis
13.6.4. Company Product Portfolio
13.6.5. Recent Developments
13.6.6. SWOT Analysis
13.7. Coveris
13.7.1. Business Overview
13.7.2. Company Snapshot
13.7.3. Company Market Share Analysis
13.7.4. Company Product Portfolio
13.7.5. Recent Developments
13.7.6. SWOT Analysis
13.8. Skanem AS
13.8.1. Business Overview
13.8.2. Company Snapshot
13.8.3. Company Market Share Analysis
13.8.4. Company Product Portfolio
13.8.5. Recent Developments
13.8.6. SWOT Analysis
13.9. CCL Industries Inc.
13.9.1. Business Overview
13.9.2. Company Snapshot
13.9.3. Company Market Share Analysis
13.9.4. Company Product Portfolio
13.9.5. Recent Developments
13.9.6. SWOT Analysis
13.10. Multi-Color Corporation
13.10.1. Business Overview
13.10.2. Company Snapshot
13.10.3. Company Market Share Analysis
13.10.4. Company Product Portfolio
13.10.5. Recent Developments
13.10.6. SWOT Analysis
13.11. Gipako UAB
13.11.1. Business Overview
13.11.2. Company Snapshot
13.11.3. Company Market Share Analysis
13.11.4. Company Product Portfolio
13.11.5. Recent Developments
13.11.6. SWOT Analysis
13.12. Ritrama S.p.A.
13.12.1. Business Overview
13.12.2. Company Snapshot
13.12.3. Company Market Share Analysis
13.12.4. Company Product Portfolio
13.12.5. Recent Developments
13.12.6. SWOT Analysis
13.13. Hub Labels
13.13.1. Business Overview
13.13.2. Company Snapshot
13.13.3. Company Market Share Analysis
13.13.4. Company Product Portfolio
13.13.5. Recent Developments
13.13.6. SWOT Analysis
13.14. Ravenwood Packaging
13.14.1. Business Overview
13.14.2. Company Snapshot
13.14.3. Company Market Share Analysis
13.14.4. Company Product Portfolio
13.14.5. Recent Developments
13.14.6. SWOT Analysis
13.15. Reflex Labels Ltd.
13.15.1. Business Overview
13.15.2. Company Snapshot
13.15.3. Company Market Share Analysis
13.15.4. Company Product Portfolio
13.15.5. Recent Developments
13.15.6. SWOT Analysis
List of Table
1. Global Linerless Labels Market, By Printing Technology, 2020-2033 (USD Billion)
2. Global Flexographic Printing, Linerless Labels Market, By Region, 2020-2033 (USD Billion)
3. Global Digital Printing, Linerless Labels Market, By Region, 2020-2033 (USD Billion)
4. Global Letter Press Printing, Linerless Labels Market, By Region, 2020-2033 (USD Billion)
5. Global Offset Printing, Linerless Labels Market, By Region, 2020-2033 (USD Billion)
6. Global Others, Linerless Labels Market, By Region, 2020-2033 (USD Billion)
7. Global Linerless Labels Market, By Printing Ink, 2020-2033 (USD Billion)
8. Global Water-based Ink, Linerless Labels Market, By Region, 2020-2033 (USD Billion)
9. Global Solvent-based Ink, Linerless Labels Market, By Region, 2020-2033 (USD Billion)
10. Global UV Curable Ink, Linerless Labels Market, By Region, 2020-2033 (USD Billion)
11. Global Others, Linerless Labels Market, By Region, 2020-2033 (USD Billion)
12. Global Linerless Labels Market, By Product, 2020-2033 (USD Billion)
13. Global Variable Information Print, Linerless Labels Market, By Region, 2020-2033 (USD Billion)
14. Global Primary, Linerless Labels Market, By Region, 2020-2033 (USD Billion)
15. Global Linerless Labels Market, By Composition, 2020-2033 (USD Billion)
16. Global Topcoat, Linerless Labels Market, By Region, 2020-2033 (USD Billion)
17. Global Adhesive, Linerless Labels Market, By Region, 2020-2033 (USD Billion)
18. Global Face Stock, Linerless Labels Market, By Region, 2020-2033 (USD Billion)
19. Global Linerless Labels Market, By End-User Industry, 2020-2033 (USD Billion)
20. Global Retail, Linerless Labels Market, By Region, 2020-2033 (USD Billion)
21. Global Food & Beverage, Linerless Labels Market, By Region, 2020-2033 (USD Billion)
22. Global Home & Personal Care, Linerless Labels Market, By Region, 2020-2033 (USD Billion)
23. Global Others, Linerless Labels Market, By Region, 2020-2033 (USD Billion)
24. North America Linerless Labels Market, By Printing Technology, 2020-2033 (USD Billion)
25. North America Linerless Labels Market, By Printing Ink, 2020-2033 (USD Billion)
26. North America Linerless Labels Market, By Product, 2020-2033 (USD Billion)
27. North America Linerless Labels Market, By Composition, 2020-2033 (USD Billion)
28. North America Linerless Labels Market, By End-User Industry, 2020-2033 (USD Billion)
29. U.S. Linerless Labels Market, By Printing Technology, 2020-2033 (USD Billion)
30. U.S. Linerless Labels Market, By Printing Ink, 2020-2033 (USD Billion)
31. U.S. Linerless Labels Market, By Product, 2020-2033 (USD Billion)
32. U.S. Linerless Labels Market, By Composition, 2020-2033 (USD Billion)
33. U.S. Linerless Labels Market, By End-User Industry, 2020-2033 (USD Billion)
34. Canada Linerless Labels Market, By Printing Technology, 2020-2033 (USD Billion)
35. Canada Linerless Labels Market, By Printing Ink, 2020-2033 (USD Billion)
36. Canada Linerless Labels Market, By Product, 2020-2033 (USD Billion)
37. Canada Linerless Labels Market, By Composition, 2020-2033 (USD Billion)
38. Canada Linerless Labels Market, By End-User Industry, 2020-2033 (USD Billion)
39. Mexico Linerless Labels Market, By Printing Technology, 2020-2033 (USD Billion)
40. Mexico Linerless Labels Market, By Printing Ink, 2020-2033 (USD Billion)
41. Mexico Linerless Labels Market, By Product, 2020-2033 (USD Billion)
42. Mexico Linerless Labels Market, By Composition, 2020-2033 (USD Billion)
43. Mexico Linerless Labels Market, By End-User Industry, 2020-2033 (USD Billion)
44. Europe Linerless Labels Market, By Printing Technology, 2020-2033 (USD Billion)
45. Europe Linerless Labels Market, By Printing Ink, 2020-2033 (USD Billion)
46. Europe Linerless Labels Market, By Product, 2020-2033 (USD Billion)
47. Europe Linerless Labels Market, By Composition, 2020-2033 (USD Billion)
48. Europe Linerless Labels Market, By End-User Industry, 2020-2033 (USD Billion)
49. Germany Linerless Labels Market, By Printing Technology, 2020-2033 (USD Billion)
50. Germany Linerless Labels Market, By Printing Ink, 2020-2033 (USD Billion)
51. Germany Linerless Labels Market, By Product, 2020-2033 (USD Billion)
52. Germany Linerless Labels Market, By Composition, 2020-2033 (USD Billion)
53. Germany Linerless Labels Market, By End-User Industry, 2020-2033 (USD Billion)
54. France Linerless Labels Market, By Printing Technology, 2020-2033 (USD Billion)
55. France Linerless Labels Market, By Printing Ink, 2020-2033 (USD Billion)
56. France Linerless Labels Market, By Product, 2020-2033 (USD Billion)
57. France Linerless Labels Market, By Composition, 2020-2033 (USD Billion)
58. France Linerless Labels Market, By End-User Industry, 2020-2033 (USD Billion)
59. U.K. Linerless Labels Market, By Printing Technology, 2020-2033 (USD Billion)
60. U.K. Linerless Labels Market, By Printing Ink, 2020-2033 (USD Billion)
61. U.K. Linerless Labels Market, By Product, 2020-2033 (USD Billion)
62. U.K. Linerless Labels Market, By Composition, 2020-2033 (USD Billion)
63. U.K. Linerless Labels Market, By End-User Industry, 2020-2033 (USD Billion)
64. Italy Linerless Labels Market, By Printing Technology, 2020-2033 (USD Billion)
65. Italy Linerless Labels Market, By Printing Ink, 2020-2033 (USD Billion)
66. Italy Linerless Labels Market, By Product, 2020-2033 (USD Billion)
67. Italy Linerless Labels Market, By Composition, 2020-2033 (USD Billion)
68. Italy Linerless Labels Market, By End-User Industry, 2020-2033 (USD Billion)
69. Spain Linerless Labels Market, By Printing Technology, 2020-2033 (USD Billion)
70. Spain Linerless Labels Market, By Printing Ink, 2020-2033 (USD Billion)
71. Spain Linerless Labels Market, By Product, 2020-2033 (USD Billion)
72. Spain Linerless Labels Market, By Composition, 2020-2033 (USD Billion)
73. Spain Linerless Labels Market, By End-User Industry, 2020-2033 (USD Billion)
74. Asia Pacific Linerless Labels Market, By Printing Technology, 2020-2033 (USD Billion)
75. Asia Pacific Linerless Labels Market, By Printing Ink, 2020-2033 (USD Billion)
76. Asia Pacific Linerless Labels Market, By Product, 2020-2033 (USD Billion)
77. Asia Pacific Linerless Labels Market, By Composition, 2020-2033 (USD Billion)
78. Asia Pacific Linerless Labels Market, By End-User Industry, 2020-2033 (USD Billion)
79. Japan Linerless Labels Market, By Printing Technology, 2020-2033 (USD Billion)
80. Japan Linerless Labels Market, By Printing Ink, 2020-2033 (USD Billion)
81. Japan Linerless Labels Market, By Product, 2020-2033 (USD Billion)
82. Japan Linerless Labels Market, By Composition, 2020-2033 (USD Billion)
83. Japan Linerless Labels Market, By End-User Industry, 2020-2033 (USD Billion)
84. China Linerless Labels Market, By Printing Technology, 2020-2033 (USD Billion)
85. China Linerless Labels Market, By Printing Ink, 2020-2033 (USD Billion)
86. China Linerless Labels Market, By Product, 2020-2033 (USD Billion)
87. China Linerless Labels Market, By Composition, 2020-2033 (USD Billion)
88. China Linerless Labels Market, By End-User Industry, 2020-2033 (USD Billion)
89. India Linerless Labels Market, By Printing Technology, 2020-2033 (USD Billion)
90. India Linerless Labels Market, By Printing Ink, 2020-2033 (USD Billion)
91. India Linerless Labels Market, By Product, 2020-2033 (USD Billion)
92. India Linerless Labels Market, By Composition, 2020-2033 (USD Billion)
93. India Linerless Labels Market, By End-User Industry, 2020-2033 (USD Billion)
94. South America Linerless Labels Market, By Printing Technology, 2020-2033 (USD Billion)
95. South America Linerless Labels Market, By Printing Ink, 2020-2033 (USD Billion)
96. South America Linerless Labels Market, By Product, 2020-2033 (USD Billion)
97. South America Linerless Labels Market, By Composition, 2020-2033 (USD Billion)
98. South America Linerless Labels Market, By End-User Industry, 2020-2033 (USD Billion)
99. Brazil Linerless Labels Market, By Printing Technology, 2020-2033 (USD Billion)
100. Brazil Linerless Labels Market, By Printing Ink, 2020-2033 (USD Billion)
101. Brazil Linerless Labels Market, By Product, 2020-2033 (USD Billion)
102. Brazil Linerless Labels Market, By Composition, 2020-2033 (USD Billion)
103. Brazil Linerless Labels Market, By End-User Industry, 2020-2033 (USD Billion)
104. Middle East and Africa Linerless Labels Market, By Printing Technology, 2020-2033 (USD Billion)
105. Middle East and Africa Linerless Labels Market, By Printing Ink, 2020-2033 (USD Billion)
106. Middle East and Africa Linerless Labels Market, By Product, 2020-2033 (USD Billion)
107. Middle East and Africa Linerless Labels Market, By Composition, 2020-2033 (USD Billion)
108. Middle East and Africa Linerless Labels Market, By End-User Industry, 2020-2033 (USD Billion)
109. UAE Linerless Labels Market, By Printing Technology, 2020-2033 (USD Billion)
110. UAE Linerless Labels Market, By Printing Ink, 2020-2033 (USD Billion)
111. UAE Linerless Labels Market, By Product, 2020-2033 (USD Billion)
112. UAE Linerless Labels Market, By Composition, 2020-2033 (USD Billion)
113. UAE Linerless Labels Market, By End-User Industry, 2020-2033 (USD Billion)
114. South Africa Linerless Labels Market, By Printing Technology, 2020-2033 (USD Billion)
115. South Africa Linerless Labels Market, By Printing Ink, 2020-2033 (USD Billion)
116. South Africa Linerless Labels Market, By Product, 2020-2033 (USD Billion)
117. South Africa Linerless Labels Market, By Composition, 2020-2033 (USD Billion)
118. South Africa Linerless Labels Market, By End-User Industry, 2020-2033 (USD Billion)
List of Figures
1. Global Linerless Labels Market Segmentation
2. Global Linerless Labels Market: Research Methodology
3. Market Size Estimation Methodology: Bottom-Up Approach
4. Market Size Estimation Methodology: Top-Down Approach
5. Data Triangulation
6. Porter’s Five Forces Analysis
7. Value Chain Analysis
8. Global Linerless Labels Market Attractiveness Analysis By Printing Technology
9. Global Linerless Labels Market Attractiveness Analysis By Printing Ink
10. Global Linerless Labels Market Attractiveness Analysis By Product
11. Global Linerless Labels Market Attractiveness Analysis By Composition
12. Global Linerless Labels Market Attractiveness Analysis By End-User Industry
13. Global Linerless Labels Market Attractiveness Analysis By Region
14. Global Linerless Labels Market: Dynamics
15. Global Linerless Labels Market Share By Printing Technology (2023 & 2033)
16. Global Linerless Labels Market Share By Printing Ink (2023 & 2033)
17. Global Linerless Labels Market Share By Product (2023 & 2033)
18. Global Linerless Labels Market Share By Composition (2023 & 2033)
19. Global Linerless Labels Market Share By End-User Industry (2023 & 2033)
20. Global Linerless Labels Market Share By Regions (2023 & 2033)
21. Global Linerless Labels Market Share By Company (2023)
This study forecasts revenue at global, regional, and country levels from 2020 to 2033. The Brainy Insights has segmented the global linerless labels based on below mentioned segments:
Global Linerless Labels Market by Printing Technology:
Global Linerless Labels Market by Printing Ink:
Global Linerless Labels Market by Product:
Global Linerless Labels Market by Composition:
Global Linerless Labels Market by End-User Industry:
Global Linerless Labels by Region:
Research has its special purpose to undertake marketing efficiently. In this competitive scenario, businesses need information across all industry verticals; the information about customer wants, market demand, competition, industry trends, distribution channels etc. This information needs to be updated regularly because businesses operate in a dynamic environment. Our organization, The Brainy Insights incorporates scientific and systematic research procedures in order to get proper market insights and industry analysis for overall business success. The analysis consists of studying the market from a miniscule level wherein we implement statistical tools which helps us in examining the data with accuracy and precision.
Our research reports feature both; quantitative and qualitative aspects for any market. Qualitative information for any market research process are fundamental because they reveal the customer needs and wants, usage and consumption for any product/service related to a specific industry. This in turn aids the marketers/investors in knowing certain perceptions of the customers. Qualitative research can enlighten about the different product concepts and designs along with unique service offering that in turn, helps define marketing problems and generate opportunities. On the other hand, quantitative research engages with the data collection process through interviews, e-mail interactions, surveys and pilot studies. Quantitative aspects for the market research are useful to validate the hypotheses generated during qualitative research method, explore empirical patterns in the data with the help of statistical tools, and finally make the market estimations.
The Brainy Insights offers comprehensive research and analysis, based on a wide assortment of factual insights gained through interviews with CXOs and global experts and secondary data from reliable sources. Our analysts and industry specialist assume vital roles in building up statistical tools and analysis models, which are used to analyse the data and arrive at accurate insights with exceedingly informative research discoveries. The data provided by our organization have proven precious to a diverse range of companies, facilitating them to address issues such as determining which products/services are the most appealing, whether or not customers use the product in the manner anticipated, the purchasing intentions of the market and many others.
Our research methodology encompasses an idyllic combination of primary and secondary initiatives. Key phases involved in this process are listed below:

The phase involves the gathering and collecting of market data and its related information with the help of different sources & research procedures.

The data procurement stage involves in data gathering and collecting through various data sources.
This stage involves in extensive research. These data sources includes:
Purchased Database: Purchased databases play a crucial role in estimating the market sizes irrespective of the domain. Our purchased database includes:
Primary Research: The Brainy Insights interacts with leading companies and experts of the concerned domain to develop the analyst team’s market understanding and expertise. It improves and substantiates every single data presented in the market reports. Primary research mainly involves in telephonic interviews, E-mail interactions and face-to-face interviews with the raw material providers, manufacturers/producers, distributors, & independent consultants. The interviews that we conduct provides valuable data on market size and industry growth trends prevailing in the market. Our organization also conducts surveys with the various industry experts in order to gain overall insights of the industry/market. For instance, in healthcare industry we conduct surveys with the pharmacists, doctors, surgeons and nurses in order to gain insights and key information of a medical product/device/equipment which the customers are going to usage. Surveys are conducted in the form of questionnaire designed by our own analyst team. Surveys plays an important role in primary research because surveys helps us to identify the key target audiences of the market. Additionally, surveys helps to identify the key target audience engaged with the market. Our survey team conducts the survey by targeting the key audience, thus gaining insights from them. Based on the perspectives of the customers, this information is utilized to formulate market strategies. Moreover, market surveys helps us to understand the current competitive situation of the industry. To be precise, our survey process typically involve with the 360 analysis of the market. This analytical process begins by identifying the prospective customers for a product or service related to the market/industry to obtain data on how a product/service could fit into customers’ lives.

Secondary Research: The secondary data sources includes information published by the on-profit organizations such as World bank, WHO, company fillings, investor presentations, annual reports, national government documents, statistical databases, blogs, articles, white papers and others. From the annual report, we analyse a company’s revenue to understand the key segment and market share of that organization in a particular region. We analyse the company websites and adopt the product mapping technique which is important for deriving the segment revenue. In the product mapping method, we select and categorize the products offered by the companies catering to domain specific market, deduce the product revenue for each of the companies so as to get overall estimation of the market size. We also source data and analyses trends based on information received from supply side and demand side intermediaries in the value chain. The supply side denotes the data gathered from supplier, distributor, wholesaler and the demand side illustrates the data gathered from the end customers for respective market domain.

The supply side for a domain specific market is analysed by:
The demand side for the market is estimated through:
In-house Library: Apart from these third-party sources, we have our in-house library of qualitative and quantitative information. Our in-house database includes market data for various industry and domains. These data are updated on regular basis as per the changing market scenario. Our library includes, historic databases, internal audit reports and archives.
Sometimes there are instances where there is no metadata or raw data available for any domain specific market. For those cases, we use our expertise to forecast and estimate the market size in order to generate comprehensive data sets. Our analyst team adopt a robust research technique in order to produce the estimates:
Data Synthesis: This stage involves the analysis & mapping of all the information obtained from the previous step. It also involves in scrutinizing the data for any discrepancy observed while data gathering related to the market. The data is collected with consideration to the heterogeneity of sources. Robust scientific techniques are in place for synthesizing disparate data sets and provide the essential contextual information that can orient market strategies. The Brainy Insights has extensive experience in data synthesis where the data passes through various stages:


Market Deduction & Formulation: The final stage comprises of assigning data points at appropriate market spaces so as to deduce feasible conclusions. Analyst perspective & subject matter expert based holistic form of market sizing coupled with industry analysis also plays a crucial role in this stage.
This stage involves in finalization of the market size and numbers that we have collected from data integration step. With data interpolation, it is made sure that there is no gap in the market data. Successful trend analysis is done by our analysts using extrapolation techniques, which provide the best possible forecasts for the market.
Data Validation & Market Feedback: Validation is the most important step in the process. Validation & re-validation via an intricately designed process helps us finalize data-points to be used for final calculations.

The Brainy Insights interacts with leading companies and experts of the concerned domain to develop the analyst team’s market understanding and expertise. It improves and substantiates every single data presented in the market reports. The data validation interview and discussion panels are typically composed of the most experienced industry members. The participants include, however, are not limited to:
Moreover, we always validate our data and findings through primary respondents from all the major regions we are working on.


Free Customization
Fortune 500 Clients
Free Yearly Update On Purchase Of Multi/Corporate License
Companies Served Till Date