- +1-315-215-1633
- sales@thebrainyinsights.com

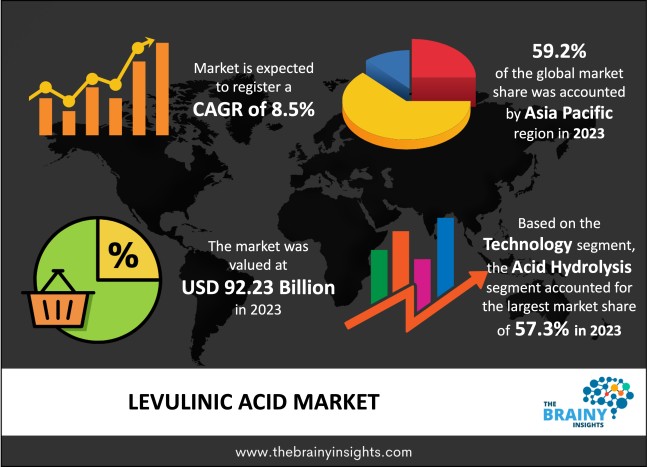
The global levulinic acid market was valued at USD 92.23 million in 2023, growing at a CAGR of 8.5% from 2024 to 2033. The market is expected to reach USD 208.52 million by 2033. The levulinic acid market is being driven by an increase in pharmaceutical sector demand for drug preparation due to an increase in global disease and infection rates. Levulinic acid, called 4-oxopentanoic acid, is a keto acid categorized as an organic compound. It takes the physical form of white crystalline solids and can be dissolved in water, diethyl ether or ethanol but cannot dissolve in aliphatic hydrocarbons. In recent times, with sustainability being pivotal for the chemical industries, it has been increasingly important to explore renewable chemistry and biotechnology using bio-based sources that serve as platforms during manufacturing processes. These products are developed mainly to replace their synthetic counterparts while simultaneously creating multiple industrial chemicals and speciality items.
Levulinic acid, also known as 4-oxopentanoic acid, is an organic molecule classified as a keto acid. This white, crystalline solid is made from cellulose breakdown and is soluble in water and other polar organic solvents. It is mainly derived from bio-mass and brewery waste. Still, it can also be derived from various techniques, such as the oxidation of ketones and acidic hydrolysis of furfuryl alcohol. Levulinic acid is considered an adequate substitute for petroleum-based goods in various industries, including biofuels and the chemical industry. It is also used as a precursor in plasticizers and pharmaceuticals. The involvement of levulinic acid in the production of polyvinyl chloride (PVC) is one of the primary factors driving the market's growth. Because PVC is a less harmful alternative to phthalate plasticizers, it is increasingly used in packaging, healthcare, automobiles, construction, and others.
Furthermore, levulinic acid is utilized as an ingredient in producing biofuels and various pharmaceutical goods. It is also used to manufacture cigarettes because levulinic acid increases the nicotine concentration. Increased R&D towards the development of bio-based levulinic acid is likely to present the market with attractive potential prospects.
Get an overview of this study by requesting a free sample
In June 2022, GFBiochemicals agreed to distribute biobased and biodegradable solvents made from levulinic acid for the European market through BASF's European distribution organization, BTC Europe GmbH.
Rising Environmental Concerns- Because of increased environmental concerns and long-term economic growth, government rules governing the production of levulinic acid are favourable. These policies frequently reflect initiatives based on comparative advantages and national interests. Its goal is to promote public procurement, employment creation, and the transformation from a linear to a circular economy.
Alternatives- The possibility of synthetic chemical alternatives will constrain the levulinic acid business. Because of the market's substantial supply and demand mismatch, end users prefer synthetic alternatives to levulinic acid. Synthetic chemical alternatives are widely available in the chemicals industry, whereas levulinic acid is a bio-based product with a low demand-supply gap in emerging economies.
R&D- Levulinic acid has long been recognized as a platform chemical. As a result, despite its tiny market size, it has received significant R&D to serve as a precursor to speciality chemicals such as fuel additives like Methyltetrahydrofuran (MTHF), pesticides like D-amino levulinic acid (DALA), Diphenolic Acid (DPA), and so on. The method for producing bio-based levulinic acid is relatively easy, with the most common way being the dehydrative treatment of biomass or carbohydrates with acid.
The regions analyzed for the market include North America, Europe, South America, Asia Pacific, the Middle East, and Africa. Asia Pacific emerged as the most significant global levulinic acid market market, with a 59.2% market revenue share in 2023.
During the forecast period, Asia Pacific levulinic acid is expected to expand. Population growth, industrial expansion, and increased urbanization drive market growth. The pharmaceutical, agricultural, and personal care industries have increased their demand for levulinic acid. The region has seen an increase in knowledge about the use of sustainable and environmentally friendly products. Environmental concerns and supportive government restrictions drive market growth even further. Implementing efforts and programmes to reduce reliance on fossil fuels has increased the demand for levulinic acid in various industries. Greater demand from the transportation industry and increased application in agrochemicals have fueled regional market expansion.
Asia Pacific Region Levulinic Acid Market Share in 2023 - 59.2%
www.thebrainyinsights.com
Check the geographical analysis of this market by requesting a free sample
The technology segment is divided into biofine and acid hydrolysis. The acid hydrolysis segment dominated the market, with a market share of around 57.3% in 2023. The most significant share is ascribed to an increase in waste treatment. Acid hydrolysis is processing biomass or waste material with an acid, such as sulfuric acid, under high temperature and pressure. This degrades the cellulose or hemicellulose into its constituent sugars, which can then be processed further to yield levulinic acid.
The end-user industry segment is divided into cosmetics and personal care, pharmaceuticals, agrochemicals, polymers and plasticizers, fuel & fuel additives, flavors & fragrances, and others. The cosmetics & personal care segment dominated the market, with a market share of around 29.2% in 2023. Water dissolves levulinic acid and its salts (most notably sodium levulinate). Because it has been approved by the US Food and Drug Administration (FDA), it is extensively utilized in cosmetics and personal care products. Furthermore, the rules governing cosmetic products in the European Union do not restrict the use of these components. According to the FDA's Voluntary Cosmetic Registration Programme (VCRP) survey data, levulinic acid is used in approximately 130 cosmetic formulations, while sodium levulinate is used in approximately 400 cosmetic formulations; levulinic acid has a maximum concentration of around 4.5% in hair dyes, while sodium levulinate is used at a maximum concentration of 0.62% in mouthwashes and breath fresheners.
| Attribute | Description |
|---|---|
| Market Size | Revenue (USD Million) |
| Market size value in 2023 | USD 92.23 Million |
| Market size value in 2033 | USD 208.52 Million |
| CAGR (2024 to 2033) | 8.5% |
| Historical data | 2020-2022 |
| Base Year | 2023 |
| Forecast | 2024-2033 |
| Region | The regions analyzed for the market are Asia Pacific, Europe, South America, North America, and Middle East & Africa. Furthermore, the regions are further analyzed at the country level. |
| Segments | Technology, End-User Industry |
As per The Brainy Insights, the size of the levulinic acid market was valued at USD 92.23 million in 2023 to USD 208.52 million by 2033.
The global levulinic acid market is growing at a CAGR of 8.5% during the forecast period 2024-2033.
Asia Pacific emerged as the largest levulinic acid market.
1. Introduction
1.1. Objectives of the Study
1.2. Market Definition
1.3. Research Scope
1.4. Currency
1.5. Key Target Audience
2. Research Methodology and Assumptions
3. Executive Summary
4. Premium Insights
4.1. Porter’s Five Forces Analysis
4.2. Value Chain Analysis
4.3. Top Investment Pockets
4.3.1. Market Attractiveness Analysis by Technology
4.3.2. Market Attractiveness Analysis by End-User Industry
4.3.3. Market Attractiveness Analysis by Region
4.4. Industry Trends
5. Market Dynamics
5.1. Market Evaluation
5.2. Drivers
5.2.1. Rising environmental concerns
5.3. Restraints
5.3.1. High cost
5.4. Opportunities
5.4.1. R&D
5.5. Challenges
5.5.1. Alternatives
6. Global Levulinic Acid Market Analysis and Forecast, By Technology
6.1. Segment Overview
6.2. Biofine
6.3. Acid Hydrolysis
7. Global Levulinic Acid Market Analysis and Forecast, By End-User Industry
7.1. Segment Overview
7.2. Cosmetics & Personal Care
7.3. Pharmaceuticals
7.4. Agrochemicals
7.5. Polymers and Plasticizers
7.6. Fuel & Fuel Additives
7.7. Flavors & Fragrances
7.8. Others
8. Global Levulinic Acid Market Analysis and Forecast, By Regional Analysis
8.1. Segment Overview
8.2. North America
8.2.1. U.S.
8.2.2. Canada
8.2.3. Mexico
8.3. Europe
8.3.1. Germany
8.3.2. France
8.3.3. U.K.
8.3.4. Italy
8.3.5. Spain
8.4. Asia-Pacific
8.4.1. Japan
8.4.2. China
8.4.3. India
8.5. South America
8.5.1. Brazil
8.6. Middle East and Africa
8.6.1. UAE
8.6.2. South Africa
9. Global Levulinic Acid Market-Competitive Landscape
9.1. Overview
9.2. Market Share of Key Players in Global Levulinic Acid Market
9.2.1. Global Company Market Share
9.2.2. North America Company Market Share
9.2.3. Europe Company Market Share
9.2.4. APAC Company Market Share
9.3. Competitive Situations and Trends
9.3.1. Product Launches and Developments
9.3.2. Partnerships, Collaborations, and Agreements
9.3.3. Mergers & Acquisitions
9.3.4. Expansions
10. Company Profiles
10.1. Segetis
10.1.1. Business Overview
10.1.2. Company Snapshot
10.1.3. Company Market Share Analysis
10.1.4. Company Product Portfolio
10.1.5. Recent Developments
10.1.6. SWOT Analysis
10.2. Biofine Technology LLC
10.2.1. Business Overview
10.2.2. Company Snapshot
10.2.3. Company Market Share Analysis
10.2.4. Company Product Portfolio
10.2.5. Recent Developments
10.2.6. SWOT Analysis
10.3. DuPont
10.3.1. Business Overview
10.3.2. Company Snapshot
10.3.3. Company Market Share Analysis
10.3.4. Company Product Portfolio
10.3.5. Recent Developments
10.3.6. SWOT Analysis
10.4. Hebei Langfang Triple Well Chemicals Co. Ltd
10.4.1. Business Overview
10.4.2. Company Snapshot
10.4.3. Company Market Share Analysis
10.4.4. Company Product Portfolio
10.4.5. Recent Developments
10.4.6. SWOT Analysis
10.5. Hebei Shijiazhuang Worldwide Furfural & Furfuryl Alcohol Furan Resin Co. Ltd.
10.5.1. Business Overview
10.5.2. Company Snapshot
10.5.3. Company Market Share Analysis
10.5.4. Company Product Portfolio
10.5.5. Recent Developments
10.5.6. SWOT Analysis
10.6. Jiangsu Yancheng China Flavor Chemicals Co. Ltd
10.6.1. Business Overview
10.6.2. Company Snapshot
10.6.3. Company Market Share Analysis
10.6.4. Company Product Portfolio
10.6.5. Recent Developments
10.6.6. SWOT Analysis
10.7. Shijiazhuang Pharmaceutical Group Ouyi Pharmaceutical Co. Ltd
10.7.1. Business Overview
10.7.2. Company Snapshot
10.7.3. Company Market Share Analysis
10.7.4. Company Product Portfolio
10.7.5. Recent Developments
10.7.6. SWOT Analysis
10.8. Shanghai Apple Flavor & Fragrance Co. Ltd
10.8.1. Business Overview
10.8.2. Company Snapshot
10.8.3. Company Market Share Analysis
10.8.4. Company Product Portfolio
10.8.5. Recent Developments
10.8.6. SWOT Analysis
List of Table
1. Global Levulinic Acid Market, By Technology, 2020-2033 (USD Million)
2. Global Biofine, Levulinic Acid Market, By Region, 2020-2033 (USD Million)
3. Global Acid Hydrolysis, Levulinic Acid Market, By Region, 2020-2033 (USD Million)
4. Global Levulinic Acid Market, By End-User Industry, 2020-2033 (USD Million)
5. Global Cosmetics & Personal Care, Levulinic Acid Market, By Region, 2020-2033 (USD Million)
6. Global Pharmaceuticals, Levulinic Acid Market, By Region, 2020-2033 (USD Million)
7. Global Agrochemicals, Levulinic Acid Market, By Region, 2020-2033 (USD Million)
8. Global Polymers and Plasticizers, Levulinic Acid Market, By Region, 2020-2033 (USD Million)
9. Global Fuel & Fuel Additives, Levulinic Acid Market, By Region, 2020-2033 (USD Million)
10. Global Flavors & Fragrances, Levulinic Acid Market, By Region, 2020-2033 (USD Million)
11. Global Others, Levulinic Acid Market, By Region, 2020-2033 (USD Million)
12. North America Levulinic Acid Market, By Technology, 2020-2033 (USD Million)
13. North America Levulinic Acid Market, By End-User Industry, 2020-2033 (USD Million)
14. U.S. Levulinic Acid Market, By Technology, 2020-2033 (USD Million)
15. U.S. Levulinic Acid Market, By End-User Industry, 2020-2033 (USD Million)
16. Canada Levulinic Acid Market, By Technology, 2020-2033 (USD Million)
17. Canada Levulinic Acid Market, By End-User Industry, 2020-2033 (USD Million)
18. Mexico Levulinic Acid Market, By Technology, 2020-2033 (USD Million)
19. Mexico Levulinic Acid Market, By End-User Industry, 2020-2033 (USD Million)
20. Europe Levulinic Acid Market, By Technology, 2020-2033 (USD Million)
21. Europe Levulinic Acid Market, By End-User Industry, 2020-2033 (USD Million)
22. Germany Levulinic Acid Market, By Technology, 2020-2033 (USD Million)
23. Germany Levulinic Acid Market, By End-User Industry, 2020-2033 (USD Million)
24. France Levulinic Acid Market, By Technology, 2020-2033 (USD Million)
25. France Levulinic Acid Market, By End-User Industry, 2020-2033 (USD Million)
26. U.K. Levulinic Acid Market, By Technology, 2020-2033 (USD Million)
27. U.K. Levulinic Acid Market, By End-User Industry, 2020-2033 (USD Million)
28. Italy Levulinic Acid Market, By Technology, 2020-2033 (USD Million)
29. Italy Levulinic Acid Market, By End-User Industry, 2020-2033 (USD Million)
30. Spain Levulinic Acid Market, By Technology, 2020-2033 (USD Million)
31. Spain Levulinic Acid Market, By End-User Industry, 2020-2033 (USD Million)
32. Asia Pacific Levulinic Acid Market, By Technology, 2020-2033 (USD Million)
33. Asia Pacific Levulinic Acid Market, By End-User Industry, 2020-2033 (USD Million)
34. Japan Levulinic Acid Market, By Technology, 2020-2033 (USD Million)
35. Japan Levulinic Acid Market, By End-User Industry, 2020-2033 (USD Million)
36. China Levulinic Acid Market, By Technology, 2020-2033 (USD Million)
37. China Levulinic Acid Market, By End-User Industry, 2020-2033 (USD Million)
38. India Levulinic Acid Market, By Technology, 2020-2033 (USD Million)
39. India Levulinic Acid Market, By End-User Industry, 2020-2033 (USD Million)
40. South America Levulinic Acid Market, By Technology, 2020-2033 (USD Million)
41. South America Levulinic Acid Market, By End-User Industry, 2020-2033 (USD Million)
42. Brazil Levulinic Acid Market, By Technology, 2020-2033 (USD Million)
43. Brazil Levulinic Acid Market, By End-User Industry, 2020-2033 (USD Million)
44. Middle East and Africa Levulinic Acid Market, By Technology, 2020-2033 (USD Million)
45. Middle East and Africa Levulinic Acid Market, By End-User Industry, 2020-2033 (USD Million)
46. UAE Levulinic Acid Market, By Technology, 2020-2033 (USD Million)
47. UAE Levulinic Acid Market, By End-User Industry, 2020-2033 (USD Million)
48. South Africa Levulinic Acid Market, By Technology, 2020-2033 (USD Million)
49. South Africa Levulinic Acid Market, By End-User Industry, 2020-2033 (USD Million)
List of Figures
1. Global Levulinic Acid Market Segmentation
2. Global Levulinic Acid Market: Research Methodology
3. Market Size Estimation Methodology: Bottom-Up Approach
4. Market Size Estimation Methodology: Top-Down Approach
5. Data Triangulation
6. Porter’s Five Forces Analysis
7. Value Chain Analysis
8. Global Levulinic Acid Market Attractiveness Analysis by Technology
9. Global Levulinic Acid Market Attractiveness Analysis by End-User Industry
10. Global Levulinic Acid Market Attractiveness Analysis by Region
11. Global Levulinic Acid Market: Dynamics
12. Global Levulinic Acid Market Share by Technology (2023 & 2033)
13. Global Levulinic Acid Market Share by End-User Industry (2023 & 2033)
14. Global Levulinic Acid Market Share by Regions (2023 & 2033)
15. Global Levulinic Acid Market Share by Company (2023)
This study forecasts global, regional, and country revenue from 2020 to 2033. The Brainy Insights has segmented the global levulinic acid market based on the below-mentioned segments:
Global Levulinic Acid Market By Technology:
Global Levulinic Acid Market By End-User Industry:
Global Levulinic Acid Market By Region:
Research has its special purpose to undertake marketing efficiently. In this competitive scenario, businesses need information across all industry verticals; the information about customer wants, market demand, competition, industry trends, distribution channels etc. This information needs to be updated regularly because businesses operate in a dynamic environment. Our organization, The Brainy Insights incorporates scientific and systematic research procedures in order to get proper market insights and industry analysis for overall business success. The analysis consists of studying the market from a miniscule level wherein we implement statistical tools which helps us in examining the data with accuracy and precision.
Our research reports feature both; quantitative and qualitative aspects for any market. Qualitative information for any market research process are fundamental because they reveal the customer needs and wants, usage and consumption for any product/service related to a specific industry. This in turn aids the marketers/investors in knowing certain perceptions of the customers. Qualitative research can enlighten about the different product concepts and designs along with unique service offering that in turn, helps define marketing problems and generate opportunities. On the other hand, quantitative research engages with the data collection process through interviews, e-mail interactions, surveys and pilot studies. Quantitative aspects for the market research are useful to validate the hypotheses generated during qualitative research method, explore empirical patterns in the data with the help of statistical tools, and finally make the market estimations.
The Brainy Insights offers comprehensive research and analysis, based on a wide assortment of factual insights gained through interviews with CXOs and global experts and secondary data from reliable sources. Our analysts and industry specialist assume vital roles in building up statistical tools and analysis models, which are used to analyse the data and arrive at accurate insights with exceedingly informative research discoveries. The data provided by our organization have proven precious to a diverse range of companies, facilitating them to address issues such as determining which products/services are the most appealing, whether or not customers use the product in the manner anticipated, the purchasing intentions of the market and many others.
Our research methodology encompasses an idyllic combination of primary and secondary initiatives. Key phases involved in this process are listed below:

The phase involves the gathering and collecting of market data and its related information with the help of different sources & research procedures.

The data procurement stage involves in data gathering and collecting through various data sources.
This stage involves in extensive research. These data sources includes:
Purchased Database: Purchased databases play a crucial role in estimating the market sizes irrespective of the domain. Our purchased database includes:
Primary Research: The Brainy Insights interacts with leading companies and experts of the concerned domain to develop the analyst team’s market understanding and expertise. It improves and substantiates every single data presented in the market reports. Primary research mainly involves in telephonic interviews, E-mail interactions and face-to-face interviews with the raw material providers, manufacturers/producers, distributors, & independent consultants. The interviews that we conduct provides valuable data on market size and industry growth trends prevailing in the market. Our organization also conducts surveys with the various industry experts in order to gain overall insights of the industry/market. For instance, in healthcare industry we conduct surveys with the pharmacists, doctors, surgeons and nurses in order to gain insights and key information of a medical product/device/equipment which the customers are going to usage. Surveys are conducted in the form of questionnaire designed by our own analyst team. Surveys plays an important role in primary research because surveys helps us to identify the key target audiences of the market. Additionally, surveys helps to identify the key target audience engaged with the market. Our survey team conducts the survey by targeting the key audience, thus gaining insights from them. Based on the perspectives of the customers, this information is utilized to formulate market strategies. Moreover, market surveys helps us to understand the current competitive situation of the industry. To be precise, our survey process typically involve with the 360 analysis of the market. This analytical process begins by identifying the prospective customers for a product or service related to the market/industry to obtain data on how a product/service could fit into customers’ lives.

Secondary Research: The secondary data sources includes information published by the on-profit organizations such as World bank, WHO, company fillings, investor presentations, annual reports, national government documents, statistical databases, blogs, articles, white papers and others. From the annual report, we analyse a company’s revenue to understand the key segment and market share of that organization in a particular region. We analyse the company websites and adopt the product mapping technique which is important for deriving the segment revenue. In the product mapping method, we select and categorize the products offered by the companies catering to domain specific market, deduce the product revenue for each of the companies so as to get overall estimation of the market size. We also source data and analyses trends based on information received from supply side and demand side intermediaries in the value chain. The supply side denotes the data gathered from supplier, distributor, wholesaler and the demand side illustrates the data gathered from the end customers for respective market domain.

The supply side for a domain specific market is analysed by:
The demand side for the market is estimated through:
In-house Library: Apart from these third-party sources, we have our in-house library of qualitative and quantitative information. Our in-house database includes market data for various industry and domains. These data are updated on regular basis as per the changing market scenario. Our library includes, historic databases, internal audit reports and archives.
Sometimes there are instances where there is no metadata or raw data available for any domain specific market. For those cases, we use our expertise to forecast and estimate the market size in order to generate comprehensive data sets. Our analyst team adopt a robust research technique in order to produce the estimates:
Data Synthesis: This stage involves the analysis & mapping of all the information obtained from the previous step. It also involves in scrutinizing the data for any discrepancy observed while data gathering related to the market. The data is collected with consideration to the heterogeneity of sources. Robust scientific techniques are in place for synthesizing disparate data sets and provide the essential contextual information that can orient market strategies. The Brainy Insights has extensive experience in data synthesis where the data passes through various stages:


Market Deduction & Formulation: The final stage comprises of assigning data points at appropriate market spaces so as to deduce feasible conclusions. Analyst perspective & subject matter expert based holistic form of market sizing coupled with industry analysis also plays a crucial role in this stage.
This stage involves in finalization of the market size and numbers that we have collected from data integration step. With data interpolation, it is made sure that there is no gap in the market data. Successful trend analysis is done by our analysts using extrapolation techniques, which provide the best possible forecasts for the market.
Data Validation & Market Feedback: Validation is the most important step in the process. Validation & re-validation via an intricately designed process helps us finalize data-points to be used for final calculations.

The Brainy Insights interacts with leading companies and experts of the concerned domain to develop the analyst team’s market understanding and expertise. It improves and substantiates every single data presented in the market reports. The data validation interview and discussion panels are typically composed of the most experienced industry members. The participants include, however, are not limited to:
Moreover, we always validate our data and findings through primary respondents from all the major regions we are working on.


Free Customization
Fortune 500 Clients
Free Yearly Update On Purchase Of Multi/Corporate License
Companies Served Till Date