- +1-315-215-1633
- sales@thebrainyinsights.com

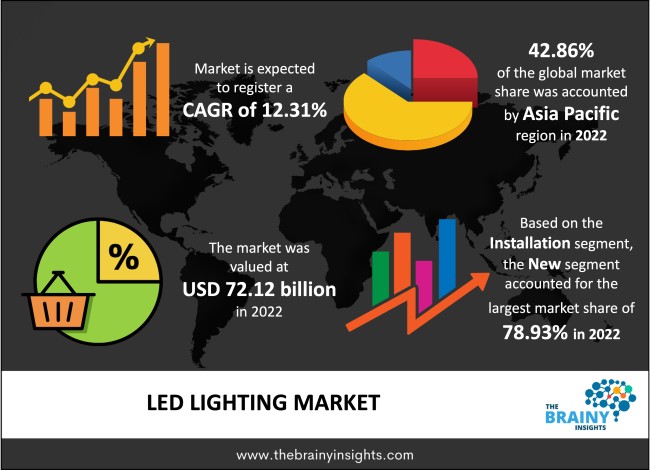
The global LED lighting market was valued at USD 72.12 Billion in 2022 and grew at a CAGR of 12.31% from 2023 to 2032. The market is expected to reach USD 230.27 Billion by 2032. The increasing use of such lights for increasing energy efficiency is driving the market growth. Further, development of commercial infrastructure is leading to the market's growth.
LED lighting devices provide light more efficiently as compared to incandescent lighting systems. Unlike other light sources like incandescent or compact fluorescent lighting, the durability of LED is defined. LEDs are used in general illumination applications by way of fixtures and bulbs. Due to their small size, these lighting provide distinctive design possibilities. Certain LED bulb alternatives resemble conventional light bulbs in terms of look. Amber, green, red and blue are common colours for LED lighting. Different coloured LEDs are blended or covered with a phosphor substance to create white light, the common white light found in houses.
Get an overview of this study by requesting a free sample
Increasing use of LED lighting in industrial and commercial applications: LED lights have unique features, and they are becoming more and more common in commercial and industrial settings. Compared to traditional light sources, LEDs are more dependable durable, and require less maintenance. Their most alluring quality is their longer lifespan, which may last between 50,000 and 100,000 hours. Many business owners have shifted to LED lighting for various places, including warehouses, offices, garages, factories, parking lots, and even healthcare facilities. LEDs work well if their installation is done correctly. Since LED lights may save up to 80% on electricity expenses compared to traditional lighting sources, many company owners have embraced them. As LED lights have intense lighting, it is simple to project spotlights to draw attention to particular products inside a display. The way the business communicates with its clients includes using light to highlight particular products and illuminate the area.
High cost of instalment: The LED lighting setup has a high capital requirement. The housing, electrical equipment such as the driver or ballast, and light engine are the initial equipment costs for a lighting system. For some applications, the cost differential between LED equipment and competing technological options might be substantial.
Investment in the construction industry: Trends in the global construction industry have rapidly evolved during the past few decades. The construction industry has grown recently for several reasons, including using higher-quality raw materials, significant improvements in construction methods, and technological innovations. Global population growth will increase demand for heavy and civil engineering and general building, even if economic factors remain important in the construction industry's global expansion. It is anticipated that a significant rise in residential and commercial construction will sustain the global market expansion for LED lighting. Furthermore, the large growth in the number of general construction projects will have an impact on the demand for LED lighting in residential as well as commercial projects.
The regions analyzed for the market include North America, Europe, South America, Asia Pacific, the Middle East, and Africa. Asia Pacific emerged as the most significant LED Lighting market, with a 42.86% market revenue share in 2022.
Asia Pacific region will account for the largest market share with revenue growth. Nations such as India, China and Japan have a tremendous demand for LED lighting due to its growing usage in commercial and industrial settings. Further, the increasing industrialization and urbanization in countries are leading to a rise in the usage of LED lighting in regional countries. Additionally, the development of energy-efficient smart lights is leading to the growth of the regional LED lighting market.
Asia-Pacific region LED Lighting Market Share in 2022 - 42.86%
www.thebrainyinsights.com
Check the geographical analysis of this market by requesting a free sample
The type segment is divided into luminaries and lamps. The luminaries segment further includes decorative, directional, downlighting and others. The lamps segment further includes t-type, a-type and others. The luminaries segment dominated the market, with a share of around 67.12% in 2022. LED luminaires are light-emitting tubes or bulbs that provide artificial light for illumination. Banks, medical facilities, and business offices are the ideal places to use commercial LED luminaires. The high-efficiency luminaires guarantee long service life and up to 60% energy savings.
The installation segment is divided into retrofit and new. The new segment dominated the market, with a share of around 78.93% in 2022. A complete fixture change can be the best course of action if the user wants to change the look of the space. Further, if the existing lighting of the space is severely damaged, then new lighting should be used.
The application segment is divided into commercial, residential and industrial. The commercial segment dominated the market, with a share of around 58.12% in 2022. Commercial locations include government buildings, offices, restaurants, shopping centres, and enterprises that employ commercial LED lighting. Compared to conventional commercial light sources, commercial LED lighting may have higher initial costs, but it is ultimately more cost-effective.
The sales channel segment is divided into direct sales, online and retail. The retail segment dominated the market, with a share of around 54.22% in 2022. In general, sales done in actual brick-and-mortar businesses are referred to as retail. These more conventional establishments might be anything from small businesses to major retail giants.
| Attribute | Description |
|---|---|
| Market Size | Revenue (USD Billion) |
| Market size value in 2022 | USD 72.12 Billion |
| Market size value in 2032 | USD 230.27 Billion |
| CAGR (2023 to 2032) | 12.31% |
| Historical data | 2019-2021 |
| Base Year | 2022 |
| Forecast | 2023-2032 |
| Region | The regions analyzed for the market are Asia Pacific, Europe, South America, North America, and Middle East & Africa. Furthermore, the regions are further analyzed at the country level. |
| Segments | Type, Installation, Application and Sales Channel |
As per The Brainy Insights, the size of the LED Lighting market was valued USD 72.12 billion in 2022 to USD 230.27 billion by 2032.
Global LED Lighting market is growing at a CAGR of 12.31% during the forecast period 2023-2032.
The market's growth will be influenced by the rising usage of LED lighting in commercial and industrial applications.
The high cost of instalment can hamper the market growth.
The rising technological advancement is providing lucrative opportunities to the market.
Key players are Cree Lighting, Acuity Brands Lighting Inc., Digital Lumens Inc., Dialight, LSI Industries Inc., Hubbell, Panasonic Corporation, LumiGrow, Signify Holding; Semiconductor Co. Ltd., Siteco GmbH, Zumtobel Group Ag among others.
1. Introduction
1.1. Objectives of the Study
1.2. Market Definition
1.3. Research Scope
1.4. Currency
1.5. Key Target Audience
2. Research Methodology and Assumptions
3. Executive Summary
4. Premium Insights
4.1. Porter’s Five Forces Analysis
4.2. Value Chain Analysis
4.3. Top Investment Pockets
4.3.1. Market Attractiveness Analysis by Type
4.3.2. Market Attractiveness Analysis by Installation
4.3.3. Market Attractiveness Analysis by Application
4.3.4. Market Attractiveness Analysis by Sales Channel
4.3.5. Market Attractiveness Analysis by Region
4.4. Industry Trends
5. Market Dynamics
5.1. Market Evaluation
5.2. Drivers
5.2.1. Increasing usage of LED lighting in different applications
5.3. Restraints
5.3.1. High instalment cost
5.4. Opportunities
5.4.1. Increasing growth of construction industry
5.5. Challenges
5.5.1. Blue light pollution
6. Global LED Lighting Market Analysis and Forecast, By Type
6.1. Segment Overview
6.2. Luminaries
6.2.1. Decorative
6.2.2. Directional
6.2.3. Downlighting
6.2.4. Others
6.3. Lamps
6.3.1. T-Type
6.3.2. A-Type
6.3.3. Others
7. Global LED Lighting Market Analysis and Forecast, By Installation
7.1. Segment Overview
7.2. Retrofit
7.3. New
8. Global LED Lighting Market Analysis and Forecast, By Application
8.1. Segment Overview
8.2. Commercial
8.3. Residential
8.4. Industrial
9. Global LED Lighting Market Analysis and Forecast, By Sales Channel
9.1. Segment Overview
9.2. Direct Sales
9.3. Online
9.4. Retail
10. Global LED Lighting Market Analysis and Forecast, By Regional Analysis
10.1. Segment Overview
10.2. North America
10.2.1. U.S.
10.2.2. Canada
10.2.3. Mexico
10.3. Europe
10.3.1. Germany
10.3.2. France
10.3.3. U.K.
10.3.4. Italy
10.3.5. Spain
10.4. Asia-Pacific
10.4.1. Japan
10.4.2. China
10.4.3. India
10.5. South America
10.5.1. Brazil
10.6. Middle East and Africa
10.6.1. UAE
10.6.2. South Africa
11. Global LED Lighting Market-Competitive Landscape
11.1. Overview
11.2. Market Share of Key Players in the LED Lighting Market
11.2.1. Global Company Market Share
11.2.2. North America Company Market Share
11.2.3. Europe Company Market Share
11.2.4. APAC Company Market Share
11.3. Competitive Situations and Trends
11.3.1. Product Launches and Developments
11.3.2. Partnerships, Collaborations, and Agreements
11.3.3. Mergers & Acquisitions
11.3.4. Expansions
12. Company Profiles
12.1. Cree Lighting
12.1.1. Business Overview
12.1.2. Company Snapshot
12.1.3. Company Market Share Analysis
12.1.4. Company Product Portfolio
12.1.5. Recent Developments
12.1.6. SWOT Analysis
12.2. Acuity Brands Lighting Inc.
12.2.1. Business Overview
12.2.2. Company Snapshot
12.2.3. Company Market Share Analysis
12.2.4. Company Product Portfolio
12.2.5. Recent Developments
12.2.6. SWOT Analysis
12.3. Digital Lumens Inc.
12.3.1. Business Overview
12.3.2. Company Snapshot
12.3.3. Company Market Share Analysis
12.3.4. Company Product Portfolio
12.3.5. Recent Developments
12.3.6. SWOT Analysis
12.4. Dialight
12.4.1. Business Overview
12.4.2. Company Snapshot
12.4.3. Company Market Share Analysis
12.4.4. Company Product Portfolio
12.4.5. Recent Developments
12.4.6. SWOT Analysis
12.5. LSI Industries Inc.
12.5.1. Business Overview
12.5.2. Company Snapshot
12.5.3. Company Market Share Analysis
12.5.4. Company Product Portfolio
12.5.5. Recent Developments
12.5.6. SWOT Analysis
12.6. Hubbell
12.6.1. Business Overview
12.6.2. Company Snapshot
12.6.3. Company Market Share Analysis
12.6.4. Company Product Portfolio
12.6.5. Recent Developments
12.6.6. SWOT Analysis
12.7. Panasonic Corporation
12.7.1. Business Overview
12.7.2. Company Snapshot
12.7.3. Company Market Share Analysis
12.7.4. Company Product Portfolio
12.7.5. Recent Developments
12.7.6. SWOT Analysis
12.8. LumiGrow
12.8.1. Business Overview
12.8.2. Company Snapshot
12.8.3. Company Market Share Analysis
12.8.4. Company Product Portfolio
12.8.5. Recent Developments
12.8.6. SWOT Analysis
12.9. Signify Holding
12.9.1. Business Overview
12.9.2. Company Snapshot
12.9.3. Company Market Share Analysis
12.9.4. Company Product Portfolio
12.9.5. Recent Developments
12.9.6. SWOT Analysis
12.10. Semiconductor Co. Ltd.
12.10.1. Business Overview
12.10.2. Company Snapshot
12.10.3. Company Market Share Analysis
12.10.4. Company Product Portfolio
12.10.5. Recent Developments
12.10.6. SWOT Analysis
12.11. Siteco GmbH
12.11.1. Business Overview
12.11.2. Company Snapshot
12.11.3. Company Market Share Analysis
12.11.4. Company Product Portfolio
12.11.5. Recent Developments
12.11.6. SWOT Analysis
12.12. Zumtobel Group Ag
12.12.1. Business Overview
12.12.2. Company Snapshot
12.12.3. Company Market Share Analysis
12.12.4. Company Product Portfolio
12.12.5. Recent Developments
12.12.6. SWOT Analysis
List of Table
1. Global LED Lighting Market, By Type, 2019-2032 (USD Billion)
2. Global Luminaries, LED Lighting Market, By Region, 2019-2032 (USD Billion)
3. Global Lamps, LED Lighting Market, By Region, 2019-2032 (USD Billion)
4. Global LED Lighting Market, By Installation, 2019-2032 (USD Billion)
5. Global Retrofit, LED Lighting Market, By Region, 2019-2032 (USD Billion)
6. Global New, LED Lighting Market, By Region, 2019-2032 (USD Billion)
7. Global LED Lighting Market, By Application, 2019-2032 (USD Billion)
8. Global Commercial, LED Lighting Market, By Region, 2019-2032 (USD Billion)
9. Global Residential, LED Lighting Market, By Region, 2019-2032 (USD Billion)
10. Global Industrial, LED Lighting Market, By Region, 2019-2032 (USD Billion)
11. Global LED Lighting Market, By Sales Channel, 2019-2032 (USD Billion)
12. Global Direct Sales, LED Lighting Market, By Region, 2019-2032 (USD Billion)
13. Global Online, LED Lighting Market, By Region, 2019-2032 (USD Billion)
14. Global Retail, LED Lighting Market, By Region, 2019-2032 (USD Billion)
15. Global LED Lighting Market, By Region, 2019-2032 (USD Billion)
16. North America LED Lighting Market, By Type, 2019-2032 (USD Billion)
17. North America LED Lighting Market, By Installation, 2019-2032 (USD Billion)
18. North America LED Lighting Market, By Application, 2019-2032 (USD Billion)
19. North America LED Lighting Market, By Sales Channel, 2019-2032 (USD Billion)
20. U.S. LED Lighting Market, By Type, 2019-2032 (USD Billion)
21. U.S. LED Lighting Market, By Installation, 2019-2032 (USD Billion)
22. U.S. LED Lighting Market, By Application, 2019-2032 (USD Billion)
23. U.S. LED Lighting Market, By Sales Channel, 2019-2032 (USD Billion)
24. Canada LED Lighting Market, By Type, 2019-2032 (USD Billion)
25. Canada LED Lighting Market, By Installation, 2019-2032 (USD Billion)
26. Canada LED Lighting Market, By Application, 2019-2032 (USD Billion)
27. Canada LED Lighting Market, By Sales Channel, 2019-2032 (USD Billion)
28. Mexico LED Lighting Market, By Type, 2019-2032 (USD Billion)
29. Mexico LED Lighting Market, By Installation, 2019-2032 (USD Billion)
30. Mexico LED Lighting Market, By Application, 2019-2032 (USD Billion)
31. Mexico LED Lighting Market, By Sales Channel, 2019-2032 (USD Billion)
32. Europe LED Lighting Market, By Type, 2019-2032 (USD Billion)
33. Europe LED Lighting Market, By Installation, 2019-2032 (USD Billion)
34. Europe LED Lighting Market, By Application, 2019-2032 (USD Billion)
35. Europe LED Lighting Market, By Sales Channel, 2019-2032 (USD Billion)
36. Germany LED Lighting Market, By Type, 2019-2032 (USD Billion)
37. Germany LED Lighting Market, By Installation, 2019-2032 (USD Billion)
38. Germany LED Lighting Market, By Application, 2019-2032 (USD Billion)
39. Germany LED Lighting Market, By Sales Channel, 2019-2032 (USD Billion)
40. France LED Lighting Market, By Type, 2019-2032 (USD Billion)
41. France LED Lighting Market, By Installation, 2019-2032 (USD Billion)
42. France LED Lighting Market, By Application, 2019-2032 (USD Billion)
43. France LED Lighting Market, By Sales Channel, 2019-2032 (USD Billion)
44. U.K. LED Lighting Market, By Type, 2019-2032 (USD Billion)
45. U.K. LED Lighting Market, By Installation, 2019-2032 (USD Billion)
46. U.K. LED Lighting Market, By Application, 2019-2032 (USD Billion)
47. U.K. LED Lighting Market, By Sales Channel, 2019-2032 (USD Billion)
48. Italy LED Lighting Market, By Type, 2019-2032 (USD Billion)
49. Italy LED Lighting Market, By Installation, 2019-2032 (USD Billion)
50. Italy LED Lighting Market, By Application, 2019-2032 (USD Billion)
51. Italy LED Lighting Market, By Sales Channel, 2019-2032 (USD Billion)
52. Spain LED Lighting Market, By Type, 2019-2032 (USD Billion)
53. Spain LED Lighting Market, By Installation, 2019-2032 (USD Billion)
54. Spain LED Lighting Market, By Application, 2019-2032 (USD Billion)
55. Spain LED Lighting Market, By Sales Channel, 2019-2032 (USD Billion)
56. Asia Pacific LED Lighting Market, By Type, 2019-2032 (USD Billion)
57. Asia Pacific LED Lighting Market, By Installation, 2019-2032 (USD Billion)
58. Asia Pacific LED Lighting Market, By Application, 2019-2032 (USD Billion)
59. Asia Pacific LED Lighting Market, By Sales Channel, 2019-2032 (USD Billion)
60. Japan LED Lighting Market, By Type, 2019-2032 (USD Billion)
61. Japan LED Lighting Market, By Installation, 2019-2032 (USD Billion)
62. Japan LED Lighting Market, By Application, 2019-2032 (USD Billion)
63. Japan LED Lighting Market, By Sales Channel, 2019-2032 (USD Billion)
64. China LED Lighting Market, By Type, 2019-2032 (USD Billion)
65. China LED Lighting Market, By Installation, 2019-2032 (USD Billion)
66. China LED Lighting Market, By Application, 2019-2032 (USD Billion)
67. China LED Lighting Market, By Sales Channel, 2019-2032 (USD Billion)
68. India LED Lighting Market, By Type, 2019-2032 (USD Billion)
69. India LED Lighting Market, By Installation, 2019-2032 (USD Billion)
70. India LED Lighting Market, By Application, 2019-2032 (USD Billion)
71. India LED Lighting Market, By Sales Channel, 2019-2032 (USD Billion)
72. South America LED Lighting Market, By Type, 2019-2032 (USD Billion)
73. South America LED Lighting Market, By Installation, 2019-2032 (USD Billion)
74. South America LED Lighting Market, By Application, 2019-2032 (USD Billion)
75. South America LED Lighting Market, By Sales Channel, 2019-2032 (USD Billion)
76. Brazil LED Lighting Market, By Type, 2019-2032 (USD Billion)
77. Brazil LED Lighting Market, By Installation, 2019-2032 (USD Billion)
78. Brazil LED Lighting Market, By Application, 2019-2032 (USD Billion)
79. BrazilLED Lighting Market, By Sales Channel, 2019-2032 (USD Billion)
80. Middle East and Africa LED Lighting Market, By Type, 2019-2032 (USD Billion)
81. Middle East and Africa LED Lighting Market, By Installation, 2019-2032 (USD Billion)
82. Middle East and Africa LED Lighting Market, By Application, 2019-2032 (USD Billion)
83. Middle East and Africa LED Lighting Market, By Sales Channel, 2019-2032 (USD Billion)
84. UAE LED Lighting Market, By Type, 2019-2032 (USD Billion)
85. UAE LED Lighting Market, By Installation, 2019-2032 (USD Billion)
86. UAE LED Lighting Market, By Application, 2019-2032 (USD Billion)
87. UAE LED Lighting Market, By Sales Channel, 2019-2032 (USD Billion)
88. South Africa LED Lighting Market, By Type, 2019-2032 (USD Billion)
89. South Africa LED Lighting Market, By Installation, 2019-2032 (USD Billion)
90. South Africa LED Lighting Market, By Application, 2019-2032 (USD Billion)
91. South Africa LED Lighting Market, By Sales Channel, 2019-2032 (USD Billion)
List of Figures
1. Global LED Lighting Market Segmentation
2. LED Lighting Market: Research Methodology
3. Market Size Estimation Methodology: Bottom-Up Approach
4. Market Size Estimation Methodology: Top-Down Approach
5. Data Triangulation
6. Porter’s Five Forces Analysis
7. Value Chain Analysis
8. Global LED Lighting Market Attractiveness Analysis by Type
9. Global LED Lighting Market Attractiveness Analysis by Installation
10. Global LED Lighting Market Attractiveness Analysis by Application
11. Global LED Lighting Market Attractiveness Analysis by Sales Channel
12. Global LED Lighting Market Attractiveness Analysis by Region
13. Global LED Lighting Market: Dynamics
14. Global LED Lighting Market Share by Type (2022 & 2032)
15. Global LED Lighting Market Share by Installation (2022 & 2032)
16. Global LED Lighting Market Share by Application (2022 & 2032)
17. Global LED Lighting Market Share by Sales Channel (2022 & 2032)
18. Global LED Lighting Market Share by Regions (2022 & 2032)
19. Global LED Lighting Market Share by Company (2022)
This study forecasts revenue at global, regional, and country levels from 2019 to 2032. The Brainy Insights has segmented the global LED lighting market based on below mentioned segments:
Global LED Lighting Market by Type:
Global LED Lighting Market by Installation:
Global LED Lighting Market by Application:
Global LED Lighting Market by Sales Channel:
Global LED Lighting Market by Region:
Research has its special purpose to undertake marketing efficiently. In this competitive scenario, businesses need information across all industry verticals; the information about customer wants, market demand, competition, industry trends, distribution channels etc. This information needs to be updated regularly because businesses operate in a dynamic environment. Our organization, The Brainy Insights incorporates scientific and systematic research procedures in order to get proper market insights and industry analysis for overall business success. The analysis consists of studying the market from a miniscule level wherein we implement statistical tools which helps us in examining the data with accuracy and precision.
Our research reports feature both; quantitative and qualitative aspects for any market. Qualitative information for any market research process are fundamental because they reveal the customer needs and wants, usage and consumption for any product/service related to a specific industry. This in turn aids the marketers/investors in knowing certain perceptions of the customers. Qualitative research can enlighten about the different product concepts and designs along with unique service offering that in turn, helps define marketing problems and generate opportunities. On the other hand, quantitative research engages with the data collection process through interviews, e-mail interactions, surveys and pilot studies. Quantitative aspects for the market research are useful to validate the hypotheses generated during qualitative research method, explore empirical patterns in the data with the help of statistical tools, and finally make the market estimations.
The Brainy Insights offers comprehensive research and analysis, based on a wide assortment of factual insights gained through interviews with CXOs and global experts and secondary data from reliable sources. Our analysts and industry specialist assume vital roles in building up statistical tools and analysis models, which are used to analyse the data and arrive at accurate insights with exceedingly informative research discoveries. The data provided by our organization have proven precious to a diverse range of companies, facilitating them to address issues such as determining which products/services are the most appealing, whether or not customers use the product in the manner anticipated, the purchasing intentions of the market and many others.
Our research methodology encompasses an idyllic combination of primary and secondary initiatives. Key phases involved in this process are listed below:

The phase involves the gathering and collecting of market data and its related information with the help of different sources & research procedures.

The data procurement stage involves in data gathering and collecting through various data sources.
This stage involves in extensive research. These data sources includes:
Purchased Database: Purchased databases play a crucial role in estimating the market sizes irrespective of the domain. Our purchased database includes:
Primary Research: The Brainy Insights interacts with leading companies and experts of the concerned domain to develop the analyst team’s market understanding and expertise. It improves and substantiates every single data presented in the market reports. Primary research mainly involves in telephonic interviews, E-mail interactions and face-to-face interviews with the raw material providers, manufacturers/producers, distributors, & independent consultants. The interviews that we conduct provides valuable data on market size and industry growth trends prevailing in the market. Our organization also conducts surveys with the various industry experts in order to gain overall insights of the industry/market. For instance, in healthcare industry we conduct surveys with the pharmacists, doctors, surgeons and nurses in order to gain insights and key information of a medical product/device/equipment which the customers are going to usage. Surveys are conducted in the form of questionnaire designed by our own analyst team. Surveys plays an important role in primary research because surveys helps us to identify the key target audiences of the market. Additionally, surveys helps to identify the key target audience engaged with the market. Our survey team conducts the survey by targeting the key audience, thus gaining insights from them. Based on the perspectives of the customers, this information is utilized to formulate market strategies. Moreover, market surveys helps us to understand the current competitive situation of the industry. To be precise, our survey process typically involve with the 360 analysis of the market. This analytical process begins by identifying the prospective customers for a product or service related to the market/industry to obtain data on how a product/service could fit into customers’ lives.

Secondary Research: The secondary data sources includes information published by the on-profit organizations such as World bank, WHO, company fillings, investor presentations, annual reports, national government documents, statistical databases, blogs, articles, white papers and others. From the annual report, we analyse a company’s revenue to understand the key segment and market share of that organization in a particular region. We analyse the company websites and adopt the product mapping technique which is important for deriving the segment revenue. In the product mapping method, we select and categorize the products offered by the companies catering to domain specific market, deduce the product revenue for each of the companies so as to get overall estimation of the market size. We also source data and analyses trends based on information received from supply side and demand side intermediaries in the value chain. The supply side denotes the data gathered from supplier, distributor, wholesaler and the demand side illustrates the data gathered from the end customers for respective market domain.

The supply side for a domain specific market is analysed by:
The demand side for the market is estimated through:
In-house Library: Apart from these third-party sources, we have our in-house library of qualitative and quantitative information. Our in-house database includes market data for various industry and domains. These data are updated on regular basis as per the changing market scenario. Our library includes, historic databases, internal audit reports and archives.
Sometimes there are instances where there is no metadata or raw data available for any domain specific market. For those cases, we use our expertise to forecast and estimate the market size in order to generate comprehensive data sets. Our analyst team adopt a robust research technique in order to produce the estimates:
Data Synthesis: This stage involves the analysis & mapping of all the information obtained from the previous step. It also involves in scrutinizing the data for any discrepancy observed while data gathering related to the market. The data is collected with consideration to the heterogeneity of sources. Robust scientific techniques are in place for synthesizing disparate data sets and provide the essential contextual information that can orient market strategies. The Brainy Insights has extensive experience in data synthesis where the data passes through various stages:


Market Deduction & Formulation: The final stage comprises of assigning data points at appropriate market spaces so as to deduce feasible conclusions. Analyst perspective & subject matter expert based holistic form of market sizing coupled with industry analysis also plays a crucial role in this stage.
This stage involves in finalization of the market size and numbers that we have collected from data integration step. With data interpolation, it is made sure that there is no gap in the market data. Successful trend analysis is done by our analysts using extrapolation techniques, which provide the best possible forecasts for the market.
Data Validation & Market Feedback: Validation is the most important step in the process. Validation & re-validation via an intricately designed process helps us finalize data-points to be used for final calculations.

The Brainy Insights interacts with leading companies and experts of the concerned domain to develop the analyst team’s market understanding and expertise. It improves and substantiates every single data presented in the market reports. The data validation interview and discussion panels are typically composed of the most experienced industry members. The participants include, however, are not limited to:
Moreover, we always validate our data and findings through primary respondents from all the major regions we are working on.


Free Customization
Fortune 500 Clients
Free Yearly Update On Purchase Of Multi/Corporate License
Companies Served Till Date