- +1-315-215-1633
- sales@thebrainyinsights.com

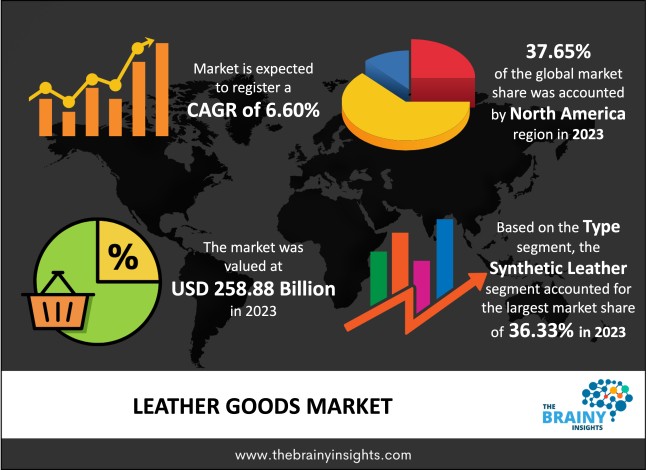
The global leather goods market was valued at USD 258.88 billion in 2023 and is anticipated to grow at a CAGR of 6.60% from 2024 to 2033. The global leather goods market is expected to reach USD 490.53 billion by 2033. The market is broadly growing due to several factors, such as an increase in disposable income, better living standards, a surge in fashion choices, and growth in international and domestic tourism. There is a growing demand for footwear, luxurious leather apparel, and accessories. Asia-Pacific is expected to grow the fastest during the forecast period.
Customers favour leather goods because of their inherent strengths, which are predicted to propel the leather goods market ahead. These strengths include being dustproof, fireproof, crack-proof, and durable. The expansion of the leather goods market has also been impacted during the past few years by the rising demand for stylish purses, high-end leather wallets, and other leather products. Government subsidies for the leather industry are accelerating market expansion. For instance, 100% FDI is permitted in India for the automated production of leather goods. Rising consumer disposable income, higher living standards, shifting fashion trends, and expanding domestic and international tourism are the primary market drivers. A favourable effect on the industry is anticipated from the expanding demand for stylish, trendy, and comfortable leather clothing, accessories, and footwear. Due to the COVID-19 outbreak, which caused premium apparel stores and outlets to close their doors and cause widespread lockdowns around the world, there was a disruption in the retail sales of leather goods products in 2020. Due to the entire lockdown, the pandemic also affected the companies' supply chain and output. For instance, in 2020, all 42 of Hermes' French production facilities were closed, except for the perfume factory, which produced hand sanitiser in the interim.
Get an overview of this study by requesting a free sample
Lifestyle Changes Occurring – Market participants have been urged to launch cutting-edge and popular items to satisfy consumer demand and preserve a devoted customer base as global fashion trends shift. Additionally, buyers want leather accessories and baggage that are both small and fashionable. Men's leather gloves, bracelets, and necklaces are becoming more and more well-liked as fashion trends change. As a result of shifting fashion trends, the industry will expand in the upcoming years.
Availability of Alternative Products – Numerous modern, eco-friendly leather substitutes are available. Pineapple leaf fibres are used to create the natural and sustainable product known as Piatex. Environmentally friendly wax is utilized in Waxed Canvas and (Organic) Cotton. Instead of employing harmful treatments or dyes, leaf "leather" is made by retaining leaves in fiber sheets. Fungus is used to create mushroom leather, which is environmentally benign and biodegradable. The skin and cores of apples are used to make apple "leather," which may be composted, and the waste products from the coconut industry are used to make coconut "leather."
Development of Fashionable Model – Belts are the second-largest merchandise category after carrying goods. Travel bags are the fastest-growing leather goods market, while handbags and wallets are the largest categories within the carrying products segment. Since customers' disposable money is rising and their way of life is changing daily, it seems sensible that they are more likely to favor fashionable goods. Based on their discretionary money, consumers are increasing the quality of their lives by buying more fashionable and contemporary goods. Therefore, these consumer tendencies will present a market opportunity for market participants.
Shortage of Leather Goods – The cost of leather is rising due to a global shortage of leather items. European consumers are searching for low-cost suppliers who produce leather from exotic creatures like pythons and alligators. For instance, according to Humane Society International, the fashion sector in Europe accounted for 96% of the market for python skin in 2016, with Italy, Spain, and France being the main importers.
The regions analyzed for the market include North America, Europe, South America, Asia Pacific, the Middle East, and Africa. North America emerged as the largest market for the global leather goods market, with a 37.65% share of the market revenue in 2023. Future market growth is anticipated to be driven by rising product demand and an increase in online sales in North America. The growing population of athletes and fitness enthusiasts is also projected to stimulate market expansion. In 2019, the United States was the largest market in the area, followed by Canada and Mexico. In North America, discount shops, factory outlets, department stores, and e-commerce websites are the main distribution channels for leather goods.
Asia-Pacific is expected to be the fastest-growing region. The Asia Pacific market is being pushed by the rising demand for premium and luxury goods, particularly in nations like China and India. In Asia, Pakistan and Bangladesh are significant suppliers of primary leather (raw material). The managing director of Leather Footwear Industries Ltd., Mohammed Nazmul Hassan, claims that 15 to 20 new factories producing leather goods and footwear are established annually in Bangladesh. Bangladesh is a desirable market for foreign leather goods brands due to the country's relatively cheap tariff rates on exported leather goods.
North America Region Leather Goods Market Share in 2023 - 37.65%
www.thebrainyinsights.com
Check the geographical analysis of this market by requesting a free sample
The type segment is divided into genuine leather, synthetic leather, and vegan leather. The synthetic leather segment dominated, with a market share of around 36.33% in 2023. Consumer desire for synthetic leather items is being fueled by the fact that they are as attractive in terms of appearance and less priced than genuine leather goods. Most synthetic leather comes from synthetic sources including polyurethane (PU) and polyvinyl chloride (PVC). Since PU leather doesn't emit dioxins like its vinyl-based predecessor, it is thought to be more environmentally friendly. The low price and robust design of various product categories are credited with the increase. Like paper, there are several eco-friendly solutions for plastic leather products. For instance, PLA maize plastic leather products offer complete product visibility for improved marketability and are compostable.
The product segment is divided into footwear, home décor, and furnishing. Over the forecast period, footwear is expected to grow at the fastest CAGR of 7.34%. Given the rising customer demand for leather athletic footwear, major athletic footwear manufacturers like Nike, New Balance, Adidas, Puma, Reebok, Allbirds, and Converse have entered the leather athletic footwear production market. As an illustration, Nike, Inc. introduced sneakers made of fly leather in 2017; this novel material was created by fusing discarded leather scraps from tanneries with a polyester blend.
| Attribute | Description |
|---|---|
| Market Size | Revenue (USD Billion) |
| Market size value in 2023 | USD 258.88 Billion |
| Market size value in 2033 | USD 490.53 Billion |
| CAGR (2024 to 2033) | 6.60% |
| Historical data | 2020-2022 |
| Base Year | 2023 |
| Forecast | 2024-2033 |
| Regional Segments |
North America, Asia Pacific, Europe, Latin America, Middle East and Africa |
| Segments | Type, Product |
As per The Brainy Insights, the size of the leather goods market was valued at USD 258.88 billion in 2023 to USD 490.53 billion by 2033.
The global leather goods market is growing at a CAGR of 6.60% during the forecast period 2024-2033.
North America emerged as the largest market for leather goods.
1. Introduction
1.1. Objectives of the Study
1.2. Market Definition
1.3. Research Scope
1.4. Currency
1.5. Key Target Audience
2. Research Methodology and Assumptions
3. Executive Summary
4. Premium Insights
4.1. Porter’s Five Forces Analysis
4.2. Value Chain Analysis
4.3. Top Investment Pockets
4.3.1. Market Attractiveness Analysis By Type
4.3.2. Market Attractiveness Analysis By Product
4.3.3. Market Attractiveness Analysis By Region
4.4. Industry Trends
5. Market Dynamics
5.1. Market Evaluation
5.2. Drivers
5.2.1. Rising awareness about healthy hearts
5.3. Restraints
5.3.1. The decreasing number of heart donors
5.4. Opportunities
5.4.1. Increasing cases of cardiac diseases
5.5. Challenges
5.5.1. Increasing demand for catheterization labs
6. Global Leather Goods Market Analysis and Forecast, By Type
6.1. Segment Overview
6.2. Genuine Leather
6.3. Synthetic Leather
6.4. Vegan Leather
7. Global Leather Goods Market Analysis and Forecast, By Product
7.1. Segment Overview
7.2. Footwear
7.3. Home Décor
7.4. Furnishing
8. Global Leather Goods Market Analysis and Forecast, By Regional Analysis
8.1. Segment Overview
8.2. North America
8.2.1. U.S.
8.2.2. Canada
8.2.3. Mexico
8.3. Europe
8.3.1. Germany
8.3.2. France
8.3.3. U.K.
8.3.4. Italy
8.3.5. Spain
8.4. Asia-Pacific
8.4.1. Japan
8.4.2. China
8.4.3. India
8.5. South America
8.5.1. Brazil
8.6. Middle East and Africa
8.6.1. UAE
8.6.2. South Africa
9. Global Leather Goods Market-Competitive Landscape
9.1. Overview
9.2. Market Share of Key Players in Global Leather Goods Market
9.2.1. Global Company Market Share
9.2.2. North America Company Market Share
9.2.3. Europe Company Market Share
9.2.4. APAC Company Market Share
9.3. Competitive Situations and Trends
9.3.1. Product Launches and Developments
9.3.2. Partnerships, Collaborations, and Agreements
9.3.3. Mergers & Acquisitions
9.3.4. Expansions
10. Company Profiles
10.1. Adidas AG
10.1.1. Business Overview
10.1.2. Company Snapshot
10.1.3. Company Market Share Analysis
10.1.4. Company Product Portfolio
10.1.5. Recent Developments
10.1.6. SWOT Analysis
10.2. Nike, Inc.
10.2.1. Business Overview
10.2.2. Company Snapshot
10.2.3. Company Market Share Analysis
10.2.4. Company Product Portfolio
10.2.5. Recent Developments
10.2.6. SWOT Analysis
10.3. Puma SE
10.3.1. Business Overview
10.3.2. Company Snapshot
10.3.3. Company Market Share Analysis
10.3.4. Company Product Portfolio
10.3.5. Recent Developments
10.3.6. SWOT Analysis
10.4. Fila, Inc.
10.4.1. Business Overview
10.4.2. Company Snapshot
10.4.3. Company Market Share Analysis
10.4.4. Company Product Portfolio
10.4.5. Recent Developments
10.4.6. SWOT Analysis
10.5. New Balance Athletics, Inc.
10.5.1. Business Overview
10.5.2. Company Snapshot
10.5.3. Company Market Share Analysis
10.5.4. Company Product Portfolio
10.5.5. Recent Developments
10.5.6. SWOT Analysis
10.6. Knoll, Inc.
10.6.1. Business Overview
10.6.2. Company Snapshot
10.6.3. Company Market Share Analysis
10.6.4. Company Product Portfolio
10.6.5. Recent Developments
10.6.6. SWOT Analysis
10.7. Samsonite International S.A.
10.7.1. Business Overview
10.7.2. Company Snapshot
10.7.3. Company Market Share Analysis
10.7.4. Company Product Portfolio
10.7.5. Recent Developments
10.7.6. SWOT Analysis
10.8. VIP Industries Ltd.
10.8.1. Business Overview
10.8.2. Company Snapshot
10.8.3. Company Market Share Analysis
10.8.4. Company Product Portfolio
10.8.5. Recent Developments
10.8.6. SWOT Analysis
10.9. Timberland LLC
10.9.1. Business Overview
10.9.2. Company Snapshot
10.9.3. Company Market Share Analysis
10.9.4. Company Product Portfolio
10.9.5. Recent Developments
10.9.6. SWOT Analysis
10.10. Johnston & Murphy
10.10.1. Business Overview
10.10.2. Company Snapshot
10.10.3. Company Market Share Analysis
10.10.4. Company Product Portfolio
10.10.5. Recent Developments
10.10.6. SWOT Analysis
List of Table
1. Global Leather Goods Market, By Type, 2020 - 2033 (USD Billion)
2. Global Genuine Leather, Leather Goods Market, By Region, 2020 - 2033 (USD Billion)
3. Global Synthetic Leather, Leather Goods Market, By Region, 2020 - 2033 (USD Billion)
4. Global Vegan Leather, Leather Goods Market, By Region, 2020 - 2033 (USD Billion)
5. Global Leather Goods Market, By Product, 2020 - 2033 (USD Billion)
6. Global Footwear, Leather Goods Market, By Region, 2020 - 2033 (USD Billion)
7. Global Home Décor, Leather Goods Market, By Region, 2020 - 2033 (USD Billion)
8. Global Furnishing, Leather Goods Market, By Region, 2020 - 2033 (USD Billion)
9. North America Leather Goods Market, By Type, 2020 - 2033 (USD Billion)
10. North America Leather Goods Market, By Product, 2020 - 2033 (USD Billion)
11. U.S. Leather Goods Market, By Type, 2020 - 2033 (USD Billion)
12. U.S. Leather Goods Market, By Product, 2020 - 2033 (USD Billion)
13. Canada Leather Goods Market, By Type, 2020 - 2033 (USD Billion)
14. Canada Leather Goods Market, By Product, 2020 - 2033 (USD Billion)
15. Mexico Leather Goods Market, By Type, 2020 - 2033 (USD Billion)
16. Mexico Leather Goods Market, By Product, 2020 - 2033 (USD Billion)
17. Europe Leather Goods Market, By Type, 2020 - 2033 (USD Billion)
18. Europe Leather Goods Market, By Product, 2020 - 2033 (USD Billion)
19. Germany Leather Goods Market, By Type, 2020 - 2033 (USD Billion)
20. Germany Leather Goods Market, By Product, 2020 - 2033 (USD Billion)
21. France Leather Goods Market, By Type, 2020 - 2033 (USD Billion)
22. France Leather Goods Market, By Product, 2020 - 2033 (USD Billion)
23. U.K. Leather Goods Market, By Type, 2020 - 2033 (USD Billion)
24. U.K. Leather Goods Market, By Product, 2020 - 2033 (USD Billion)
25. Italy Leather Goods Market, By Type, 2020 - 2033 (USD Billion)
26. Italy Leather Goods Market, By Product, 2020 - 2033 (USD Billion)
27. Spain Leather Goods Market, By Type, 2020 - 2033 (USD Billion)
28. Spain Leather Goods Market, By Product, 2020 - 2033 (USD Billion)
29. Asia Pacific Leather Goods Market, By Type, 2020 - 2033 (USD Billion)
30. Asia Pacific Leather Goods Market, By Product, 2020 - 2033 (USD Billion)
31. Japan Leather Goods Market, By Type, 2020 - 2033 (USD Billion)
32. Japan Leather Goods Market, By Product, 2020 - 2033 (USD Billion)
33. China Leather Goods Market, By Type, 2020 - 2033 (USD Billion)
34. China Leather Goods Market, By Product, 2020 - 2033 (USD Billion)
35. India Leather Goods Market, By Type, 2020 - 2033 (USD Billion)
36. India Leather Goods Market, By Product, 2020 - 2033 (USD Billion)
37. South America Leather Goods Market, By Type, 2020 - 2033 (USD Billion)
38. South America Leather Goods Market, By Product, 2020 - 2033 (USD Billion)
39. Brazil Leather Goods Market, By Type, 2020 - 2033 (USD Billion)
40. Brazil Leather Goods Market, By Product, 2020 - 2033 (USD Billion)
41. Middle East and Africa Leather Goods Market, By Type, 2020 - 2033 (USD Billion)
42. Middle East and Africa Leather Goods Market, By Product, 2020 - 2033 (USD Billion)
43. UAE Leather Goods Market, By Type, 2020 - 2033 (USD Billion)
44. UAE Leather Goods Market, By Product, 2020 - 2033 (USD Billion)
45. South Africa Leather Goods Market, By Type, 2020 - 2033 (USD Billion)
46. South Africa Leather Goods Market, By Product, 2020 - 2033 (USD Billion)
List of Figures
1. Global Leather Goods Market Segmentation
2. Global Leather Goods Market: Research Methodology
3. Market Size Estimation Methodology: Bottom-Up Approach
4. Market Size Estimation Methodology: Top-Down Approach
5. Data Triangulation
6. Porter’s Five Forces Analysis
7. Value Chain Analysis
8. Global Leather Goods Market Attractiveness Analysis By Type
9. Global Leather Goods Market Attractiveness Analysis By Product
10. Global Leather Goods Market Attractiveness Analysis By Region
11. Global Leather Goods Market: Dynamics
12. Global Leather Goods Market Share By Type (2023 & 2033)
13. Global Leather Goods Market Share By Product (2023 & 2033)
14. Global Leather Goods Market Share By Regions (2023 & 2033)
15. Global Leather Goods Market Share By Company (2023)
This study forecasts global, regional, and country revenue from 2020 to 2033. Brainy Insights has segmented the global leather goods market based on the below-mentioned segments:
Global Leather Goods Market by Type:
Global Leather Goods Market by Product:
Global Leather Goods Market by Region:
Research has its special purpose to undertake marketing efficiently. In this competitive scenario, businesses need information across all industry verticals; the information about customer wants, market demand, competition, industry trends, distribution channels etc. This information needs to be updated regularly because businesses operate in a dynamic environment. Our organization, The Brainy Insights incorporates scientific and systematic research procedures in order to get proper market insights and industry analysis for overall business success. The analysis consists of studying the market from a miniscule level wherein we implement statistical tools which helps us in examining the data with accuracy and precision.
Our research reports feature both; quantitative and qualitative aspects for any market. Qualitative information for any market research process are fundamental because they reveal the customer needs and wants, usage and consumption for any product/service related to a specific industry. This in turn aids the marketers/investors in knowing certain perceptions of the customers. Qualitative research can enlighten about the different product concepts and designs along with unique service offering that in turn, helps define marketing problems and generate opportunities. On the other hand, quantitative research engages with the data collection process through interviews, e-mail interactions, surveys and pilot studies. Quantitative aspects for the market research are useful to validate the hypotheses generated during qualitative research method, explore empirical patterns in the data with the help of statistical tools, and finally make the market estimations.
The Brainy Insights offers comprehensive research and analysis, based on a wide assortment of factual insights gained through interviews with CXOs and global experts and secondary data from reliable sources. Our analysts and industry specialist assume vital roles in building up statistical tools and analysis models, which are used to analyse the data and arrive at accurate insights with exceedingly informative research discoveries. The data provided by our organization have proven precious to a diverse range of companies, facilitating them to address issues such as determining which products/services are the most appealing, whether or not customers use the product in the manner anticipated, the purchasing intentions of the market and many others.
Our research methodology encompasses an idyllic combination of primary and secondary initiatives. Key phases involved in this process are listed below:

The phase involves the gathering and collecting of market data and its related information with the help of different sources & research procedures.

The data procurement stage involves in data gathering and collecting through various data sources.
This stage involves in extensive research. These data sources includes:
Purchased Database: Purchased databases play a crucial role in estimating the market sizes irrespective of the domain. Our purchased database includes:
Primary Research: The Brainy Insights interacts with leading companies and experts of the concerned domain to develop the analyst team’s market understanding and expertise. It improves and substantiates every single data presented in the market reports. Primary research mainly involves in telephonic interviews, E-mail interactions and face-to-face interviews with the raw material providers, manufacturers/producers, distributors, & independent consultants. The interviews that we conduct provides valuable data on market size and industry growth trends prevailing in the market. Our organization also conducts surveys with the various industry experts in order to gain overall insights of the industry/market. For instance, in healthcare industry we conduct surveys with the pharmacists, doctors, surgeons and nurses in order to gain insights and key information of a medical product/device/equipment which the customers are going to usage. Surveys are conducted in the form of questionnaire designed by our own analyst team. Surveys plays an important role in primary research because surveys helps us to identify the key target audiences of the market. Additionally, surveys helps to identify the key target audience engaged with the market. Our survey team conducts the survey by targeting the key audience, thus gaining insights from them. Based on the perspectives of the customers, this information is utilized to formulate market strategies. Moreover, market surveys helps us to understand the current competitive situation of the industry. To be precise, our survey process typically involve with the 360 analysis of the market. This analytical process begins by identifying the prospective customers for a product or service related to the market/industry to obtain data on how a product/service could fit into customers’ lives.

Secondary Research: The secondary data sources includes information published by the on-profit organizations such as World bank, WHO, company fillings, investor presentations, annual reports, national government documents, statistical databases, blogs, articles, white papers and others. From the annual report, we analyse a company’s revenue to understand the key segment and market share of that organization in a particular region. We analyse the company websites and adopt the product mapping technique which is important for deriving the segment revenue. In the product mapping method, we select and categorize the products offered by the companies catering to domain specific market, deduce the product revenue for each of the companies so as to get overall estimation of the market size. We also source data and analyses trends based on information received from supply side and demand side intermediaries in the value chain. The supply side denotes the data gathered from supplier, distributor, wholesaler and the demand side illustrates the data gathered from the end customers for respective market domain.

The supply side for a domain specific market is analysed by:
The demand side for the market is estimated through:
In-house Library: Apart from these third-party sources, we have our in-house library of qualitative and quantitative information. Our in-house database includes market data for various industry and domains. These data are updated on regular basis as per the changing market scenario. Our library includes, historic databases, internal audit reports and archives.
Sometimes there are instances where there is no metadata or raw data available for any domain specific market. For those cases, we use our expertise to forecast and estimate the market size in order to generate comprehensive data sets. Our analyst team adopt a robust research technique in order to produce the estimates:
Data Synthesis: This stage involves the analysis & mapping of all the information obtained from the previous step. It also involves in scrutinizing the data for any discrepancy observed while data gathering related to the market. The data is collected with consideration to the heterogeneity of sources. Robust scientific techniques are in place for synthesizing disparate data sets and provide the essential contextual information that can orient market strategies. The Brainy Insights has extensive experience in data synthesis where the data passes through various stages:


Market Deduction & Formulation: The final stage comprises of assigning data points at appropriate market spaces so as to deduce feasible conclusions. Analyst perspective & subject matter expert based holistic form of market sizing coupled with industry analysis also plays a crucial role in this stage.
This stage involves in finalization of the market size and numbers that we have collected from data integration step. With data interpolation, it is made sure that there is no gap in the market data. Successful trend analysis is done by our analysts using extrapolation techniques, which provide the best possible forecasts for the market.
Data Validation & Market Feedback: Validation is the most important step in the process. Validation & re-validation via an intricately designed process helps us finalize data-points to be used for final calculations.

The Brainy Insights interacts with leading companies and experts of the concerned domain to develop the analyst team’s market understanding and expertise. It improves and substantiates every single data presented in the market reports. The data validation interview and discussion panels are typically composed of the most experienced industry members. The participants include, however, are not limited to:
Moreover, we always validate our data and findings through primary respondents from all the major regions we are working on.


Free Customization
Fortune 500 Clients
Free Yearly Update On Purchase Of Multi/Corporate License
Companies Served Till Date