- +1-315-215-1633
- sales@thebrainyinsights.com

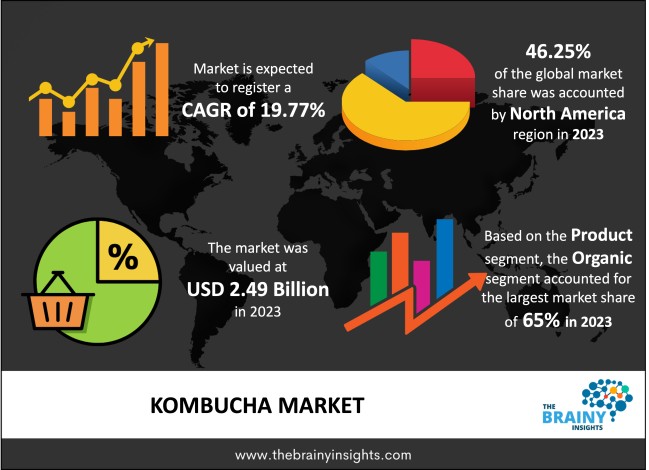
The global kombucha market is expected to grow from USD 2.49 billion in 2023 to USD 15.13 billion by 2033, at a CAGR of 19.77% during the forecast period 2024-2033.
Kombucha is a drink manufactured by fermentation of a mixture of tea and sugar with yeast, bacteria or other microbial culture. It is a health drink and is considered to be effective in the treatment of diseases like arthritis and cancer. It also stimulates the immune system, increases metabolism, and rebuilds connective tissues.
With the increase in the number of people becoming health conscious, the demand for functional and organic beverages has risen. The rising awareness amongst the people about the nutritional benefits of the drink is expected to drive the market growth. The unique flavour and taste of the organic kombucha drink has led to colossal consumer inclination towards the product. The increasing investments by the companies in product development and marketing and advertisement is also expected to contribute towards market growth.
Get an overview of this study by requesting a free sample
This study delivers a comprehensive analysis of product, type, distribution channel, and regions. On the basis of the product, the market can be divided into organic and inorganic products. The organic segment dominated the market with a share of 65% in 2023 and is expected to portray a high growth rate. This is because of the changing consumer preferences towards products with natural ingredients and clean label. The health benefits of organic products and the history of its usage is further expected to fuel the market growth. On the basis of type, the market can be divided into original and flavoured drink. The original drink segment is expected to dominate the market with a share of 69% in 2023. It is due to the long history of its usage and its health benefits. The original kombucha is known for preventing bacterial infections and promoting better digestion and immunity. The changing preferences of consumers towards low sugar drinks will also contribute to the market growth of organic beverage segment. On the basis of the distribution channel, the market can be divided into supermarkets/ hypermarkets, convenience stores, health stores, online retailers and others. The online retail segment is expected to dominate the market with a share of 31% in 2023. It is due to an increase in the number of e-commerce players and ease in shopping.
The market for kombucha has been segmented into North America, Europe, Asia-Pacific, Middle East & Africa, and South America. North America dominates the market with a share of 46.25% in 2023.It is due to an upsurge in the health and energy drinks segment. The rising obesity in the region has led to changes in consumer preferences towards non-carbonated and low-calorie drinks fuelling the market growth in the region. The Asia-Pacific region is expected to show a high growth rate with increasing number of people living in urban areas using the product. The increasing awareness among the people regarding the health benefits of the beverage and higher penetration of the organic food in the region is expected to drive the market growth.
The leading players of the market include Kombucha Wonder Drink, Live Soda Kombucha, Millennium Products, Inc., Reed’s, Inc., The Hain Celestial Group, Nesalla Kombucha, Makana Beverages Inc., Red Bull Gmbh, Revive Kombucha, Kosmic Kombucha, Townshend’s Tea Company, Cell - Nique Corporation, The Humm Kombucha, Buchi Kombucha, and Gt’s Kombucha.
Global Kombucha Market Analysis And Forecast, By Product
Global Kombucha Market Analysis And Forecast, By Type
Global Kombucha Market Analysis And Forecast, By Distribution Channel
Global Kombucha Market Analysis And Forecast, By Regional Analysis
Report Description:
As per The Brainy Insights, the size of the Kombucha market was valued at USD 2.49 Billion in 2023 & USD 15.13 Billion by 2033.
Global Kombucha market is growing at a CAGR of 19.77% during the forecast period 2024-2033.
North America region emerged as the largest market for the Kombucha.
The increase in the number of people becoming health conscious is a significant driving factor for the growth of the Kombucha market.
Other options is a significant restraining factor for the growth of the Kombucha market.
The increasing investments by the companies in product development is a significant opportunity for the growth of the Kombucha market.
1. Introduction
1.1. Objectives of the Study
1.2. Market Definition
1.3. Research Scope
1.4. Currency
1.5. Key Target Audience
2. Research Methodology and Assumptions
3. Executive Summary
4. Premium Insights
4.1. Porter’s Five Forces Analysis
4.2. Value Chain Analysis
4.3. Top Investment Pockets
4.3.1. Market Attractiveness Analysis By Product
4.3.2. Market Attractiveness Analysis By Type
4.3.3. Market Attractiveness Analysis By Distribution Channel
4.3.4. Market Attractiveness Analysis By Region
4.4. Industry Trends
5. Market Dynamics
5.1. Market Evaluation
5.2. Drivers
5.3. Restrains
5.4. Opportunities
5.5. Challenges
6. Global Kombucha Market Analysis and Forecast, By Product
6.1. Segment Overview
6.2. Organic
6.3. Inorganic
7. Global Kombucha Market Analysis and Forecast, By Type
7.1. Segment Overview
7.2. Original
7.3. Flavored
8. Global Kombucha Market Analysis and Forecast, By Distribution Channel
8.1. Segment Overview
8.2. Supermarkets/ Hypermarkets
8.3. Convenience Stores
8.4. Health Stores
8.5. Online Retailers
8.6. Others
9. Global Kombucha Market Analysis and Forecast, By Regional Analysis
9.1. Segment Overview
9.2. North America
9.2.1. U.S.
9.2.2. Canada
9.2.3. Mexico
9.3. Europe
9.3.1. Germany
9.3.2. France
9.3.3. U.K.
9.3.4. Italy
9.3.5. Spain
9.4. Asia-Pacific
9.4.1. Japan
9.4.2. China
9.4.3. India
9.5. South America
9.5.1. Brazil
9.6. Middle East and Africa
9.6.1. UAE
9.6.2. South Africa
10. Global Kombucha Market-Competitive Landscape
10.1. Overview
10.2. Market Share of Key Players in Global Kombucha Market
10.2.1. Global Company Market Share
10.2.2. North America Company Market Share
10.2.3. Europe Company Market Share
10.2.4. APAC Company Market Share
10.3. Competitive Situations and Trends
10.3.1. Product Launches and Developments
10.3.2. Partnerships, Collaborations, and Agreements
10.3.3. Mergers & Acquisitions
10.3.4. Expansions
11. Company Profiles
11.1. Kombucha Wonder Drink
11.1.1. Business Overview
11.1.2. Company Snapshot
11.1.3. Company Market Share Analysis
11.1.4. Company Product Portfolio
11.1.5. Recent Developments
11.1.6. SWOT Analysis
11.2. Live Soda Kombucha
11.2.1. Business Overview
11.2.2. Company Snapshot
11.2.3. Company Market Share Analysis
11.2.4. Company Product Portfolio
11.2.5. Recent Developments
11.2.6. SWOT Analysis
11.3. Millennium Products, Inc.
11.3.1. Business Overview
11.3.2. Company Snapshot
11.3.3. Company Market Share Analysis
11.3.4. Company Product Portfolio
11.3.5. Recent Developments
11.3.6. SWOT Analysis
11.4. Reed’s, Inc.
11.4.1. Business Overview
11.4.2. Company Snapshot
11.4.3. Company Market Share Analysis
11.4.4. Company Product Portfolio
11.4.5. Recent Developments
11.4.6. SWOT Analysis
11.5. The Hain Celestial Group
11.5.1. Business Overview
11.5.2. Company Snapshot
11.5.3. Company Market Share Analysis
11.5.4. Company Product Portfolio
11.5.5. Recent Developments
11.5.6. SWOT Analysis
11.6. Nesalla Kombucha
11.6.1. Business Overview
11.6.2. Company Snapshot
11.6.3. Company Market Share Analysis
11.6.4. Company Product Portfolio
11.6.5. Recent Developments
11.6.6. SWOT Analysis
11.7. Makana Beverages Inc.
11.7.1. Business Overview
11.7.2. Company Snapshot
11.7.3. Company Market Share Analysis
11.7.4. Company Product Portfolio
11.7.5. Recent Developments
11.7.6. SWOT Analysis
11.8. Red Bull Gmbh
11.8.1. Business Overview
11.8.2. Company Snapshot
11.8.3. Company Market Share Analysis
11.8.4. Company Product Portfolio
11.8.5. Recent Developments
11.8.6. SWOT Analysis
11.9. Revive Kombucha
11.9.1. Business Overview
11.9.2. Company Snapshot
11.9.3. Company Market Share Analysis
11.9.4. Company Product Portfolio
11.9.5. Recent Developments
11.9.6. SWOT Analysis
11.10. Kosmic Kombucha
11.10.1. Business Overview
11.10.2. Company Snapshot
11.10.3. Company Market Share Analysis
11.10.4. Company Product Portfolio
11.10.5. Recent Developments
11.10.6. SWOT Analysis
List of Table
1. Global Kombucha Market, By Product, 2020–2033 (USD Billion)(Thousand Units)
2. Global Organic Kombucha Market, By Region, 2020–2033 (USD Billion)(Thousand Units)
3. Global Inorganic Kombucha Market, By Region, 2020–2033 (USD Billion)(Thousand Units)
4. Global Kombucha Market, By Type, 2020–2033 (USD Billion)(Thousand Units)
5. Global Original, Kombucha Market, By Region, 2020–2033 (USD Billion)(Thousand Units)
6. Global Flavored, Kombucha Market, By Region, 2020–2033 (USD Billion)(Thousand Units)
7. Global Kombucha Market, By Distribution Channel, 2020–2033 (USD Billion)(Thousand Units)
8. Global Supermarkets/ Hypermarkets Kombucha Market, By Region, 2020–2033 (USD Billion)(Thousand Units)
9. Global Convenience Stores Kombucha Market, By Region, 2020–2033 (USD Billion)(Thousand Units)
10. Global Health Stores Kombucha Market, By Region, 2020–2033 (USD Billion)(Thousand Units)
11. Global Online Retailers Kombucha Market, By Region, 2020–2033 (USD Billion)(Thousand Units)
12. Global Others Kombucha Market, By Region, 2020–2033 (USD Billion)(Thousand Units)
13. Global Kombucha Market, By Region, 2020–2033 (USD Billion)(Thousand Units)
14. Global Kombucha Market, By North America, 2020–2033 (USD Billion)(Thousand Units)
15. North America Kombucha Market, By Product, 2020–2033 (USD Billion)(Thousand Units)
16. North America Kombucha Market, By Type, 2020–2033 (USD Billion)(Thousand Units)
17. North America Kombucha Market, By Distribution Channel, 2020–2033 (USD Billion)(Thousand Units)
18. U.S. Kombucha Market, By Product, 2020–2033 (USD Billion)(Thousand Units)
19. U.S. Kombucha Market, By Type, 2020–2033 (USD Billion)(Thousand Units)
20. U.S. Kombucha Market, By Distribution Channel, 2020–2033 (USD Billion)(Thousand Units)
21. Canada Kombucha Market, By Product, 2020–2033 (USD Billion)(Thousand Units)
22. Canada Kombucha Market, By Type, 2020–2033 (USD Billion)(Thousand Units)
23. Canada Kombucha Market, By Distribution Channel, 2020–2033 (USD Billion)(Thousand Units)
24. Mexico Kombucha Market, By Product, 2020–2033 (USD Billion)(Thousand Units)
25. Mexico Kombucha Market, By Type, 2020–2033 (USD Billion)(Thousand Units)
26. Mexico Kombucha Market, By Distribution Channel, 2020–2033 (USD Billion)(Thousand Units)
27. Europe Kombucha Market, By Product, 2020–2033 (USD Billion)(Thousand Units)
28. Europe Kombucha Market, By Type, 2020–2033 (USD Billion)(Thousand Units)
29. Europe Kombucha Market, By Distribution Channel, 2020–2033 (USD Billion)(Thousand Units)
30. Germany Kombucha Market, By Product, 2020–2033 (USD Billion)(Thousand Units)
31. Germany Kombucha Market, By Type, 2020–2033 (USD Billion)(Thousand Units)
32. Germany Kombucha Market, By Distribution Channel, 2020–2033 (USD Billion)(Thousand Units)
33. France Kombucha Market, By Product, 2020–2033 (USD Billion)(Thousand Units)
34. France Kombucha Market, By Type, 2020–2033 (USD Billion)(Thousand Units)
35. France Kombucha Market, By Distribution Channel, 2020–2033 (USD Billion)(Thousand Units)
36. U.K. Kombucha Market, By Product, 2020–2033 (USD Billion)(Thousand Units)
37. U.K. Kombucha Market, By Type, 2020–2033 (USD Billion)(Thousand Units)
38. U.K. Kombucha Market, By Distribution Channel, 2020–2033 (USD Billion)(Thousand Units)
39. Italy Kombucha Market, By Product, 2020–2033 (USD Billion)(Thousand Units)
40. Italy Kombucha Market, By Type, 2020–2033 (USD Billion)(Thousand Units)
41. Italy Kombucha Market, By Distribution Channel, 2016–2026(USD Billion)(Thousand Units)
42. Spain Kombucha Market, By Product, 2020–2033 (USD Billion)(Thousand Units)
43. Spain Kombucha Market, By Type, 2020–2033 (USD Billion)(Thousand Units)
44. Spain Kombucha Market, By Distribution Channel, 2020–2033 (USD Billion)(Thousand Units)
45. Asia Pacific Kombucha Market, By Product, 2020–2033 (USD Billion)(Thousand Units)
46. Asia Pacific Kombucha Market, By Type, 2020–2033 (USD Billion)(Thousand Units)
47. Asia Pacific Kombucha Market, By Distribution Channel, 2020–2033 (USD Billion)(Thousand Units)
48. Japan Kombucha Market, By Product, 2020–2033 (USD Billion)(Thousand Units)
49. Japan Kombucha Market, By Type, 2020–2033 (USD Billion)(Thousand Units)
50. Japan Kombucha Market, By Distribution Channel, 2020–2033 (USD Billion)(Thousand Units)
51. China Kombucha Market, By Product, 2020–2033 (USD Billion)(Thousand Units)
52. China Kombucha Market, By Type, 2020–2033 (USD Billion)(Thousand Units)
53. China Kombucha Market, By Distribution Channel, 2020–2033 (USD Billion)(Thousand Units)
54. India Kombucha Market, By Product, 2020–2033 (USD Billion)(Thousand Units)
55. India Kombucha Market, By Type, 2020–2033 (USD Billion)(Thousand Units)
56. India Kombucha Market, By Distribution Channel, 2020–2033 (USD Billion)(Thousand Units)
57. South America Kombucha Market, By Product, 2020–2033 (USD Billion)(Thousand Units)
58. South America Kombucha Market, By Type, 2020–2033 (USD Billion)(Thousand Units)
59. South America Kombucha Market, By Distribution Channel, 2020–2033 (USD Billion)(Thousand Units)
60. Brazil Kombucha Market, By Product, 2020–2033 (USD Billion)(Thousand Units)
61. Brazil Kombucha Market, By Type, 2020–2033 (USD Billion)(Thousand Units)
62. Brazil Kombucha Market, By Distribution Channel, 2020–2033 (USD Billion)(Thousand Units)
63. Middle East and Africa Kombucha Market, By Product, 2020–2033 (USD Billion)(Thousand Units)
64. Middle East and Africa Kombucha Market, By Type, 2020–2033 (USD Billion)(Thousand Units)
65. Middle East and Africa Kombucha Market, By Distribution Channel, 2020–2033 (USD Billion)(Thousand Units)
66. UAE Kombucha Market, By Product, 2020–2033 (USD Billion)(Thousand Units)
67. UAE Kombucha Market, By Type, 2020–2033 (USD Billion)(Thousand Units)
68. UAE Kombucha Market, By Distribution Channel, 2020–2033 (USD Billion)(Thousand Units)
69. South Africa Kombucha Market, By Product, 2020–2033 (USD Billion)(Thousand Units)
70. South Africa Kombucha Market, By Type, 2020–2033 (USD Billion)(Thousand Units)
71. South Africa Kombucha Market, By Distribution Channel, 2020–2033 (USD Billion)(Thousand Units)
List of Figures
1. Global Kombucha Market Segmentation
2. Kombucha Market: Research Methodology
3. Market Size Estimation Methodology: Bottom-Up Approach
4. Market Size Estimation Methodology: Top-Down Approach
5. Data Triangulation
6. Porter’s Five Forces Analysis
7. Value Chain Analysis
8. Global Kombucha Market Attractiveness Analysis By Product
9. Global Kombucha Market Attractiveness Analysis By Type
10. Global Kombucha Market Attractiveness Analysis By Distribution Channel
11. Global Kombucha Market Attractiveness Analysis By Region
12. Global Kombucha Market: Dynamics
13. Global Kombucha Market Share By Product (2023 & 2033)
14. Global Kombucha Market Share by Type (2023 & 2033)
15. Global Kombucha Market Share By Distribution Channel (2023 & 2033)
16. Global Kombucha Market Share by Regions (2023 & 2033)
17. Global Kombucha Market Share by Company (2023)
This study forecasts revenue at global, regional, and country levels from 2020 to 2033. The Brainy Insights has segmented the global Kombucha market based on below mentioned segments:
Global Kombucha by Product:
Global Kombucha by Type:
Global Kombucha by Distribution Channel:
Global Kombucha by Region:
Research has its special purpose to undertake marketing efficiently. In this competitive scenario, businesses need information across all industry verticals; the information about customer wants, market demand, competition, industry trends, distribution channels etc. This information needs to be updated regularly because businesses operate in a dynamic environment. Our organization, The Brainy Insights incorporates scientific and systematic research procedures in order to get proper market insights and industry analysis for overall business success. The analysis consists of studying the market from a miniscule level wherein we implement statistical tools which helps us in examining the data with accuracy and precision.
Our research reports feature both; quantitative and qualitative aspects for any market. Qualitative information for any market research process are fundamental because they reveal the customer needs and wants, usage and consumption for any product/service related to a specific industry. This in turn aids the marketers/investors in knowing certain perceptions of the customers. Qualitative research can enlighten about the different product concepts and designs along with unique service offering that in turn, helps define marketing problems and generate opportunities. On the other hand, quantitative research engages with the data collection process through interviews, e-mail interactions, surveys and pilot studies. Quantitative aspects for the market research are useful to validate the hypotheses generated during qualitative research method, explore empirical patterns in the data with the help of statistical tools, and finally make the market estimations.
The Brainy Insights offers comprehensive research and analysis, based on a wide assortment of factual insights gained through interviews with CXOs and global experts and secondary data from reliable sources. Our analysts and industry specialist assume vital roles in building up statistical tools and analysis models, which are used to analyse the data and arrive at accurate insights with exceedingly informative research discoveries. The data provided by our organization have proven precious to a diverse range of companies, facilitating them to address issues such as determining which products/services are the most appealing, whether or not customers use the product in the manner anticipated, the purchasing intentions of the market and many others.
Our research methodology encompasses an idyllic combination of primary and secondary initiatives. Key phases involved in this process are listed below:

The phase involves the gathering and collecting of market data and its related information with the help of different sources & research procedures.

The data procurement stage involves in data gathering and collecting through various data sources.
This stage involves in extensive research. These data sources includes:
Purchased Database: Purchased databases play a crucial role in estimating the market sizes irrespective of the domain. Our purchased database includes:
Primary Research: The Brainy Insights interacts with leading companies and experts of the concerned domain to develop the analyst team’s market understanding and expertise. It improves and substantiates every single data presented in the market reports. Primary research mainly involves in telephonic interviews, E-mail interactions and face-to-face interviews with the raw material providers, manufacturers/producers, distributors, & independent consultants. The interviews that we conduct provides valuable data on market size and industry growth trends prevailing in the market. Our organization also conducts surveys with the various industry experts in order to gain overall insights of the industry/market. For instance, in healthcare industry we conduct surveys with the pharmacists, doctors, surgeons and nurses in order to gain insights and key information of a medical product/device/equipment which the customers are going to usage. Surveys are conducted in the form of questionnaire designed by our own analyst team. Surveys plays an important role in primary research because surveys helps us to identify the key target audiences of the market. Additionally, surveys helps to identify the key target audience engaged with the market. Our survey team conducts the survey by targeting the key audience, thus gaining insights from them. Based on the perspectives of the customers, this information is utilized to formulate market strategies. Moreover, market surveys helps us to understand the current competitive situation of the industry. To be precise, our survey process typically involve with the 360 analysis of the market. This analytical process begins by identifying the prospective customers for a product or service related to the market/industry to obtain data on how a product/service could fit into customers’ lives.

Secondary Research: The secondary data sources includes information published by the on-profit organizations such as World bank, WHO, company fillings, investor presentations, annual reports, national government documents, statistical databases, blogs, articles, white papers and others. From the annual report, we analyse a company’s revenue to understand the key segment and market share of that organization in a particular region. We analyse the company websites and adopt the product mapping technique which is important for deriving the segment revenue. In the product mapping method, we select and categorize the products offered by the companies catering to domain specific market, deduce the product revenue for each of the companies so as to get overall estimation of the market size. We also source data and analyses trends based on information received from supply side and demand side intermediaries in the value chain. The supply side denotes the data gathered from supplier, distributor, wholesaler and the demand side illustrates the data gathered from the end customers for respective market domain.

The supply side for a domain specific market is analysed by:
The demand side for the market is estimated through:
In-house Library: Apart from these third-party sources, we have our in-house library of qualitative and quantitative information. Our in-house database includes market data for various industry and domains. These data are updated on regular basis as per the changing market scenario. Our library includes, historic databases, internal audit reports and archives.
Sometimes there are instances where there is no metadata or raw data available for any domain specific market. For those cases, we use our expertise to forecast and estimate the market size in order to generate comprehensive data sets. Our analyst team adopt a robust research technique in order to produce the estimates:
Data Synthesis: This stage involves the analysis & mapping of all the information obtained from the previous step. It also involves in scrutinizing the data for any discrepancy observed while data gathering related to the market. The data is collected with consideration to the heterogeneity of sources. Robust scientific techniques are in place for synthesizing disparate data sets and provide the essential contextual information that can orient market strategies. The Brainy Insights has extensive experience in data synthesis where the data passes through various stages:


Market Deduction & Formulation: The final stage comprises of assigning data points at appropriate market spaces so as to deduce feasible conclusions. Analyst perspective & subject matter expert based holistic form of market sizing coupled with industry analysis also plays a crucial role in this stage.
This stage involves in finalization of the market size and numbers that we have collected from data integration step. With data interpolation, it is made sure that there is no gap in the market data. Successful trend analysis is done by our analysts using extrapolation techniques, which provide the best possible forecasts for the market.
Data Validation & Market Feedback: Validation is the most important step in the process. Validation & re-validation via an intricately designed process helps us finalize data-points to be used for final calculations.

The Brainy Insights interacts with leading companies and experts of the concerned domain to develop the analyst team’s market understanding and expertise. It improves and substantiates every single data presented in the market reports. The data validation interview and discussion panels are typically composed of the most experienced industry members. The participants include, however, are not limited to:
Moreover, we always validate our data and findings through primary respondents from all the major regions we are working on.


Free Customization
Fortune 500 Clients
Free Yearly Update On Purchase Of Multi/Corporate License
Companies Served Till Date