- +1-315-215-1633
- sales@thebrainyinsights.com

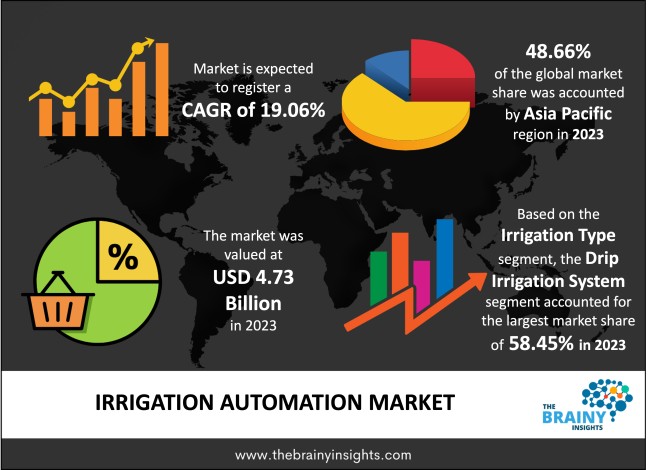
The global irrigation automation market is expected to reach USD 27.05 billion by 2033, at a CAGR of 19.06% during the forecast period 2024-2033. Increasing technological advances in the irrigation system is one of the key contributing factor for the growth global irrigation automation market. Some of the factors driving the market are a surge in the adoption of smart technologies and mechanization for agricultural work and an increase in government initiatives for promoting water conservation.
Automated irrigation refers to the operation of the system with no intervention of with the minimum intervention beside the surveillance. Every irrigation system can be automated, including drip, sprinkler, and surface. For the irrigation of automation, several components required, such as a computer, sensors, timers, and other mechanical appliances. The automation or semi-automation in the irrigation system helps to make the process more efficient. It also helps to maintain or increase crop production and also helps to reduce the overall requirement of resources such as time, labour, energy, and other resources. The primary purpose of automation in irrigation is to make any small or large field smart and more efficient.
From the past few years, with the advancement in the agriculture system, the focus on agriculture has been increased. In the past years, the irrigation system used to be dependent on traditional methods. These old methods are the primary cause for the wastage of a large number of resources. However, with recent technological advancement, there have been innovative methods for the irrigation system. The automated irrigation system helps to optimize water and energy resources. The automated irrigation can be used by the number of ways including start and stop of irrigation, to cut the flow of water, to check the moisture content, and to start and stop the pumps. The automation in the irrigation can be applied to the farm as well as gardens to optimize the use of water and other resources.
Get an overview of this study by requesting a free sample
The requirement and consumption of water, fertilizers, and other resources are very high for agriculture production. Therefore, there is an increasing need for automation in the irrigation system across the globe. The automated irrigation helps to optimize the utilization of water and energy resources. To meet the rising food demand of growing population, there is a need to increase agriculture production. Automation in the irrigation can help to achieve the growing demand for high agriculture production in minimum resources. Thus, increasing need for the automation in the irrigation system driving the growth of the market.
The emergence of smart technologies in the irrigation system is changing agriculture and landscape management. The integration of smart technologies helps to minimize the utilization of natural resources and increase the profit margin by reducing the input cost. Smart technologies help to monitor the soil condition, weather, water level, and watering schedule. Smart technologies such as the internet of things (IoT), artificial intelligence, and machine learning are being integrated into the irrigation system.
The automation of irrigation system can be expensive and requires high capital investment for the initial set up. The expensive automated irrigation system is not affordable to every farmer in the developing countries, where farmers are poor and cannot afford the expensive technologies. Thus, the high cost of the automated irrigation system may hamper the growth of the market over the forecast period.
The presence of a large number of farms and other fields across the globe is offering new growth opportunities in the market. According to the Food and Agricultural Organization, more than 60% of the world population is dependent on agriculture for survival. In addition to this, a growing number of fields such as open fields, greenhouses, non-agricultural, golf courses, lawns, and sports grounds across the globe, further offering the future opportunities for automation in irrigation in the upcoming years.
The automation in irrigation provides various benefits to optimize the resources on the farm. However, there is a lack of awareness about the automated irrigation among the farmers in the underdeveloped and developing countries. For instance, more than 70%of population in India depends on agriculture. However, there is a lack of awareness about the new technologies, results in wastage of resources. Thus, the lack of awareness about the automated irrigation in the underdeveloped and developing countries may hinder the growth of the market over the forecast period.
The global irrigation automation market has been segmented based on system, irrigation type, automation type, end use, and regions.
On the basis of geography, the global irrigation automation market include North America, Europe, South America, Asia Pacific, and the Middle East and Africa. The Asia Pacific region accounted for the major market share of 48.66% in the year 2023.
Asia Pacific Irrigation Automation Market Share in 2023 - 48.66%
www.thebrainyinsights.com
Check the geographical analysis of this market by requesting a free sample
The key players of global irrigation automation market are majorly focusing on adoption of various strategies such as new product development, joint venture, collaboration, technological integration, product innovations, mergers & acquisitions, and partnerships to gain the significant market share in the industry.
In September 2018, Jain Irrigation, Inc. announced the acquisition of ETwater, an innovator of intelligent irrigation technology and in the vanguard for creation of the smart irrigation controller, to expand their water management technology product offering.
In December 2018, Netafim announced the launch of ‘NetBeat’, a technology solution which combines the real-time data from the field with Dynamic Crop Models to personalise irrigation programmes.
As per The Brainy Insights, the size of the irrigation automation market was valued at USD 4.73 billion in 2023 to reach USD 27.05 billion by 2033.
Global irrigation automation market is growing at a CAGR of 19.06% during the forecast period 2024-2033.
The global irrigation automation market has been segmented based on system, irrigation, type, automation type, end use, and regions. The semi-automatic segment accounted for the major market share in the year 2023.
The Asia Pacific region emerged as the largest market for the irrigation automation.
Increasing adoption of irrigation automation in the developing countries is one of the key factors driving the demand for irrigation automation from the past few years.
High cost required for the adoption of irrigation automation may limit the growth of the market over the forecast period.
Presence of large number of agriculture and non-agriculture field across the globe is one of the key growth opportunities in the market.
Key players are Rain Bird, Jain Irrigation Systems, Nelson Irrigation, Hunter Industries, Netafim, Rubicon Water, The Toro Company, Weathermatic, Valmont Industries Inc., Lindsay Corporation, and Galcon among others.
1. Introduction
1.1. Objectives of the Study
1.2. Market Definition
1.3. Research Scope
1.4. Currency
1.5. Key Target Audience
2. Research Methodology and Assumptions
3. Executive Summary
4. Premium Insights
4.1. Porter’s Five Forces Analysis
4.2. Value Chain Analysis
4.3. Top Investment Pockets
4.3.1. Market Attractiveness Analysis By System
4.3.2. Market Attractiveness Analysis By Irrigation Type
4.3.3. Market Attractiveness Analysis By Automation Type
4.3.4. Market Attractiveness Analysis By End Use
4.3.5. Market Attractiveness Analysis By Region
4.4. Industry Trends
5. Market Dynamics
5.1. Market Evaluation
5.2. Drivers
5.2.1. Increasing need for the automation in the irrigation system
5.2.2. Rising adoption of smart technologies in the irrigation system
5.3. Restrains
5.3.1. Automation of irrigation system can be expensive
5.4. Opportunities
5.4.1. The presence of large number of farms and other fields across the globe
5.5. Challenges
5.5.1. Lack of awareness about the automated irrigation in the underdeveloped and developing countries
6. Global Irrigation Automation Market Analysis and Forecast, By System
6.1. Segment Overview
6.2. Automatic
6.3. Semi-Automatic
7. Global Irrigation Automation Market Analysis and Forecast, By Irrigation Type
7.1. Segment Overview
7.2. Drip Irrigation
7.3. Sprinkler Irrigation
7.4. Surface Irrigation
7.5. Others
8. Global Irrigation Automation Market Analysis and Forecast, By Automation Type
8.1. Segment Overview
8.2. Time-Based
8.3. Volume-Based
8.4. Real-Time Based
8.5. Computer-Based Control System
9. Global Irrigation Automation Market Analysis and Forecast, By End Use
9.1. Segment Overview
9.2. Agricultural
9.3. Open Fields
9.4. Greenhouses
9.5. Non-Agricultural
9.6. Golf Course
9.7. Lawns
9.8. Sports Grounds
10. Global Irrigation Automation Market Analysis and Forecast, By Regional Analysis
10.1. Segment Overview
10.2. North America
10.2.1. U.S.
10.2.2. Canada
10.2.3. Mexico
10.3. Europe
10.3.1. Germany
10.3.2. France
10.3.3. U.K.
10.3.4. Italy
10.3.5. Spain
10.4. Asia-Pacific
10.4.1. Japan
10.4.2. China
10.4.3. India
10.5. South America
10.5.1. Brazil
10.6. Middle East and Africa
10.6.1. UAE
10.6.2. South Africa
11. Global Irrigation Automation Market-Competitive Landscape
11.1. Overview
11.2. Market Share of Key Players in Global Irrigation Automation Market
11.2.1. Global Company Market Share
11.2.2. North America Company Market Share
11.2.3. Europe Company Market Share
11.2.4. APAC Company Market Share
11.3. Competitive Situations and Trends
11.3.1. Product Launches and Developments
11.3.2. Partnerships, Collaborations, and Agreements
11.3.3. Mergers & Acquisitions
11.3.4. Expansions
12. Company Profiles
12.1. Rain Bird
12.1.1. Business Overview
12.1.2. Company Snapshot
12.1.3. Company Market Share Analysis
12.1.4. Company Product Portfolio
12.1.5. Recent Developments
12.1.6. SWOT Analysis
12.2. Jain Irrigation Systems
12.2.1. Business Overview
12.2.2. Company Snapshot
12.2.3. Company Market Share Analysis
12.2.4. Company Product Portfolio
12.2.5. Recent Developments
12.2.6. SWOT Analysis
12.3. Nelson Irrigation
12.3.1. Business Overview
12.3.2. Company Snapshot
12.3.3. Company Market Share Analysis
12.3.4. Company Product Portfolio
12.3.5. Recent Developments
12.3.6. SWOT Analysis
12.4. Hunter Industries
12.4.1. Business Overview
12.4.2. Company Snapshot
12.4.3. Company Market Share Analysis
12.4.4. Company Product Portfolio
12.4.5. Recent Developments
12.4.6. SWOT Analysis
12.5. Netafim, Rubicon Water
12.5.1. Business Overview
12.5.2. Company Snapshot
12.5.3. Company Market Share Analysis
12.5.4. Company Product Portfolio
12.5.5. Recent Developments
12.5.6. SWOT Analysis
12.6. The Toro Company
12.6.1. Business Overview
12.6.2. Company Snapshot
12.6.3. Company Market Share Analysis
12.6.4. Company Product Portfolio
12.6.5. Recent Developments
12.6.6. SWOT Analysis
12.7. Weathermatic
12.7.1. Business Overview
12.7.2. Company Snapshot
12.7.3. Company Market Share Analysis
12.7.4. Company Product Portfolio
12.7.5. Recent Developments
12.7.6. SWOT Analysis
12.8. Valmont Industries Inc.
12.8.1. Business Overview
12.8.2. Company Snapshot
12.8.3. Company Market Share Analysis
12.8.4. Company Product Portfolio
12.8.5. Recent Developments
12.8.6. SWOT Analysis
12.9. Lindsay Corporation
12.9.1. Business Overview
12.9.2. Company Snapshot
12.9.3. Company Market Share Analysis
12.9.4. Company Product Portfolio
12.9.5. Recent Developments
12.9.6. SWOT Analysis
12.10. Galcon
12.10.1. Business Overview
12.10.2. Company Snapshot
12.10.3. Company Market Share Analysis
12.10.4. Company Product Portfolio
12.10.5. Recent Developments
12.10.6. SWOT Analysis
List of Table
1. Global Irrigation Automation Market, By System, 2020-2033(USD Billion)
2. Global Automatic, Irrigation Automation Market, By Region, 2020-2033(USD Billion)
3. Global Semi-Automatic, Irrigation Automation Market, By Region, 2020-2033(USD Billion)
4. Global Irrigation Automation Market, By Irrigation Type, 2020-2033(USD Billion)
5. Global Drip Irrigation, Irrigation Automation Market, By Region, 2020-2033(USD Billion)
6. Global Surface Irrigation, Irrigation Automation Market, By Region, 2020-2033(USD Billion)
7. Global Sprinkler Irrigation, Irrigation Automation Market, By Region, 2020-2033(USD Billion)
8. Global Irrigation Automation Market, By Automation Type, 2020-2033(USD Billion)
9. Global Time Based, Irrigation Automation Market, By Region, 2020-2033(USD Billion)
10. Global Volume Based, Irrigation Automation Market, By Region, 2020-2033(USD Billion)
11. Global Real Time Based, Irrigation Automation Market, By Region, 2020-2033(USD Billion)
12. Global Computer Based, Irrigation Automation Market, By Region, 2020-2033(USD Billion)
13. Global Irrigation Automation Market, By End Use, 2020-2033(USD Billion)
14. Global Agriculture Field Irrigation Automation Market, By Region, 2020-2033(USD Billion)
15. Global Open Field Irrigation Automation Market, By Region, 2020-2033(USD Billion)
16. Global Non Agriculture Field Irrigation Automation Market, By Region, 2020-2033(USD Billion)
17. Global Greenhouses Irrigation Automation Market, By Region, 2020-2033(USD Billion)
18. Global Golf Course Irrigation Automation Market, By Region, 2020-2033(USD Billion)
19. Global Lawns Irrigation Automation Market, By Region, 2020-2033(USD Billion)
20. Global Sports Ground Irrigation Automation Market, By Region, 2020-2033(USD Billion)
21. Global Irrigation Automation Market, By Region, 2020-2033(USD Billion)
22. North America Irrigation Automation Market, By System, 2020-2033(USD Billion)
23. North America Irrigation Automation Market, By Irrigation Type, 2020-2033(USD Billion)
24. North America Irrigation Automation Market, By Automation Type, 2020-2033(USD Billion)
25. North America Irrigation Automation Market, By End Use, 2020-2033(USD Billion)
26. U.S. Irrigation Automation Market, By System, 2020-2033(USD Billion)
27. U.S. Irrigation Automation Market, By Irrigation Type, 2020-2033(USD Billion)
28. U.S. Irrigation Automation Market, By Automation Type, 2020-2033(USD Billion)
29. U.S. Irrigation Automation Market, By End Use, 2020-2033(USD Billion)
30. Canada Irrigation Automation Market, By System, 2020-2033(USD Billion)
31. Canada Irrigation Automation Market, By Irrigation Type, 2020-2033(USD Billion)
32. Canada Irrigation Automation Market, By Automation Type, 2020-2033(USD Billion)
33. Canada Irrigation Automation Market, By End Use, 2020-2033(USD Billion)
34. Mexico Irrigation Automation Market, By System, 2020-2033(USD Billion)
35. Mexico Irrigation Automation Market, By Irrigation Type, 2020-2033(USD Billion)
36. Mexico Irrigation Automation Market, By Automation Type, 2020-2033(USD Billion)
37. Mexico Irrigation Automation Market, By End Use, 2020-2033(USD Billion)
38. Europe Irrigation Automation Market, By System, 2020-2033(USD Billion)
39. Europe Irrigation Automation Market, By Irrigation Type, 2020-2033(USD Billion)
40. Europe Irrigation Automation Market, By Automation Type, 2020-2033(USD Billion)
41. Europe Irrigation Automation Market, By End Use, 2020-2033(USD Billion)
42. Germany Irrigation Automation Market, By System, 2020-2033(USD Billion)
43. Germany Irrigation Automation Market, By Irrigation Type, 2020-2033(USD Billion)
44. Germany Irrigation Automation Market, By Automation Type, 2020-2033(USD Billion)
45. Germany Irrigation Automation Market, By End Use, 2020-2033(USD Billion)
46. France Irrigation Automation Market, By System, 2020-2033(USD Billion)
47. France Irrigation Automation Market, By Irrigation Type, 2020-2033(USD Billion)
48. France Irrigation Automation Market, By Automation Type, 2020-2033(USD Billion)
49. France Irrigation Automation Market, By End Use, 2020-2033(USD Billion)
50. U.K. Irrigation Automation Market, By System, 2020-2033(USD Billion)
51. U.K. Irrigation Automation Market, By Irrigation Type, 2020-2033(USD Billion)
52. U.K. Irrigation Automation Market, By Automation Type, 2020-2033(USD Billion)
53. U.K. Irrigation Automation Market, By End Use, 2020-2033(USD Billion)
54. Italy Irrigation Automation Market, By System, 2020-2033(USD Billion)
55. Italy Irrigation Automation Market, By Irrigation Type, 2020-2033(USD Billion)
56. Italy Irrigation Automation Market, By Automation Type, 2020-2033(USD Billion)
57. Italy Irrigation Automation Market, By End Use, 2020-2033(USD Billion)
58. Spain Irrigation Automation Market, By System, 2020-2033(USD Billion)
59. Spain Irrigation Automation Market, By Irrigation Type, 2020-2033(USD Billion)
60. Spain Irrigation Automation Market, By Automation Type, 2020-2033(USD Billion)
61. Spain Irrigation Automation Market, By End Use, 2020-2033(USD Billion)
62. Asia Pacific Irrigation Automation Market, By System, 2020-2033(USD Billion)
63. Asia Pacific Irrigation Automation Market, By Irrigation Type, 2020-2033(USD Billion)
64. Asia Pacific Irrigation Automation Market, By Automation Type, 2020-2033(USD Billion)
65. Asia Pacific Irrigation Automation Market, By End Use, 2020-2033(USD Billion)
66. Japan Irrigation Automation Market, By System, 2020-2033(USD Billion)
67. Japan Irrigation Automation Market, By Irrigation Type, 2020-2033(USD Billion)
68. Japan Irrigation Automation Market, By Automation Type, 2020-2033(USD Billion)
69. Japan Irrigation Automation Market, By End Use, 2020-2033(USD Billion)
70. China Irrigation Automation Market, By System, 2020-2033(USD Billion)
71. China Irrigation Automation Market, By Irrigation Type, 2020-2033(USD Billion)
72. China Irrigation Automation Market, By Automation Type, 2020-2033(USD Billion)
73. China Irrigation Automation Market, By End Use, 2020-2033(USD Billion)
74. India Irrigation Automation Market, By System, 2020-2033(USD Billion)
75. India Irrigation Automation Market, By Irrigation Type, 2020-2033(USD Billion)
76. India Irrigation Automation Market, By Automation Type, 2020-2033(USD Billion)
77. India Irrigation Automation Market, By End Use, 2020-2033(USD Billion)
78. South America Irrigation Automation Market, By System, 2020-2033(USD Billion)
79. South America Irrigation Automation Market, By Irrigation Type, 2020-2033(USD Billion)
80. South America Irrigation Automation Market, By Automation Type, 2020-2033(USD Billion)
81. South America Irrigation Automation Market, By End Use, 2020-2033(USD Billion)
82. Brazil Irrigation Automation Market, By System, 2020-2033(USD Billion)
83. Brazil Irrigation Automation Market, By Irrigation Type, 2020-2033(USD Billion)
84. Brazil Irrigation Automation Market, By Automation Type, 2020-2033(USD Billion)
85. Brazil Irrigation Automation Market, By End Use, 2020-2033(USD Billion)
86. Middle East and Africa Irrigation Automation Market, By System, 2020-2033(USD Billion)
87. Middle East and Africa Irrigation Automation Market, By Irrigation Type, 2020-2033(USD Billion)
88. Middle East and Africa Irrigation Automation Market, By Automation Type, 2020-2033(USD Billion)
89. Middle East and Africa Irrigation Automation Market, By End Use, 2020-2033(USD Billion)
90. UAE Irrigation Automation Market, By System, 2020-2033(USD Billion)
91. UAE Irrigation Automation Market, By Irrigation Type, 2020-2033(USD Billion)
92. UAE Irrigation Automation Market, By Automation Type, 2020-2033(USD Billion)
93. UAE Irrigation Automation Market, By End Use, 2020-2033(USD Billion)
94. South Africa Irrigation Automation Market, By System, 2020-2033(USD Billion)
95. South Africa Irrigation Automation Market, By Irrigation Type, 2020-2033(USD Billion)
96. South Africa Irrigation Automation Market, By Automation Type, 2020-2033(USD Billion)
97. South Africa Irrigation Automation Market, By End Use, 2020-2033(USD Billion)
List of Figures
1. Global Irrigation Automation Market Segmentation
2. Irrigation Automation Market: Research Methodology
3. Market Size Estimation Methodology: Bottom-Up Approach
4. Market Size Estimation Methodology: Top-Down Approach
5. Data Triangulation
6. Porter’s Five Forces Analysis
7. Value Chain Analysis
8. Global Irrigation Automation Market Attractiveness Analysis By System
9. Global Irrigation Automation Market Attractiveness Analysis By Irrigation Type
10. Global Irrigation Automation Market Attractiveness Analysis By Automation Type
11. Global Irrigation Automation Market Attractiveness Analysis By End Use
12. Global Irrigation Automation Market Attractiveness Analysis By Region
13. Global Irrigation Automation Market: Dynamics
14. Global Irrigation Automation Market Share By System(2023 & 2033)
15. Global Irrigation Automation Market Share By Irrigation Type(2023 & 2033)
16. Global Irrigation Automation Market Share By Automation Type(2023 & 2033)
17. Global Irrigation Automation Market Share By End Use(2023 & 2033)
18. Global Irrigation Automation Market Share by Regions (2023 & 2033)
19. Global Irrigation Automation Market Share by Company (2023)
This study forecasts revenue and volume growth at global, regional, and country levels from 2020 to 2033. The Brainy Insights has segmented the global irrigation automation market on the basis of below mentioned segments:
Global Irrigation Automation Market by System:
Global Irrigation Automation Market by Irrigation Type:
Global Irrigation Automation Market by Automation Type:
Global Irrigation Automation Market by End Use:
Global Irrigation Automation Market by Region:
Research has its special purpose to undertake marketing efficiently. In this competitive scenario, businesses need information across all industry verticals; the information about customer wants, market demand, competition, industry trends, distribution channels etc. This information needs to be updated regularly because businesses operate in a dynamic environment. Our organization, The Brainy Insights incorporates scientific and systematic research procedures in order to get proper market insights and industry analysis for overall business success. The analysis consists of studying the market from a miniscule level wherein we implement statistical tools which helps us in examining the data with accuracy and precision.
Our research reports feature both; quantitative and qualitative aspects for any market. Qualitative information for any market research process are fundamental because they reveal the customer needs and wants, usage and consumption for any product/service related to a specific industry. This in turn aids the marketers/investors in knowing certain perceptions of the customers. Qualitative research can enlighten about the different product concepts and designs along with unique service offering that in turn, helps define marketing problems and generate opportunities. On the other hand, quantitative research engages with the data collection process through interviews, e-mail interactions, surveys and pilot studies. Quantitative aspects for the market research are useful to validate the hypotheses generated during qualitative research method, explore empirical patterns in the data with the help of statistical tools, and finally make the market estimations.
The Brainy Insights offers comprehensive research and analysis, based on a wide assortment of factual insights gained through interviews with CXOs and global experts and secondary data from reliable sources. Our analysts and industry specialist assume vital roles in building up statistical tools and analysis models, which are used to analyse the data and arrive at accurate insights with exceedingly informative research discoveries. The data provided by our organization have proven precious to a diverse range of companies, facilitating them to address issues such as determining which products/services are the most appealing, whether or not customers use the product in the manner anticipated, the purchasing intentions of the market and many others.
Our research methodology encompasses an idyllic combination of primary and secondary initiatives. Key phases involved in this process are listed below:

The phase involves the gathering and collecting of market data and its related information with the help of different sources & research procedures.

The data procurement stage involves in data gathering and collecting through various data sources.
This stage involves in extensive research. These data sources includes:
Purchased Database: Purchased databases play a crucial role in estimating the market sizes irrespective of the domain. Our purchased database includes:
Primary Research: The Brainy Insights interacts with leading companies and experts of the concerned domain to develop the analyst team’s market understanding and expertise. It improves and substantiates every single data presented in the market reports. Primary research mainly involves in telephonic interviews, E-mail interactions and face-to-face interviews with the raw material providers, manufacturers/producers, distributors, & independent consultants. The interviews that we conduct provides valuable data on market size and industry growth trends prevailing in the market. Our organization also conducts surveys with the various industry experts in order to gain overall insights of the industry/market. For instance, in healthcare industry we conduct surveys with the pharmacists, doctors, surgeons and nurses in order to gain insights and key information of a medical product/device/equipment which the customers are going to usage. Surveys are conducted in the form of questionnaire designed by our own analyst team. Surveys plays an important role in primary research because surveys helps us to identify the key target audiences of the market. Additionally, surveys helps to identify the key target audience engaged with the market. Our survey team conducts the survey by targeting the key audience, thus gaining insights from them. Based on the perspectives of the customers, this information is utilized to formulate market strategies. Moreover, market surveys helps us to understand the current competitive situation of the industry. To be precise, our survey process typically involve with the 360 analysis of the market. This analytical process begins by identifying the prospective customers for a product or service related to the market/industry to obtain data on how a product/service could fit into customers’ lives.

Secondary Research: The secondary data sources includes information published by the on-profit organizations such as World bank, WHO, company fillings, investor presentations, annual reports, national government documents, statistical databases, blogs, articles, white papers and others. From the annual report, we analyse a company’s revenue to understand the key segment and market share of that organization in a particular region. We analyse the company websites and adopt the product mapping technique which is important for deriving the segment revenue. In the product mapping method, we select and categorize the products offered by the companies catering to domain specific market, deduce the product revenue for each of the companies so as to get overall estimation of the market size. We also source data and analyses trends based on information received from supply side and demand side intermediaries in the value chain. The supply side denotes the data gathered from supplier, distributor, wholesaler and the demand side illustrates the data gathered from the end customers for respective market domain.

The supply side for a domain specific market is analysed by:
The demand side for the market is estimated through:
In-house Library: Apart from these third-party sources, we have our in-house library of qualitative and quantitative information. Our in-house database includes market data for various industry and domains. These data are updated on regular basis as per the changing market scenario. Our library includes, historic databases, internal audit reports and archives.
Sometimes there are instances where there is no metadata or raw data available for any domain specific market. For those cases, we use our expertise to forecast and estimate the market size in order to generate comprehensive data sets. Our analyst team adopt a robust research technique in order to produce the estimates:
Data Synthesis: This stage involves the analysis & mapping of all the information obtained from the previous step. It also involves in scrutinizing the data for any discrepancy observed while data gathering related to the market. The data is collected with consideration to the heterogeneity of sources. Robust scientific techniques are in place for synthesizing disparate data sets and provide the essential contextual information that can orient market strategies. The Brainy Insights has extensive experience in data synthesis where the data passes through various stages:


Market Deduction & Formulation: The final stage comprises of assigning data points at appropriate market spaces so as to deduce feasible conclusions. Analyst perspective & subject matter expert based holistic form of market sizing coupled with industry analysis also plays a crucial role in this stage.
This stage involves in finalization of the market size and numbers that we have collected from data integration step. With data interpolation, it is made sure that there is no gap in the market data. Successful trend analysis is done by our analysts using extrapolation techniques, which provide the best possible forecasts for the market.
Data Validation & Market Feedback: Validation is the most important step in the process. Validation & re-validation via an intricately designed process helps us finalize data-points to be used for final calculations.

The Brainy Insights interacts with leading companies and experts of the concerned domain to develop the analyst team’s market understanding and expertise. It improves and substantiates every single data presented in the market reports. The data validation interview and discussion panels are typically composed of the most experienced industry members. The participants include, however, are not limited to:
Moreover, we always validate our data and findings through primary respondents from all the major regions we are working on.


Free Customization
Fortune 500 Clients
Free Yearly Update On Purchase Of Multi/Corporate License
Companies Served Till Date