- +1-315-215-1633
- sales@thebrainyinsights.com

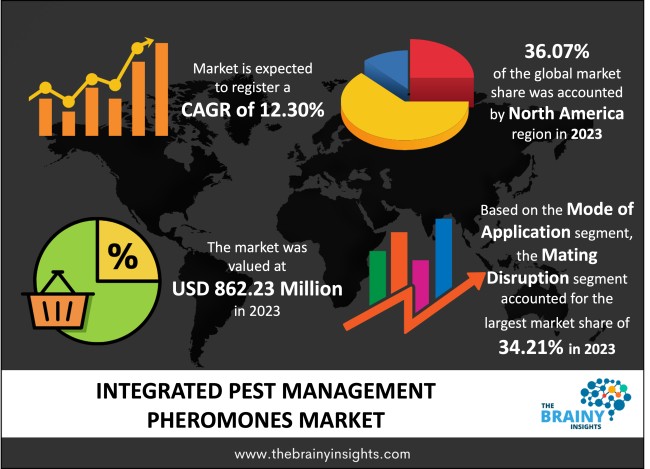
Global Integrated Pest Management Pheromones market is expected to reach USD 2,750.55 million by 2033, at a CAGR of 12.30% from 2024 to 2033. The market is projected to be driven by rising awareness about food security and worries about the harmful effects of synthetic crop protection chemicals. In comparison to pesticides, pheromones used in integrated pest management are considered environmentally friendly and clean.
Pesticide pheromones are a type of substance that is used to catch, trap, kill pesticides, primarily in agricultural settings. Insect secretions are used to communicate with and catch other pests. Integrated pest management (IPM) is a science-based, common-sense method to lowering disease vectors and public-health pest populations. Pest prevention, pest reduction, and the eradication of conditions that lead to pest infestations are all emphasized in IPM. IPM programs make use of up-to-date, comprehensive information on pest life cycles and interactions with the environment. This information is combined with various pest control methods to manage pest damage in the most cost-effective way feasible while posing the least amount of risk to people, property, and the environment. The term "integrated" refers to the process of combining two or more things. It is a collection of measures used to prevent or eliminate a pest problem. These tactics are based on knowledge from several disciplines, such as plant pathologists' disease information, agronomists' weed information, and entomologists' insect information. IPM pheromones are synthesized pheromones that closely resemble naturally released pheromones. As a result, it aids in the healthy growth of crops. Pheromones can be classed as alarm, aggregation, or sex pheromones depending on the interaction medium. Pheromones used in IPM produce an unfavorable environment for pest growth.
Get an overview of this study by requesting a free sample
In the agricultural field, there is a growing demand for pheromones. Biodegradability, non-toxic to people, long-term effect, and wide-spread coverage are some of the variables that contribute to this. These all reasons play a role in propelling the global IPM pheromones market forward. Horticulture and storage facilities are two end-use areas that help drive the global IPM pheromones market.
When compared to other pesticides, IPM pheromones have a lower penetration in growing agro-economies like India, Brazil, China, and Thailand. It's one of the biggest obstacles to market expansion. Farmers' adoption of new practices is limited by the long-term use of pesticides, as well as their successful results. Governments across the world are undertaking initiatives to educate cultivators and farmers about the advantages of IPM pheromones.
The US government is taking steps to enhance the country's agriculture sector, which is expected to increase demand for IPM pheromones. The United States Department of Agriculture (USDA) formed the Federal IPM Coordinating Committee in 2001 to provide interagency guidance on integrated pest management policies, programmes, and budgets. The United States Department of Agriculture is also launching a pest management strategy for farms, landscapes, houses, and other structures.
In the forecast period, a lack of awareness and technical competency is likely to impede market growth.
The global integrated pest management pheromones market has been segmented based on product, application, end use and regions.
The regions analyzed for the market include North America, Europe, South America, Asia Pacific, and the Middle East and Africa. North America region emerged as the largest market for the global integrated pest management pheromones market with a 36.07% share of the market revenue in 2023.
North America region Integrated Pest Management Pheromones Market Share in 2023 - 36.07%
www.thebrainyinsights.com
Check the geographical analysis of this market by requesting a free sample
The key players are now concentrating on implementing strategies such as adopting new technology, product innovations, mergers & acquisitions, joint venture, alliances, and partnerships to improve their market position in the global integrated pest management pheromones industry.
As per The Brainy Insights, the size of the integrated pest management pheromones market was valued at USD 862.23 million in 2023 to USD 2,750.55 million by 2033.
Global Integrated Pest Management Pheromones market is growing at a CAGR of 12.3% during the forecast period 2024-2033.
North America region emerged as the largest market for the Integrated Pest Management Pheromones.
The market's growth will be influenced by the increasing demand in agricultural field.
Less penetration of IPM pheromones in developing agro-economies could hamper the market growth.
Government initiatives will provide huge opportunities to the market.
Key players are Agrisense BCS Ltd, Novagrica, Shin-Etsu Chemicals, Indore Biotech Inputs and Research Pvt. Ltd., International Pheromone Systems Ltd (IPS), Russell IPM, Pheromone Chemicals, Ponalab, Trécé, Inc. and Suterra LLC.
1. Introduction
1.1. Objectives of the Study
1.2. Market Definition
1.3. Research Scope
1.4. Currency
1.5. Key Target Audience
2. Research Methodology and Assumptions
3. Executive Summary
4. Premium Insights
4.1. Porter’s Five Forces Analysis
4.2. Value Chain Analysis
4.3. Top Investment Pockets
4.3.1. Market Attractiveness Analysis By Product
4.3.2. Market Attractiveness Analysis By Mode of Application
4.3.3. Market Attractiveness Analysis By Application
4.3.4. Market Attractiveness Analysis By Region
4.4. Industry Trends
5. Market Dynamics
5.1. Market Evaluation
5.2. Drivers
5.2.1. Increasing demand in agricultural field
5.3. Restraints
5.3.1. Less penetration of IPM pheromones in developing agro-economies
5.4. Opportunities
5.4.1. Government initiatives
5.5. Challenges
5.5.1. Lack of technical competency
6. Global Integrated Pest Management Pheromones Market Analysis and Forecast, By Product
6.1. Segment Overview
6.2. Sex
6.3. Aggregation
6.4. Alarm
7. Global Integrated Pest Management Pheromones Market Analysis and Forecast, By Mode of Application
7.1. Segment Overview
7.2. Mass Trapping
7.3. Monitoring & Detection
7.4. Mating Disruption
7.5. Others
8. Global Integrated Pest Management Pheromones Market Analysis and Forecast, By Application
8.1. Segment Overview
8.2. Agriculture
8.3. Forestry
8.4. Storage Facilities
8.5. Horticulture
9. Global Integrated Pest Management Pheromones Market Analysis and Forecast, By Regional Analysis
9.1. Segment Overview
9.2. North America
9.2.1. U.S.
9.2.2. Canada
9.2.3. Mexico
9.3. Europe
9.3.1. Germany
9.3.2. France
9.3.3. U.K.
9.3.4. Italy
9.3.5. Spain
9.4. Asia-Pacific
9.4.1. Japan
9.4.2. China
9.4.3. India
9.5. South America
9.5.1. Brazil
9.6. Middle East and Africa
9.6.1. UAE
9.6.2. South Africa
10. Global Integrated Pest Management Pheromones Market-Competitive Landscape
10.1. Overview
10.2. Market Share of Key Players in the Integrated Pest Management Pheromones Market
10.2.1. Global Company Market Share
10.2.2. North America Company Market Share
10.2.3. Europe Company Market Share
10.2.4. APAC Company Market Share
10.3. Competitive Situations and Trends
10.3.1. Product Launches and Developments
10.3.2. Partnerships, Collaborations, and Agreements
10.3.3. Mergers & Acquisitions
10.3.4. Expansions
11. Company Profiles
11.1. Agrisense BCS Ltd
11.1.1. Business Overview
11.1.2. Company Snapshot
11.1.3. Company Market Share Analysis
11.1.4. Company Component Portfolio
11.1.5. Recent Developments
11.1.6. SWOT Analysis
11.2. Novagrica
11.2.1. Business Overview
11.2.2. Company Snapshot
11.2.3. Company Market Share Analysis
11.2.4. Company Component Portfolio
11.2.5. Recent Developments
11.2.6. SWOT Analysis
11.3. Shin-Etsu Chemicals
11.3.1. Business Overview
11.3.2. Company Snapshot
11.3.3. Company Market Share Analysis
11.3.4. Company Component Portfolio
11.3.5. Recent Developments
11.3.6. SWOT Analysis
11.4. Indore Biotech Inputs and Research Pvt. Ltd.
11.4.1. Business Overview
11.4.2. Company Snapshot
11.4.3. Company Market Share Analysis
11.4.4. Company Component Portfolio
11.4.5. Recent Developments
11.4.6. SWOT Analysis
11.5. International Pheromone Systems Ltd (IPS)
11.5.1. Business Overview
11.5.2. Company Snapshot
11.5.3. Company Market Share Analysis
11.5.4. Company Component Portfolio
11.5.5. Recent Developments
11.5.6. SWOT Analysis
11.6. Russell IPM
11.6.1. Business Overview
11.6.2. Company Snapshot
11.6.3. Company Market Share Analysis
11.6.4. Company Component Portfolio
11.6.5. Recent Developments
11.6.6. SWOT Analysis
11.7. Pheromone Chemicals
11.7.1. Business Overview
11.7.2. Company Snapshot
11.7.3. Company Market Share Analysis
11.7.4. Company Component Portfolio
11.7.5. Recent Developments
11.7.6. SWOT Analysis
11.8. Ponalab
11.8.1. Business Overview
11.8.2. Company Snapshot
11.8.3. Company Market Share Analysis
11.8.4. Company Component Portfolio
11.8.5. Recent Developments
11.8.6. SWOT Analysis
11.9. Trécé, Inc.
11.9.1. Business Overview
11.9.2. Company Snapshot
11.9.3. Company Market Share Analysis
11.9.4. Company Component Portfolio
11.9.5. Recent Developments
11.9.6. SWOT Analysis
11.10. Suterra LLC
11.10.1. Business Overview
11.10.2. Company Snapshot
11.10.3. Company Market Share Analysis
11.10.4. Company Component Portfolio
11.10.5. Recent Developments
11.10.6. SWOT Analysis
List of Table
1. Global Integrated Pest Management Pheromones Market, By Product, 2020-2033 (USD Billion)
2. Global Sex Integrated Pest Management Pheromones Market, By Region, 2020-2033 (USD Billion)
3. Global Aggregation Integrated Pest Management Pheromones Market, By Region, 2020-2033 (USD Billion)
4. Global Alarm Integrated Pest Management Pheromones Market, By Region, 2020-2033 (USD Billion)
5. Global Integrated Pest Management Pheromones Market, By Mode of Application, 2020-2033 (USD Billion)
6. Global Mass Trapping Integrated Pest Management Pheromones Market, By Region, 2020-2033 (USD Billion)
7. Global Monitoring & Detection Integrated Pest Management Pheromones Market, By Region, 2020-2033 (USD Billion)
8. Global Mating Disruption Integrated Pest Management Pheromones Market, By Region, 2020-2033 (USD Billion)
9. Global Others Food Integrated Pest Management Pheromones Market, By Region, 2020-2033 (USD Billion)
10. Global Integrated Pest Management Pheromones Market, By Application, 2020-2033 (USD Billion)
11. Global Agriculture Integrated Pest Management Pheromones Market, By Region, 2020-2033 (USD Billion)
12. Global Forestry Integrated Pest Management Pheromones Market, By Region, 2020-2033 (USD Billion)
13. Global Storage Facilities Integrated Pest Management Pheromones Market, By Region, 2020-2033 (USD Billion)
14. Global Horticulture Integrated Pest Management Pheromones Market, By Region, 2020-2033 (USD Billion)
15. Global Integrated Pest Management Pheromones Market, By Region, 2020-2033 (USD Billion)
16. North America Integrated Pest Management Pheromones Market, By Product, 2020-2033 (USD Billion)
17. North America Integrated Pest Management Pheromones Market, By Mode of Application, 2020-2033 (USD Billion)
18. North America Integrated Pest Management Pheromones Market, By Application, 2020-2033 (USD Billion)
19. U.S. Integrated Pest Management Pheromones Market, By Product, 2020-2033 (USD Billion)
20. U.S. Integrated Pest Management Pheromones Market, By Mode of Application, 2020-2033 (USD Billion)
21. U.S. Integrated Pest Management Pheromones Market, By Application, 2020-2033 (USD Billion)
22. Canada Integrated Pest Management Pheromones Market, By Product, 2020-2033 (USD Billion)
23. Canada Integrated Pest Management Pheromones Market, By Mode of Application, 2020-2033 (USD Billion)
24. Canada Integrated Pest Management Pheromones Market, By Application, 2020-2033 (USD Billion)
25. Mexico Integrated Pest Management Pheromones Market, By Product, 2020-2033 (USD Billion)
26. Mexico Integrated Pest Management Pheromones Market, By Mode of Application, 2020-2033 (USD Billion)
27. Mexico Integrated Pest Management Pheromones Market, By Application, 2020-2033 (USD Billion)
28. Europe Integrated Pest Management Pheromones Market, By Product, 2020-2033 (USD Billion)
29. Europe Integrated Pest Management Pheromones Market, By Mode of Application, 2020-2033 (USD Billion)
30. Europe Integrated Pest Management Pheromones Market, By Application, 2020-2033 (USD Billion)
31. Germany Integrated Pest Management Pheromones Market, By Product, 2020-2033 (USD Billion)
32. Germany Integrated Pest Management Pheromones Market, By Mode of Application, 2020-2033 (USD Billion)
33. Germany Integrated Pest Management Pheromones Market, By Application, 2020-2033 (USD Billion)
34. France Integrated Pest Management Pheromones Market, By Product, 2020-2033 (USD Billion)
35. France Integrated Pest Management Pheromones Market, By Mode of Application, 2020-2033 (USD Billion)
36. France Integrated Pest Management Pheromones Market, By Application, 2020-2033 (USD Billion)
37. U.K. Integrated Pest Management Pheromones Market, By Product, 2020-2033 (USD Billion)
38. U.K. Integrated Pest Management Pheromones Market, By Mode of Application, 2020-2033 (USD Billion)
39. U.K. Integrated Pest Management Pheromones Market, By Application, 2020-2033 (USD Billion)
40. Italy Integrated Pest Management Pheromones Market, By Product, 2020-2033 (USD Billion)
41. Italy Integrated Pest Management Pheromones Market, By Mode of Application, 2020-2033 (USD Billion)
42. Italy Integrated Pest Management Pheromones Market, By Application, 2020-2033 (USD Billion)
43. Spain Integrated Pest Management Pheromones Market, By Product, 2020-2033 (USD Billion)
44. Spain Integrated Pest Management Pheromones Market, By Mode of Application, 2020-2033 (USD Billion)
45. Spain Integrated Pest Management Pheromones Market, By Application, 2020-2033 (USD Billion)
46. Asia Pacific Integrated Pest Management Pheromones Market, By Product, 2020-2033 (USD Billion)
47. Asia Pacific Integrated Pest Management Pheromones Market, By Mode of Application, 2020-2033 (USD Billion)
48. Asia Pacific Integrated Pest Management Pheromones Market, By Application, 2020-2033 (USD Billion)
49. Japan Integrated Pest Management Pheromones Market, By Product, 2020-2033 (USD Billion)
50. Japan Integrated Pest Management Pheromones Market, By Mode of Application, 2020-2033 (USD Billion)
51. Japan Integrated Pest Management Pheromones Market, By Application, 2020-2033 (USD Billion)
52. China Integrated Pest Management Pheromones Market, By Product, 2020-2033 (USD Billion)
53. China Integrated Pest Management Pheromones Market, By Mode of Application, 2020-2033 (USD Billion)
54. China Integrated Pest Management Pheromones Market, By Application, 2020-2033 (USD Billion)
55. India Integrated Pest Management Pheromones Market, By Product, 2020-2033 (USD Billion)
56. India Integrated Pest Management Pheromones Market, By Mode of Application, 2020-2033 (USD Billion)
57. India Integrated Pest Management Pheromones Market, By Application, 2020-2033 (USD Billion)
58. South America Integrated Pest Management Pheromones Market, By Product, 2020-2033 (USD Billion)
59. South America Integrated Pest Management Pheromones Market, By Mode of Application, 2020-2033 (USD Billion)
60. South America Integrated Pest Management Pheromones Market, By Application, 2020-2033 (USD Billion)
61. Brazil Integrated Pest Management Pheromones Market, By Product, 2020-2033 (USD Billion)
62. Brazil Integrated Pest Management Pheromones Market, By Mode of Application, 2020-2033 (USD Billion)
63. Brazil Integrated Pest Management Pheromones Market, By Application, 2020-2033 (USD Billion)
64. Middle East and Africa Integrated Pest Management Pheromones Market, By Product, 2020-2033 (USD Billion)
65. Middle East and Africa Integrated Pest Management Pheromones Market, By Mode of Application, 2020-2033 (USD Billion)
66. Middle East and Africa Integrated Pest Management Pheromones Market, By Application, 2020-2033 (USD Billion)
67. UAE Integrated Pest Management Pheromones Market, By Product, 2020-2033 (USD Billion)
68. UAE Integrated Pest Management Pheromones Market, By Mode of Application, 2020-2033 (USD Billion)
69. UAE Integrated Pest Management Pheromones Market, By Application, 2020-2033 (USD Billion)
70. South Africa Integrated Pest Management Pheromones Market, By Product, 2020-2033 (USD Billion)
71. South Africa Integrated Pest Management Pheromones Market, By Mode of Application, 2020-2033 (USD Billion)
72. South Africa Integrated Pest Management Pheromones Market, By Application, 2020-2033 (USD Billion)
List of Figures
1. Global Integrated Pest Management Pheromones Market Segmentation
2. Integrated Pest Management Pheromones Market: Research Methodology
3. Market Size Estimation Methodology: Bottom-Up Approach
4. Market Size Estimation Methodology: Top-Down Approach
5. Data Triangulation
6. Porter’s Five Forces Analysis
7. Value Chain Analysis
8. Global Integrated Pest Management Pheromones Market Attractiveness Analysis By Product
9. Global Integrated Pest Management Pheromones Market Attractiveness Analysis By Mode of Application
10. Global Integrated Pest Management Pheromones Market Attractiveness Analysis By Application
11. Global Integrated Pest Management Pheromones Market Attractiveness Analysis By Region
12. Global Integrated Pest Management Pheromones Market: Dynamics
13. Global Integrated Pest Management Pheromones Market Share by Product (2023 & 2033)
14. Global Integrated Pest Management Pheromones Market Share by Mode of Application (2023 & 2033)
15. Global Integrated Pest Management Pheromones Market Share by Application (2023 & 2033)
16. Global Integrated Pest Management Pheromones Market Share by Regions (2023 & 2033)
17. Global Integrated Pest Management Pheromones Market Share by Company (2023)
This study forecasts revenue at global, regional, and country levels from 2020 to 2033. The Brainy Insights has segmented the global integrated pest management pheromones market based on below mentioned segments:
Global Integrated Pest Management Pheromones Market by Product:
Global Integrated Pest Management Pheromones Market by Application:
Global Integrated Pest Management Pheromones Market by Mode of Application:
Global Integrated Pest Management Pheromones Market by Region:
Research has its special purpose to undertake marketing efficiently. In this competitive scenario, businesses need information across all industry verticals; the information about customer wants, market demand, competition, industry trends, distribution channels etc. This information needs to be updated regularly because businesses operate in a dynamic environment. Our organization, The Brainy Insights incorporates scientific and systematic research procedures in order to get proper market insights and industry analysis for overall business success. The analysis consists of studying the market from a miniscule level wherein we implement statistical tools which helps us in examining the data with accuracy and precision.
Our research reports feature both; quantitative and qualitative aspects for any market. Qualitative information for any market research process are fundamental because they reveal the customer needs and wants, usage and consumption for any product/service related to a specific industry. This in turn aids the marketers/investors in knowing certain perceptions of the customers. Qualitative research can enlighten about the different product concepts and designs along with unique service offering that in turn, helps define marketing problems and generate opportunities. On the other hand, quantitative research engages with the data collection process through interviews, e-mail interactions, surveys and pilot studies. Quantitative aspects for the market research are useful to validate the hypotheses generated during qualitative research method, explore empirical patterns in the data with the help of statistical tools, and finally make the market estimations.
The Brainy Insights offers comprehensive research and analysis, based on a wide assortment of factual insights gained through interviews with CXOs and global experts and secondary data from reliable sources. Our analysts and industry specialist assume vital roles in building up statistical tools and analysis models, which are used to analyse the data and arrive at accurate insights with exceedingly informative research discoveries. The data provided by our organization have proven precious to a diverse range of companies, facilitating them to address issues such as determining which products/services are the most appealing, whether or not customers use the product in the manner anticipated, the purchasing intentions of the market and many others.
Our research methodology encompasses an idyllic combination of primary and secondary initiatives. Key phases involved in this process are listed below:

The phase involves the gathering and collecting of market data and its related information with the help of different sources & research procedures.

The data procurement stage involves in data gathering and collecting through various data sources.
This stage involves in extensive research. These data sources includes:
Purchased Database: Purchased databases play a crucial role in estimating the market sizes irrespective of the domain. Our purchased database includes:
Primary Research: The Brainy Insights interacts with leading companies and experts of the concerned domain to develop the analyst team’s market understanding and expertise. It improves and substantiates every single data presented in the market reports. Primary research mainly involves in telephonic interviews, E-mail interactions and face-to-face interviews with the raw material providers, manufacturers/producers, distributors, & independent consultants. The interviews that we conduct provides valuable data on market size and industry growth trends prevailing in the market. Our organization also conducts surveys with the various industry experts in order to gain overall insights of the industry/market. For instance, in healthcare industry we conduct surveys with the pharmacists, doctors, surgeons and nurses in order to gain insights and key information of a medical product/device/equipment which the customers are going to usage. Surveys are conducted in the form of questionnaire designed by our own analyst team. Surveys plays an important role in primary research because surveys helps us to identify the key target audiences of the market. Additionally, surveys helps to identify the key target audience engaged with the market. Our survey team conducts the survey by targeting the key audience, thus gaining insights from them. Based on the perspectives of the customers, this information is utilized to formulate market strategies. Moreover, market surveys helps us to understand the current competitive situation of the industry. To be precise, our survey process typically involve with the 360 analysis of the market. This analytical process begins by identifying the prospective customers for a product or service related to the market/industry to obtain data on how a product/service could fit into customers’ lives.

Secondary Research: The secondary data sources includes information published by the on-profit organizations such as World bank, WHO, company fillings, investor presentations, annual reports, national government documents, statistical databases, blogs, articles, white papers and others. From the annual report, we analyse a company’s revenue to understand the key segment and market share of that organization in a particular region. We analyse the company websites and adopt the product mapping technique which is important for deriving the segment revenue. In the product mapping method, we select and categorize the products offered by the companies catering to domain specific market, deduce the product revenue for each of the companies so as to get overall estimation of the market size. We also source data and analyses trends based on information received from supply side and demand side intermediaries in the value chain. The supply side denotes the data gathered from supplier, distributor, wholesaler and the demand side illustrates the data gathered from the end customers for respective market domain.

The supply side for a domain specific market is analysed by:
The demand side for the market is estimated through:
In-house Library: Apart from these third-party sources, we have our in-house library of qualitative and quantitative information. Our in-house database includes market data for various industry and domains. These data are updated on regular basis as per the changing market scenario. Our library includes, historic databases, internal audit reports and archives.
Sometimes there are instances where there is no metadata or raw data available for any domain specific market. For those cases, we use our expertise to forecast and estimate the market size in order to generate comprehensive data sets. Our analyst team adopt a robust research technique in order to produce the estimates:
Data Synthesis: This stage involves the analysis & mapping of all the information obtained from the previous step. It also involves in scrutinizing the data for any discrepancy observed while data gathering related to the market. The data is collected with consideration to the heterogeneity of sources. Robust scientific techniques are in place for synthesizing disparate data sets and provide the essential contextual information that can orient market strategies. The Brainy Insights has extensive experience in data synthesis where the data passes through various stages:


Market Deduction & Formulation: The final stage comprises of assigning data points at appropriate market spaces so as to deduce feasible conclusions. Analyst perspective & subject matter expert based holistic form of market sizing coupled with industry analysis also plays a crucial role in this stage.
This stage involves in finalization of the market size and numbers that we have collected from data integration step. With data interpolation, it is made sure that there is no gap in the market data. Successful trend analysis is done by our analysts using extrapolation techniques, which provide the best possible forecasts for the market.
Data Validation & Market Feedback: Validation is the most important step in the process. Validation & re-validation via an intricately designed process helps us finalize data-points to be used for final calculations.

The Brainy Insights interacts with leading companies and experts of the concerned domain to develop the analyst team’s market understanding and expertise. It improves and substantiates every single data presented in the market reports. The data validation interview and discussion panels are typically composed of the most experienced industry members. The participants include, however, are not limited to:
Moreover, we always validate our data and findings through primary respondents from all the major regions we are working on.


Free Customization
Fortune 500 Clients
Free Yearly Update On Purchase Of Multi/Corporate License
Companies Served Till Date