- +1-315-215-1633
- sales@thebrainyinsights.com

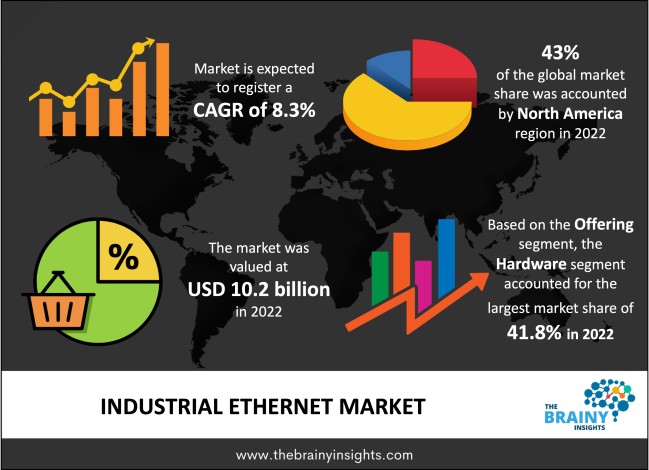
The global industrial ethernet market is expected to reach USD 22.6 billion by 2032, at a CAGR of 8.3% during the forecast period 2023 to 2032. Asia Pacific is expected to grow the fastest during the forecast period.
Using a networking solution for industrial purposes is referred to as industrial ethernet. It combines specialized protocols with ethernet to improve determinism and provide real-time data. It provides data rates ranging from 10 Mbps to 1 Gbps. Schneider Electric SE, Siemens AG, Honeywell International, and Rockwell Automation are some of the world's leading suppliers of industrial ethernet. Leading competitors in the industrial ethernet market are aggressively focused on innovation and incorporating sophisticated technology into their existing products. According to the industrial ethernet market analysis, they are also predicted to use partnerships, mergers, and acquisitions as their primary commercial development strategy in the coming years. For example, Antaira Technologies announced the availability of the IMC-C100-XX series in August 2018, expanding its industrial ethernet line. In addition, a new machine automation controller from Omron's NX1 series was introduced on August 8th, 2018, and it can help manufacturers increase their output, which is another innovation that could advance the industrial ethernet market.
Get an overview of this study by requesting a free sample
Rising Power Industry- There is a boom in the adoption of smart grids in the power industry due to the increased requirement for monitoring local changes in power use. Smart grid installation is currently more prevalent in China and North America. Furthermore, Government initiatives in these regions to update traditional power networks into smart grids are expanding the global industrial ethernet market scope. The key advantages of smart grids over traditional grids influence investments in smart grid projects.
Raw Materials High Price- Growing demand for industrial cables and fierce market competition have made it difficult for vendors to remain competitive. Furthermore, raw material prices are affected by factors such as availability, inflation, demand-supply imbalance, and output. 70% of end-product costs are determined by raw material costs (cables). The primary raw materials for industrial ethernet cables are copper and fibre-optic. Fibre optics are more expensive per meter than copper. This price variation in nonferrous materials impedes the global market for industrial ethernet.
Technological Advancements- In the subsequent years, the introduction of novel technologies, including big data analytics and cloud-based solutions, as well as their expanded use in data centres, are expected to boost the industrial ethernet market growth. Aside from that, the growing usage of industrial internet of things technologies across various industries has expanded the business reach. Furthermore, the increasing use of advanced industrial ethernet protocols in innovative businesses is expected to drive the growth of the industrial ethernet market in the coming years. According to reports, industrial ethernet is widely used in the automobile, pharmaceutical, oil & gas, electrical & electronics, and aerospace & defence industries.
Harsh field sites- It gets very difficult to deploy industrial ethernet in remote field locations as these locations are prone to harsh and unfavourable conditions such as high voltage, extremely high or low temperature, lightning strikes, electrical fast transients, etc., which is expected to challenge growth during the forecast period in harsh field sites.
The regions analyzed for the market include North America, Europe, South America, Asia Pacific, the Middle East, and Africa. North America emerged as the most significant global industrial ethernet market, with a 43% market revenue share in 2022.
North America dominates the industrial ethernet market with a 43% market revenue share in 2022. This is due to the region's rapid increase in industrial automation. The rise of Industry 4.0 is propelling the regional market even further. Furthermore, favourable government efforts and legislation promoting industrial automation and adoption in the manufacturing and automotive industries would positively impact the firm. Many industrial automation enterprises in the region also contribute to regional growth.
Asia Pacific is expected to witness the fastest growth during the forecast period. Industrial ethernet's enormous acceptance in the consumer electronics and automobile industries in nations like China, Japan, South Korea, and India is the primary reason for the dominance of the Asia Pacific industrial ethernet market.
North America Region Industrial Ethernet Market Share in 2022 - 43%
www.thebrainyinsights.com
Check the geographical analysis of this market by requesting a free sample
The offering segment is divided into software, hardware, and services. The hardware segment dominated the market, with a share of around 41.8% in 2022. Devices like PCs and IP phones are linked to the internet to enable quick communication in industries. In the industrial context, machine-to-machine (M2M) communication helps to streamline productive plant operations. It accelerates processes and improves dependability and robustness in various industries, including aerospace and defence, pharmaceutical, transportation, automotive, and food & beverages.
The application segment is divided into automotive & transportation, pharmaceutical & medical devices, electrical & electronics, aerospace & defence, energy & power, food & beverages, oil & gas, and others. The automotive & transportation segment dominated the market, with a market share of around 26.0% in 2022. Because of the increasing demand for increased automation in automobile production units worldwide, the automotive industry will dominate the global market. Similarly, water level controllers, water level monitoring sensors, and AC drives are critical components of water treatment systems, and communication between these systems is facilitated via an industrial ethernet network. With the embrace of connectivity and automation, the automobile sector continues to develop rapidly.
| Attribute | Description |
|---|---|
| Market Size | Revenue (USD Billion) |
| Market size value in 2022 | USD 10.2 billion |
| Market size value in 2032 | USD 22.6 billion |
| CAGR (2023 to 2032) | 8.3% |
| Historical data | 2019-2021 |
| Base Year | 2022 |
| Forecast | 2023-2032 |
| Regional Segments | North America, Asia Pacific, Europe, Latin America, Middle East and Africa |
| Segments | Offering, Application |
As per The Brainy Insights, the size of the industrial ethernet market was valued at USD 10.2 billion in 2022 to USD 22.6 billion by 2032.
The global industrial ethernet market is growing at a CAGR of 8.3% during the forecast period 2023-2032.
North America emerged as the largest industrial ethernet market.
Key players in the industrial ethernet market are ABB Ltd., Physik Instrumente (PI) GmbH and Co. KG, Robert Bosch GmbH, Analog Devices Inc., Belden Inc., Hitachi Ltd., Nexans SA, Schneider Electric SE, Rockwell Automation Inc., and Siemens AG.
1. Introduction
1.1. Objectives of the Study
1.2. Market Definition
1.3. Research Scope
1.4. Currency
1.5. Key Target Audience
2. Research Methodology and Assumptions
3. Executive Summary
4. Premium Insights
4.1. Porter’s Five Forces Analysis
4.2. Value Chain Analysis
4.3. Top Investment Pockets
4.3.1. Market Attractiveness Analysis by Offering
4.3.2. Market Attractiveness Analysis by Application
4.3.3. Market Attractiveness Analysis by Region
4.4. Industry Trends
5. Market Dynamics
5.1. Market Evaluation
5.2. Drivers
5.2.1. Rising Power Industry
5.3. Restraints
5.3.1. Raw Materials High Price
5.4. Opportunities
5.4.1. Technological Advancements
5.5. Challenges
5.5.1. Installation Issues
6. Global Industrial Ethernet Market Analysis and Forecast, By Offering
6.1. Segment Overview
6.2. Software
6.3. Hardware
6.4. Services
7. Global Industrial Ethernet Market Analysis and Forecast, By Application
7.1. Segment Overview
7.2. Automotive & Transportation
7.3. Pharmaceutical & Medical Devices
7.4. Electrical & Electronics
7.5. Aerospace & Defense
7.6. Energy & Power
7.7. Food & Beverages
7.8. Oil & Gas
7.9. Others
8. Global Industrial Ethernet Market Analysis and Forecast, By Regional Analysis
8.1. Segment Overview
8.2. North America
8.2.1. U.S.
8.2.2. Canada
8.2.3. Mexico
8.3. Europe
8.3.1. Germany
8.3.2. France
8.3.3. U.K.
8.3.4. Italy
8.3.5. Spain
8.4. Asia-Pacific
8.4.1. Japan
8.4.2. China
8.4.3. India
8.5. South America
8.5.1. Brazil
8.6. Middle East and Africa
8.6.1. UAE
8.6.2. South Africa
9. Global Industrial Ethernet Market-Competitive Landscape
9.1. Overview
9.2. Market Share of Key Players in Global Industrial Ethernet Market
9.2.1. Global Company Market Share
9.2.2. North America Company Market Share
9.2.3. Europe Company Market Share
9.2.4. APAC Company Market Share
9.3. Competitive Situations and Trends
9.3.1. Product Launches and Developments
9.3.2. Partnerships, Collaborations, and Agreements
9.3.3. Mergers & Acquisitions
9.3.4. Expansions
10. Company Profiles
10.1. ABB Ltd.
10.1.1. Business Overview
10.1.2. Company Snapshot
10.1.3. Company Market Share Analysis
10.1.4. Company Product Portfolio
10.1.5. Recent Developments
10.1.6. SWOT Analysis
10.2. Physik Instrumente (PI) GmbH and Co. KG
10.2.1. Business Overview
10.2.2. Company Snapshot
10.2.3. Company Market Share Analysis
10.2.4. Company Product Portfolio
10.2.5. Recent Developments
10.2.6. SWOT Analysis
10.3. Robert Bosch GmbH
10.3.1. Business Overview
10.3.2. Company Snapshot
10.3.3. Company Market Share Analysis
10.3.4. Company Product Portfolio
10.3.5. Recent Developments
10.3.6. SWOT Analysis
10.4. Analog Devices Inc.
10.4.1. Business Overview
10.4.2. Company Snapshot
10.4.3. Company Market Share Analysis
10.4.4. Company Product Portfolio
10.4.5. Recent Developments
10.4.6. SWOT Analysis
10.5. Belden Inc.
10.5.1. Business Overview
10.5.2. Company Snapshot
10.5.3. Company Market Share Analysis
10.5.4. Company Product Portfolio
10.5.5. Recent Developments
10.5.6. SWOT Analysis
10.6. Hitachi Ltd.
10.6.1. Business Overview
10.6.2. Company Snapshot
10.6.3. Company Market Share Analysis
10.6.4. Company Product Portfolio
10.6.5. Recent Developments
10.6.6. SWOT Analysis
10.7. Nexans SA
10.7.1. Business Overview
10.7.2. Company Snapshot
10.7.3. Company Market Share Analysis
10.7.4. Company Product Portfolio
10.7.5. Recent Developments
10.7.6. SWOT Analysis
10.8. Schneider Electric SE
10.8.1. Business Overview
10.8.2. Company Snapshot
10.8.3. Company Market Share Analysis
10.8.4. Company Product Portfolio
10.8.5. Recent Developments
10.8.6. SWOT Analysis
10.9. Rockwell Automation Inc.
10.9.1. Business Overview
10.9.2. Company Snapshot
10.9.3. Company Market Share Analysis
10.9.4. Company Product Portfolio
10.9.5. Recent Developments
10.9.6. SWOT Analysis
10.10. Siemens AG
10.10.1. Business Overview
10.10.2. Company Snapshot
10.10.3. Company Market Share Analysis
10.10.4. Company Product Portfolio
10.10.5. Recent Developments
10.10.6. SWOT Analysis
List of Table
1. Global Industrial Ethernet Market, By Offering, 2019-2032 (USD Billion)
2. Global Software, Industrial Ethernet Market, By Region, 2019-2032 (USD Billion)
3. Global Hardware, Industrial Ethernet Market, By Region, 2019-2032 (USD Billion)
4. Global Services, Industrial Ethernet Market, By Region, 2019-2032 (USD Billion)
5. Global Industrial Ethernet Market, By Application, 2019-2032 (USD Billion)
6. Global Automotive & Transportation, Industrial Ethernet Market, By Region, 2019-2032 (USD Billion)
7. Global Pharmaceutical & Medical Devices, Industrial Ethernet Market, By Region, 2019-2032 (USD Billion)
8. Global Electrical & Electronics, Industrial Ethernet Market, By Region, 2019-2032 (USD Billion)
9. Global Aerospace & Defense, Industrial Ethernet Market, By Region, 2019-2032 (USD Billion)
10. Global Energy & Power, Industrial Ethernet Market, By Region, 2019-2032 (USD Billion)
11. Global Food & Beverages, Industrial Ethernet Market, By Region, 2019-2032 (USD Billion)
12. Global Oil & Gas, Industrial Ethernet Market, By Region, 2019-2032 (USD Billion)
13. Global Others, Industrial Ethernet Market, By Region, 2019-2032 (USD Billion)
14. North America Industrial Ethernet Market, By Offering, 2019-2032 (USD Billion)
15. North America Industrial Ethernet Market, By Application, 2019-2032 (USD Billion)
16. U.S. Industrial Ethernet Market, By Offering, 2019-2032 (USD Billion)
17. U.S. Industrial Ethernet Market, By Application, 2019-2032 (USD Billion)
18. Canada Industrial Ethernet Market, By Offering, 2019-2032 (USD Billion)
19. Canada Industrial Ethernet Market, By Application, 2019-2032 (USD Billion)
20. Mexico Industrial Ethernet Market, By Offering, 2019-2032 (USD Billion)
21. Mexico Industrial Ethernet Market, By Application, 2019-2032 (USD Billion)
22. Europe Industrial Ethernet Market, By Offering, 2019-2032 (USD Billion)
23. Europe Industrial Ethernet Market, By Application, 2019-2032 (USD Billion)
24. Germany Industrial Ethernet Market, By Offering, 2019-2032 (USD Billion)
25. Germany Industrial Ethernet Market, By Application, 2019-2032 (USD Billion)
26. France Industrial Ethernet Market, By Offering, 2019-2032 (USD Billion)
27. France Industrial Ethernet Market, By Application, 2019-2032 (USD Billion)
28. U.K. Industrial Ethernet Market, By Offering, 2019-2032 (USD Billion)
29. U.K. Industrial Ethernet Market, By Application, 2019-2032 (USD Billion)
30. Italy Industrial Ethernet Market, By Offering, 2019-2032 (USD Billion)
31. Italy Industrial Ethernet Market, By Application, 2019-2032 (USD Billion)
32. Spain Industrial Ethernet Market, By Offering, 2019-2032 (USD Billion)
33. Spain Industrial Ethernet Market, By Application, 2019-2032 (USD Billion)
34. Asia Pacific Industrial Ethernet Market, By Offering, 2019-2032 (USD Billion)
35. Asia Pacific Industrial Ethernet Market, By Application, 2019-2032 (USD Billion)
36. Japan Industrial Ethernet Market, By Offering, 2019-2032 (USD Billion)
37. Japan Industrial Ethernet Market, By Application, 2019-2032 (USD Billion)
38. China Industrial Ethernet Market, By Offering, 2019-2032 (USD Billion)
39. China Industrial Ethernet Market, By Application, 2019-2032 (USD Billion)
40. India Industrial Ethernet Market, By Offering, 2019-2032 (USD Billion)
41. India Industrial Ethernet Market, By Application, 2019-2032 (USD Billion)
42. South America Industrial Ethernet Market, By Offering, 2019-2032 (USD Billion)
43. South America Industrial Ethernet Market, By Application, 2019-2032 (USD Billion)
44. Brazil Industrial Ethernet Market, By Offering, 2019-2032 (USD Billion)
45. Brazil Industrial Ethernet Market, By Application, 2019-2032 (USD Billion)
46. Middle East and Africa Industrial Ethernet Market, By Offering, 2019-2032 (USD Billion)
47. Middle East and Africa Industrial Ethernet Market, By Application, 2019-2032 (USD Billion)
48. UAE Industrial Ethernet Market, By Offering, 2019-2032 (USD Billion)
49. UAE Industrial Ethernet Market, By Application, 2019-2032 (USD Billion)
50. South Africa Industrial Ethernet Market, By Offering, 2019-2032 (USD Billion)
51. South Africa Industrial Ethernet Market, By Application, 2019-2032 (USD Billion)
List of Figures
1. Global Industrial Ethernet Market Segmentation
2. Global Industrial Ethernet Market: Research Methodology
3. Market Size Estimation Methodology: Bottom-Up Approach
4. Market Size Estimation Methodology: Top-Down Approach
5. Data Triangulation
6. Porter’s Five Forces Analysis
7. Value Chain Analysis
8. Global Industrial Ethernet Market Attractiveness Analysis by Offering
9. Global Industrial Ethernet Market Attractiveness Analysis by Application
10. Global Industrial Ethernet Market Attractiveness Analysis by Region
11. Global Industrial Ethernet Market: Dynamics
12. Global Industrial Ethernet Market Share by Offering (2023 & 2032)
13. Global Industrial Ethernet Market Share by Application (2023 & 2032)
14. Global Industrial Ethernet Market Share by Regions (2023 & 2032)
15. Global Industrial Ethernet Market Share by Company (2022)
This study forecasts global, regional, and country revenue from 2019 to 2032. The Brainy Insights has segmented the global industrial ethernet market based on the below-mentioned segments:
Global Industrial Ethernet Market By Offering:
Global Industrial Ethernet Market By Application:
Global Industrial Ethernet Market By Region:
Research has its special purpose to undertake marketing efficiently. In this competitive scenario, businesses need information across all industry verticals; the information about customer wants, market demand, competition, industry trends, distribution channels etc. This information needs to be updated regularly because businesses operate in a dynamic environment. Our organization, The Brainy Insights incorporates scientific and systematic research procedures in order to get proper market insights and industry analysis for overall business success. The analysis consists of studying the market from a miniscule level wherein we implement statistical tools which helps us in examining the data with accuracy and precision.
Our research reports feature both; quantitative and qualitative aspects for any market. Qualitative information for any market research process are fundamental because they reveal the customer needs and wants, usage and consumption for any product/service related to a specific industry. This in turn aids the marketers/investors in knowing certain perceptions of the customers. Qualitative research can enlighten about the different product concepts and designs along with unique service offering that in turn, helps define marketing problems and generate opportunities. On the other hand, quantitative research engages with the data collection process through interviews, e-mail interactions, surveys and pilot studies. Quantitative aspects for the market research are useful to validate the hypotheses generated during qualitative research method, explore empirical patterns in the data with the help of statistical tools, and finally make the market estimations.
The Brainy Insights offers comprehensive research and analysis, based on a wide assortment of factual insights gained through interviews with CXOs and global experts and secondary data from reliable sources. Our analysts and industry specialist assume vital roles in building up statistical tools and analysis models, which are used to analyse the data and arrive at accurate insights with exceedingly informative research discoveries. The data provided by our organization have proven precious to a diverse range of companies, facilitating them to address issues such as determining which products/services are the most appealing, whether or not customers use the product in the manner anticipated, the purchasing intentions of the market and many others.
Our research methodology encompasses an idyllic combination of primary and secondary initiatives. Key phases involved in this process are listed below:

The phase involves the gathering and collecting of market data and its related information with the help of different sources & research procedures.

The data procurement stage involves in data gathering and collecting through various data sources.
This stage involves in extensive research. These data sources includes:
Purchased Database: Purchased databases play a crucial role in estimating the market sizes irrespective of the domain. Our purchased database includes:
Primary Research: The Brainy Insights interacts with leading companies and experts of the concerned domain to develop the analyst team’s market understanding and expertise. It improves and substantiates every single data presented in the market reports. Primary research mainly involves in telephonic interviews, E-mail interactions and face-to-face interviews with the raw material providers, manufacturers/producers, distributors, & independent consultants. The interviews that we conduct provides valuable data on market size and industry growth trends prevailing in the market. Our organization also conducts surveys with the various industry experts in order to gain overall insights of the industry/market. For instance, in healthcare industry we conduct surveys with the pharmacists, doctors, surgeons and nurses in order to gain insights and key information of a medical product/device/equipment which the customers are going to usage. Surveys are conducted in the form of questionnaire designed by our own analyst team. Surveys plays an important role in primary research because surveys helps us to identify the key target audiences of the market. Additionally, surveys helps to identify the key target audience engaged with the market. Our survey team conducts the survey by targeting the key audience, thus gaining insights from them. Based on the perspectives of the customers, this information is utilized to formulate market strategies. Moreover, market surveys helps us to understand the current competitive situation of the industry. To be precise, our survey process typically involve with the 360 analysis of the market. This analytical process begins by identifying the prospective customers for a product or service related to the market/industry to obtain data on how a product/service could fit into customers’ lives.

Secondary Research: The secondary data sources includes information published by the on-profit organizations such as World bank, WHO, company fillings, investor presentations, annual reports, national government documents, statistical databases, blogs, articles, white papers and others. From the annual report, we analyse a company’s revenue to understand the key segment and market share of that organization in a particular region. We analyse the company websites and adopt the product mapping technique which is important for deriving the segment revenue. In the product mapping method, we select and categorize the products offered by the companies catering to domain specific market, deduce the product revenue for each of the companies so as to get overall estimation of the market size. We also source data and analyses trends based on information received from supply side and demand side intermediaries in the value chain. The supply side denotes the data gathered from supplier, distributor, wholesaler and the demand side illustrates the data gathered from the end customers for respective market domain.

The supply side for a domain specific market is analysed by:
The demand side for the market is estimated through:
In-house Library: Apart from these third-party sources, we have our in-house library of qualitative and quantitative information. Our in-house database includes market data for various industry and domains. These data are updated on regular basis as per the changing market scenario. Our library includes, historic databases, internal audit reports and archives.
Sometimes there are instances where there is no metadata or raw data available for any domain specific market. For those cases, we use our expertise to forecast and estimate the market size in order to generate comprehensive data sets. Our analyst team adopt a robust research technique in order to produce the estimates:
Data Synthesis: This stage involves the analysis & mapping of all the information obtained from the previous step. It also involves in scrutinizing the data for any discrepancy observed while data gathering related to the market. The data is collected with consideration to the heterogeneity of sources. Robust scientific techniques are in place for synthesizing disparate data sets and provide the essential contextual information that can orient market strategies. The Brainy Insights has extensive experience in data synthesis where the data passes through various stages:


Market Deduction & Formulation: The final stage comprises of assigning data points at appropriate market spaces so as to deduce feasible conclusions. Analyst perspective & subject matter expert based holistic form of market sizing coupled with industry analysis also plays a crucial role in this stage.
This stage involves in finalization of the market size and numbers that we have collected from data integration step. With data interpolation, it is made sure that there is no gap in the market data. Successful trend analysis is done by our analysts using extrapolation techniques, which provide the best possible forecasts for the market.
Data Validation & Market Feedback: Validation is the most important step in the process. Validation & re-validation via an intricately designed process helps us finalize data-points to be used for final calculations.

The Brainy Insights interacts with leading companies and experts of the concerned domain to develop the analyst team’s market understanding and expertise. It improves and substantiates every single data presented in the market reports. The data validation interview and discussion panels are typically composed of the most experienced industry members. The participants include, however, are not limited to:
Moreover, we always validate our data and findings through primary respondents from all the major regions we are working on.


Free Customization
Fortune 500 Clients
Free Yearly Update On Purchase Of Multi/Corporate License
Companies Served Till Date