- +1-315-215-1633
- sales@thebrainyinsights.com

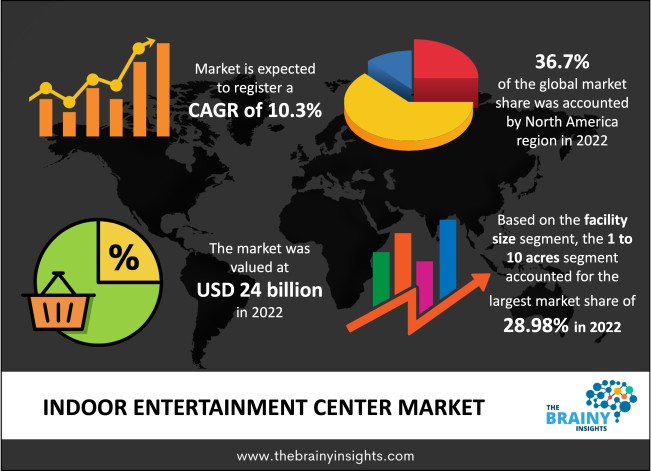
The global indoor entertainment centre market is expected to reach USD 63.9 billion by 2032, at a CAGR of 10.3% during the forecast period 2023 to 2032. Asia Pacific is expected to grow the fastest during the forecast period.
An indoor entertainment centre is a part of the entertainment industry and is often known as an indoor amusement park. It is a small amusement park oriented towards families with young children. They typically serve sub-regional markets in smaller cities. FECs often have fewer attractions than full-scale amusement parks, are less expensive per person per hour, and are supported by local populations rather than prominent tourist attractions. Even though many chains and franchises are in the sector, most are locally owned and run. With continual technology advancements, indoor entertainment centres are providing customers with a diverse choice of gaming possibilities. New technologies, such as 3D technology & virtual reality gaming, are becoming popular. As a result, the availability of a diverse variety of gaming alternatives will drive the indoor entertainment centres market throughout the forecast period.
Get an overview of this study by requesting a free sample
Rising Middle-Class Population- The indoor entertainment centre market has seen a significant increase in demand due to an increasing middle-class population and disposable income, particularly in developed countries. Entertainment centres provide loyalty programs like loyalty points, memberships, rewards points, and so on, enticing visitors to spend their weekends and vacations in these centres, consequently raising demand for worldwide indoor entertainment centres over the forecast period.
High Cost- Due to the indoor entertainment centre's high initial costs, the market growth will restrain. In addition, with the increased initial investment, operators have to raise ticket prices, hindering the market growth.
Technology Advances- As technology advances, entertainment centres introduce different creative gaming alternatives such as indoor cricket, bowling, football, racing, and other games, boosting global demand for indoor entertainment centre markets. Entertainment centres are also famous for celebrating birthdays, events, parties, and other special occasions. People spend their weekends and holidays in such entertainment centres since they have various options for food and beverages, music, and entertainment all under one roof.
Capital Expenditure- Capital expenditure for constructing new entertainment setups is costly, a significant hurdle impeding the growth of the indoor entertainment centres market.
The regions analyzed for the market include North America, Europe, South America, Asia Pacific, the Middle East, and Africa. North America emerged as the largest global indoor entertainment centre market, with a 36.7% market revenue share in 2022.
North America dominates the indoor entertainment centre market with a 36.7% market revenue share in 2022 due to the several key players in this region. Manufacturers are now experimenting with combining VR and AR technology with 3D projection mapping and interactive digital surfaces to provide technologically advanced gaming alternatives that attract people of all ages. Product enhancements and the inclusion of new attractions are projected to grow revenue in the indoor entertainment centre market.
Asia Pacific is expected to witness the fastest growth during the forecast period. Individuals in Asia-Pacific countries such as China, India, and Japan have expanded their potential. This regional market is expected to rise due to a growing middle-class population and increased disposable income.
North America Region Indoor Entertainment Center Market Share in 2022 - 36.7%
www.thebrainyinsights.com
Check the geographical analysis of this market by requesting a free sample
The age segment is divided into age 25+, 9-12 age, 0-8 age, 21-25 age, and 13-19 age. The 21-25 age segment dominated the market, with a market share of around 38.78% in 2022. This segment will grow as more young people with disposable income participate in the numerous leisure activities offered by indoor entertainment centres.
The facility size segment is divided into 1 to 10 acres, Up to 5,000 sq. ft, 10 to 30 acres, 10,001 to 20,000 sq. ft, 5,001 to 10,000 sq. ft, 20,001 to 40,000 sq. ft, and Over 30 acres. The 1 to 10 acres segment dominated the market, with a market share of around 28.98% in 2022. Owing to gaming zones created explicitly for different age groups, families will be able to engage in various activities, increasing demand for sites with more than 10 acres of land. Amusement rides, game areas, dining places, and movie theatres are all part of these indoor entertainment complexes, which offer various services to their customers.
The application segment is divided into AR & VR gaming zones, skill/competition games, arcade studios, and physical play activities. The AR & VR gaming zones segment dominated the market, with a market share of around 34.67% in 2022. Augmented Reality (AR) and Virtual Reality (VR) games are top-rated; thus, players in the indoor entertainment centre market have begun to provide these games. Furthermore, certain game firms are working on various technologies to improve gaming experiences in indoor entertainment centres.
| Attribute | Description |
|---|---|
| Market Size | Revenue (USD Billion) |
| Market size value in 2022 | USD 24 billion |
| Market size value in 2032 | USD 63.9 billion |
| CAGR (2023 to 2032) | 10.3% |
| Historical data | 2019-2021 |
| Base Year | 2022 |
| Forecast | 2023-2032 |
| Regional Segments | North America, Asia Pacific, Europe, Latin America, Middle East and Africa |
| Segments | Age, Facility Size, Application |
As per The Brainy Insights, the size of the indoor entertainment centre market was valued at USD 24 billion in 2022 to USD 63.9 billion by 2032.
The global indoor entertainment centre market is growing at a CAGR of 10.3 during the forecast period 2023-2032.
North America emerged as the largest indoor entertainment centre market.
1. Introduction
1.1. Objectives of the Study
1.2. Market Definition
1.3. Research Scope
1.4. Currency
1.5. Key Target Audience
2. Research Methodology and Assumptions
3. Executive Summary
4. Premium Insights
4.1. Porter’s Five Forces Analysis
4.2. Value Chain Analysis
4.3. Top Investment Pockets
4.3.1. Market Attractiveness Analysis by Age
4.3.2. Market Attractiveness Analysis by Facility Size
4.3.3. Market Attractiveness Analysis by Application
4.3.4. Market Attractiveness Analysis by Region
4.4. Industry Trends
5. Market Dynamics
5.1. Market Evaluation
5.2. Drivers
5.2.1. Rising middle-class population
5.3. Restraints
5.3.1. Lack of awareness
5.4. Opportunities
5.4.1. Technology advances
5.5. Challenges
5.5.1. Capital expenditure
6. Global Indoor Entertainment Center Market Analysis and Forecast, By Age
6.1. Segment Overview
6.2. Age 25+
6.3. 9-12 age
6.4. 0-8 age
6.5. 21-25 age
6.6. 13-19 age
7. Global Indoor Entertainment Center Market Analysis and Forecast, By Facility Size
7.1. Segment Overview
7.2. 1 to 10 acres
7.3. Up to 5,000 sq. ft
7.4. 10 to 30 acres
7.5. 10,001 to 20,000 sq. ft
7.6. 5,001 to 10,000 sq. ft
7.7. 20,001 to 40,000 sq. ft
7.8. Over 30 acres
8. Global Indoor Entertainment Center Market Analysis and Forecast, By Application
8.1. Segment Overview
8.2. AR & VR Gaming Zones
8.3. Skill/Competition Games
8.4. Arcade Studios
8.5. Physical Play Activities
8.6. Others
9. Global Indoor Entertainment Center Market Analysis and Forecast, By Regional Analysis
9.1. Segment Overview
9.2. North America
9.2.1. U.S.
9.2.2. Canada
9.2.3. Mexico
9.3. Europe
9.3.1. Germany
9.3.2. France
9.3.3. U.K.
9.3.4. Italy
9.3.5. Spain
9.4. Asia-Pacific
9.4.1. Japan
9.4.2. China
9.4.3. India
9.5. South America
9.5.1. Brazil
9.6. Middle East and Africa
9.6.1. UAE
9.6.2. South Africa
10. Global Indoor Entertainment Center Market-Competitive Landscape
10.1. Overview
10.2. Market Share of Key Players in Global Indoor Entertainment Center Market
10.2.1. Global Company Market Share
10.2.2. North America Company Market Share
10.2.3. Europe Company Market Share
10.2.4. APAC Company Market Share
10.3. Competitive Situations and Trends
10.3.1. Product Launches and Developments
10.3.2. Partnerships, Collaborations, and Agreements
10.3.3. Mergers & Acquisitions
10.3.4. Expansions
11. Company Profiles
11.1. Dave & Buster’s
11.1.1. Business Overview
11.1.2. Company Snapshot
11.1.3. Company Market Share Analysis
11.1.4. Company Product Portfolio
11.1.5. Recent Developments
11.1.6. SWOT Analysis
11.2. LEGOLAND Discovery Center
11.2.1. Business Overview
11.2.2. Company Snapshot
11.2.3. Company Market Share Analysis
11.2.4. Company Product Portfolio
11.2.5. Recent Developments
11.2.6. SWOT Analysis
11.3. CEC Entertainment, Inc.
11.3.1. Business Overview
11.3.2. Company Snapshot
11.3.3. Company Market Share Analysis
11.3.4. Company Product Portfolio
11.3.5. Recent Developments
11.3.6. SWOT Analysis
11.4. KidZania
11.4.1. Business Overview
11.4.2. Company Snapshot
11.4.3. Company Market Share Analysis
11.4.4. Company Product Portfolio
11.4.5. Recent Developments
11.4.6. SWOT Analysis
11.5. Cinergy Entertainment
11.5.1. Business Overview
11.5.2. Company Snapshot
11.5.3. Company Market Share Analysis
11.5.4. Company Product Portfolio
11.5.5. Recent Developments
11.5.6. SWOT Analysis
11.6. The Walt Disney Company
11.6.1. Business Overview
11.6.2. Company Snapshot
11.6.3. Company Market Share Analysis
11.6.4. Company Product Portfolio
11.6.5. Recent Developments
11.6.6. SWOT Analysis
11.7. Scene 75 Entertainment Centers
11.7.1. Business Overview
11.7.2. Company Snapshot
11.7.3. Company Market Share Analysis
11.7.4. Company Product Portfolio
11.7.5. Recent Developments
11.7.6. SWOT Analysis
11.8. Lucky Strike Entertainment
11.8.1. Business Overview
11.8.2. Company Snapshot
11.8.3. Company Market Share Analysis
11.8.4. Company Product Portfolio
11.8.5. Recent Developments
11.8.6. SWOT Analysis
11.9. FunCity
11.9.1. Business Overview
11.9.2. Company Snapshot
11.9.3. Company Market Share Analysis
11.9.4. Company Product Portfolio
11.9.5. Recent Developments
11.9.6. SWOT Analysis
11.10. Smaaash Entertainment Pvt. Ltd.
11.10.1. Business Overview
11.10.2. Company Snapshot
11.10.3. Company Market Share Analysis
11.10.4. Company Product Portfolio
11.10.5. Recent Developments
11.10.6. SWOT Analysis
List of Table
1. Global Indoor Entertainment Center Market, By Age, 2019-2032 (USD Billion)
2. Global Age 25+, Indoor Entertainment Center Market, By Region, 2019-2032 (USD Billion)
3. Global 9-12 age, Indoor Entertainment Center Market, By Region, 2019-2032 (USD Billion)
4. Global 0-8 age, Indoor Entertainment Center Market, By Region, 2019-2032 (USD Billion)
5. Global 21-25 age, Indoor Entertainment Center Market, By Region, 2019-2032 (USD Billion)
6. Global 13-19 age, Indoor Entertainment Center Market, By Region, 2019-2032 (USD Billion)
7. Global Indoor Entertainment Center Market, By Facility Size, 2019-2032 (USD Billion)
8. Global 1 to 10 acres, Indoor Entertainment Center Market, By Region, 2019-2032 (USD Billion)
9. Global Up to 5,000 sq. ft, Indoor Entertainment Center Market, By Region, 2019-2032 (USD Billion)
10. Global 10 to 30 acres, Indoor Entertainment Center Market, By Region, 2019-2032 (USD Billion)
11. Global 10,001 to 20,000 sq. ft, Indoor Entertainment Center Market, By Region, 2019-2032 (USD Billion)
12. Global 5,001 to 10,000 sq. ft, Indoor Entertainment Center Market, By Region, 2019-2032 (USD Billion)
13. Global 20,001 to 40,000 sq. ft, Indoor Entertainment Center Market, By Region, 2019-2032 (USD Billion)
14. Global Over 30 acres, Indoor Entertainment Center Market, By Region, 2019-2032 (USD Billion)
15. Global Indoor Entertainment Center Market, By Application, 2019-2032 (USD Billion)
16. Global AR & VR Gaming Zones, Indoor Entertainment Center Market, By Region, 2019-2032 (USD Billion)
17. Global Skill/Competition Games, Indoor Entertainment Center Market, By Region, 2019-2032 (USD Billion)
18. Global Arcade Studios, Indoor Entertainment Center Market, By Region, 2019-2032 (USD Billion)
19. Global Physical Play Activities, Indoor Entertainment Center Market, By Region, 2019-2032 (USD Billion)
20. Global Others, Indoor Entertainment Center Market, By Region, 2019-2032 (USD Billion)
21. North America Indoor Entertainment Center Market, By Age, 2019-2032 (USD Billion)
22. North America Indoor Entertainment Center Market, By Facility Size, 2019-2032 (USD Billion)
23. North America Indoor Entertainment Center Market, By Application, 2019-2032 (USD Billion)
24. U.S. Indoor Entertainment Center Market, By Age, 2019-2032 (USD Billion)
25. U.S. Indoor Entertainment Center Market, By Facility Size, 2019-2032 (USD Billion)
26. U.S. Indoor Entertainment Center Market, By Application, 2019-2032 (USD Billion)
27. Canada Indoor Entertainment Center Market, By Age, 2019-2032 (USD Billion)
28. Canada Indoor Entertainment Center Market, By Facility Size, 2019-2032 (USD Billion)
29. Canada Indoor Entertainment Center Market, By Application, 2019-2032 (USD Billion)
30. Mexico Indoor Entertainment Center Market, By Age, 2019-2032 (USD Billion)
31. Mexico Indoor Entertainment Center Market, By Facility Size, 2019-2032 (USD Billion)
32. Mexico Indoor Entertainment Center Market, By Application, 2019-2032 (USD Billion)
33. Europe Indoor Entertainment Center Market, By Age, 2019-2032 (USD Billion)
34. Europe Indoor Entertainment Center Market, By Facility Size, 2019-2032 (USD Billion)
35. Europe Indoor Entertainment Center Market, By Application, 2019-2032 (USD Billion)
36. Germany Indoor Entertainment Center Market, By Age, 2019-2032 (USD Billion)
37. Germany Indoor Entertainment Center Market, By Facility Size, 2019-2032 (USD Billion)
38. Germany Indoor Entertainment Center Market, By Application, 2019-2032 (USD Billion)
39. France Indoor Entertainment Center Market, By Age, 2019-2032 (USD Billion)
40. France Indoor Entertainment Center Market, By Facility Size, 2019-2032 (USD Billion)
41. France Indoor Entertainment Center Market, By Application, 2019-2032 (USD Billion)
42. U.K. Indoor Entertainment Center Market, By Age, 2019-2032 (USD Billion)
43. U.K. Indoor Entertainment Center Market, By Facility Size, 2019-2032 (USD Billion)
44. U.K. Indoor Entertainment Center Market, By Application, 2019-2032 (USD Billion)
45. Italy Indoor Entertainment Center Market, By Age, 2019-2032 (USD Billion)
46. Italy Indoor Entertainment Center Market, By Facility Size, 2019-2032 (USD Billion)
47. Italy Indoor Entertainment Center Market, By Application, 2019-2032 (USD Billion)
48. Spain Indoor Entertainment Center Market, By Age, 2019-2032 (USD Billion)
49. Spain Indoor Entertainment Center Market, By Facility Size, 2019-2032 (USD Billion)
50. Spain Indoor Entertainment Center Market, By Application, 2019-2032 (USD Billion)
51. Asia Pacific Indoor Entertainment Center Market, By Age, 2019-2032 (USD Billion)
52. Asia Pacific Indoor Entertainment Center Market, By Facility Size, 2019-2032 (USD Billion)
53. Asia Pacific Indoor Entertainment Center Market, By Application, 2019-2032 (USD Billion)
54. Japan Indoor Entertainment Center Market, By Age, 2019-2032 (USD Billion)
55. Japan Indoor Entertainment Center Market, By Facility Size, 2019-2032 (USD Billion)
56. Japan Indoor Entertainment Center Market, By Application, 2019-2032 (USD Billion)
57. China Indoor Entertainment Center Market, By Age, 2019-2032 (USD Billion)
58. China Indoor Entertainment Center Market, By Facility Size, 2019-2032 (USD Billion)
59. China Indoor Entertainment Center Market, By Application, 2019-2032 (USD Billion)
60. India Indoor Entertainment Center Market, By Age, 2019-2032 (USD Billion)
61. India Indoor Entertainment Center Market, By Facility Size, 2019-2032 (USD Billion)
62. India Indoor Entertainment Center Market, By Application, 2019-2032 (USD Billion)
63. South America Indoor Entertainment Center Market, By Age, 2019-2032 (USD Billion)
64. South America Indoor Entertainment Center Market, By Facility Size, 2019-2032 (USD Billion)
65. South America Indoor Entertainment Center Market, By Application, 2019-2032 (USD Billion)
66. Brazil Indoor Entertainment Center Market, By Age, 2019-2032 (USD Billion)
67. Brazil Indoor Entertainment Center Market, By Facility Size, 2019-2032 (USD Billion)
68. Brazil Indoor Entertainment Center Market, By Application, 2019-2032 (USD Billion)
69. Middle East and Africa Indoor Entertainment Center Market, By Age, 2019-2032 (USD Billion)
70. Middle East and Africa Indoor Entertainment Center Market, By Facility Size, 2019-2032 (USD Billion)
71. Middle East and Africa Indoor Entertainment Center Market, By Application, 2019-2032 (USD Billion)
72. UAE Indoor Entertainment Center Market, By Age, 2019-2032 (USD Billion)
73. UAE Indoor Entertainment Center Market, By Facility Size, 2019-2032 (USD Billion)
74. UAE Indoor Entertainment Center Market, By Application, 2019-2032 (USD Billion)
75. South Africa Indoor Entertainment Center Market, By Age, 2019-2032 (USD Billion)
76. South Africa Indoor Entertainment Center Market, By Facility Size, 2019-2032 (USD Billion)
77. South Africa Indoor Entertainment Center Market, By Application, 2019-2032 (USD Billion)
List of Figures
1. Global Indoor Entertainment Center Market Segmentation
2. Global Indoor Entertainment Center Market: Research Methodology
3. Market Size Estimation Methodology: Bottom-Up Approach
4. Market Size Estimation Methodology: Top-Down Approach
5. Data Triangulation
6. Porter’s Five Forces Analysis
7. Value Chain Analysis
8. Global Indoor Entertainment Center Market Attractiveness Analysis by Age
9. Global Indoor Entertainment Center Market Attractiveness Analysis by Facility Size
10. Global Indoor Entertainment Center Market Attractiveness Analysis by Application
11. Global Indoor Entertainment Center Market Attractiveness Analysis by Region
12. Global Indoor Entertainment Center Market: Dynamics
13. Global Indoor Entertainment Center Market Share by Age (2023 & 2032)
14. Global Indoor Entertainment Center Market Share by Facility Size (2023 & 2032)
15. Global Indoor Entertainment Center Market Share by Application (2023 & 2032)
16. Global Indoor Entertainment Center Market Share by Regions (2023 & 2032)
17. Global Indoor Entertainment Center Market Share by Company (2022)
This study forecasts global, regional, and country revenue from 2019 to 2032. Brainy Insights has segmented the global indoor entertainment center market based on the below-mentioned segments:
Global Indoor Entertainment Center Market By Age:
Global Indoor Entertainment Center Market By Facility Size:
Global Indoor Entertainment Center Market By Application:
Global Indoor Entertainment Center Market By Region:
Research has its special purpose to undertake marketing efficiently. In this competitive scenario, businesses need information across all industry verticals; the information about customer wants, market demand, competition, industry trends, distribution channels etc. This information needs to be updated regularly because businesses operate in a dynamic environment. Our organization, The Brainy Insights incorporates scientific and systematic research procedures in order to get proper market insights and industry analysis for overall business success. The analysis consists of studying the market from a miniscule level wherein we implement statistical tools which helps us in examining the data with accuracy and precision.
Our research reports feature both; quantitative and qualitative aspects for any market. Qualitative information for any market research process are fundamental because they reveal the customer needs and wants, usage and consumption for any product/service related to a specific industry. This in turn aids the marketers/investors in knowing certain perceptions of the customers. Qualitative research can enlighten about the different product concepts and designs along with unique service offering that in turn, helps define marketing problems and generate opportunities. On the other hand, quantitative research engages with the data collection process through interviews, e-mail interactions, surveys and pilot studies. Quantitative aspects for the market research are useful to validate the hypotheses generated during qualitative research method, explore empirical patterns in the data with the help of statistical tools, and finally make the market estimations.
The Brainy Insights offers comprehensive research and analysis, based on a wide assortment of factual insights gained through interviews with CXOs and global experts and secondary data from reliable sources. Our analysts and industry specialist assume vital roles in building up statistical tools and analysis models, which are used to analyse the data and arrive at accurate insights with exceedingly informative research discoveries. The data provided by our organization have proven precious to a diverse range of companies, facilitating them to address issues such as determining which products/services are the most appealing, whether or not customers use the product in the manner anticipated, the purchasing intentions of the market and many others.
Our research methodology encompasses an idyllic combination of primary and secondary initiatives. Key phases involved in this process are listed below:

The phase involves the gathering and collecting of market data and its related information with the help of different sources & research procedures.

The data procurement stage involves in data gathering and collecting through various data sources.
This stage involves in extensive research. These data sources includes:
Purchased Database: Purchased databases play a crucial role in estimating the market sizes irrespective of the domain. Our purchased database includes:
Primary Research: The Brainy Insights interacts with leading companies and experts of the concerned domain to develop the analyst team’s market understanding and expertise. It improves and substantiates every single data presented in the market reports. Primary research mainly involves in telephonic interviews, E-mail interactions and face-to-face interviews with the raw material providers, manufacturers/producers, distributors, & independent consultants. The interviews that we conduct provides valuable data on market size and industry growth trends prevailing in the market. Our organization also conducts surveys with the various industry experts in order to gain overall insights of the industry/market. For instance, in healthcare industry we conduct surveys with the pharmacists, doctors, surgeons and nurses in order to gain insights and key information of a medical product/device/equipment which the customers are going to usage. Surveys are conducted in the form of questionnaire designed by our own analyst team. Surveys plays an important role in primary research because surveys helps us to identify the key target audiences of the market. Additionally, surveys helps to identify the key target audience engaged with the market. Our survey team conducts the survey by targeting the key audience, thus gaining insights from them. Based on the perspectives of the customers, this information is utilized to formulate market strategies. Moreover, market surveys helps us to understand the current competitive situation of the industry. To be precise, our survey process typically involve with the 360 analysis of the market. This analytical process begins by identifying the prospective customers for a product or service related to the market/industry to obtain data on how a product/service could fit into customers’ lives.

Secondary Research: The secondary data sources includes information published by the on-profit organizations such as World bank, WHO, company fillings, investor presentations, annual reports, national government documents, statistical databases, blogs, articles, white papers and others. From the annual report, we analyse a company’s revenue to understand the key segment and market share of that organization in a particular region. We analyse the company websites and adopt the product mapping technique which is important for deriving the segment revenue. In the product mapping method, we select and categorize the products offered by the companies catering to domain specific market, deduce the product revenue for each of the companies so as to get overall estimation of the market size. We also source data and analyses trends based on information received from supply side and demand side intermediaries in the value chain. The supply side denotes the data gathered from supplier, distributor, wholesaler and the demand side illustrates the data gathered from the end customers for respective market domain.

The supply side for a domain specific market is analysed by:
The demand side for the market is estimated through:
In-house Library: Apart from these third-party sources, we have our in-house library of qualitative and quantitative information. Our in-house database includes market data for various industry and domains. These data are updated on regular basis as per the changing market scenario. Our library includes, historic databases, internal audit reports and archives.
Sometimes there are instances where there is no metadata or raw data available for any domain specific market. For those cases, we use our expertise to forecast and estimate the market size in order to generate comprehensive data sets. Our analyst team adopt a robust research technique in order to produce the estimates:
Data Synthesis: This stage involves the analysis & mapping of all the information obtained from the previous step. It also involves in scrutinizing the data for any discrepancy observed while data gathering related to the market. The data is collected with consideration to the heterogeneity of sources. Robust scientific techniques are in place for synthesizing disparate data sets and provide the essential contextual information that can orient market strategies. The Brainy Insights has extensive experience in data synthesis where the data passes through various stages:


Market Deduction & Formulation: The final stage comprises of assigning data points at appropriate market spaces so as to deduce feasible conclusions. Analyst perspective & subject matter expert based holistic form of market sizing coupled with industry analysis also plays a crucial role in this stage.
This stage involves in finalization of the market size and numbers that we have collected from data integration step. With data interpolation, it is made sure that there is no gap in the market data. Successful trend analysis is done by our analysts using extrapolation techniques, which provide the best possible forecasts for the market.
Data Validation & Market Feedback: Validation is the most important step in the process. Validation & re-validation via an intricately designed process helps us finalize data-points to be used for final calculations.

The Brainy Insights interacts with leading companies and experts of the concerned domain to develop the analyst team’s market understanding and expertise. It improves and substantiates every single data presented in the market reports. The data validation interview and discussion panels are typically composed of the most experienced industry members. The participants include, however, are not limited to:
Moreover, we always validate our data and findings through primary respondents from all the major regions we are working on.


Free Customization
Fortune 500 Clients
Free Yearly Update On Purchase Of Multi/Corporate License
Companies Served Till Date