- +1-315-215-1633
- sales@thebrainyinsights.com

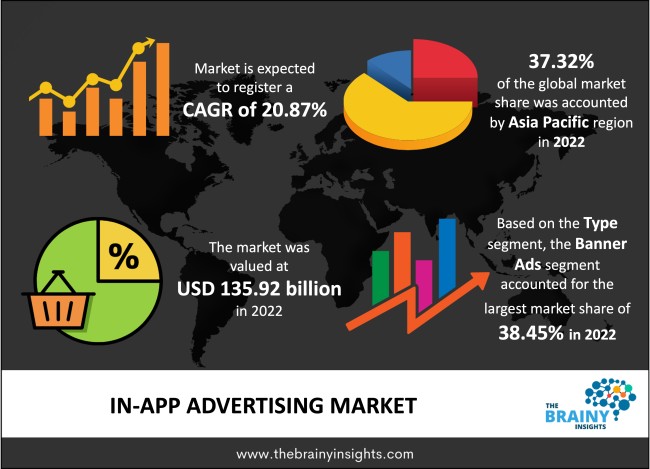
The global In-app Advertising market was valued at USD 135.92 Billion in 2022 and growing at a CAGR of 20.87% from 2023 to 2032. The market is expected to reach USD 904.61 Billion by 2032. These days, in-app ads are getting popular as they help boost user engagement rates and offer several benefits for mobile marketers. Based on one of the studies in 2021, the spending on the mobile ad has reached around USD 341.18 Billion, which could be around 40% of the total ad expenditure. In-app ads can be engaging with its broad range of formats. It offers a user-friendly experience without any interference. Such advertising asks advertisers to utilize advanced targeting technologies, which means payment is for the categories of users who might be interested in the ad. The owners of the application keep the control independently. They choose the advertisers and set the minimum price. The mobile device owners generally don’t have a problem watching short videos before the launch of an app or using some features for free.
In-app advertising is the provision in which ads appear in the application targeting consumers or end users. These advertisements can generate revenue for the app developers along with the promotion of the brand for the advertiser. Thus, the advertisement within the apps can be said to be the method for generating income in free apps. App owners hence integrate the commercials in their apps to generate profits. This type of advertising helps the advertiser display several types of commercials, like banners and pop videos, among others, to target their audience. This concept is getting popular due to a surge in the demand for mobile device-based advertising among many industry sectors like entertainment, education and retail, among others. It has become a crucial strategy for publishers looking to earn money using mobile content. In the present scenario, it has become necessary that publishers must consider mobile ads when they are planning for any campaign. It would lead to positive outcomes that boost their in-app experience along with the success of the in-app advertising. Based on one of the studies in North America, around 26% of the total media time or 88% of the mobile time is spent on apps. It is eventually driving the in-app advertising market. In-app advertising is anticipated to become the primary medium in digital advertising and holds for more than 55% of global advertising spending. The video medium has become the key for advertisers with the growing popularity of mediums like YouTube Shorts and TikTok. Based on another study, in 2022, around 142.6 billion apps and games were downloaded, and Google Play was accountable for 110.1 Billion apps, and the remnant was of IOS. In this, around 97% of the apps in the Google Play Store and 95.5% in the Apple App Store are freely available. Large numbers of users like to use free apps and are a little hesitant to use paid apps. For free apps, the developers generally go for certain app monetization plans that can generate capital for them. Ads displayed at the proper time and the right place are generally well interacted, which results in a higher level of customer loyalty and, hence, higher revenue earnings and several engaged users.
Get an overview of this study by requesting a free sample
Increase in the number of smartphone users – The number of smartphone users has increased. Based on one of the studies in 2019, the number of smartphone users has increased to more than 3 Billion worldwide. It was estimated that by 2021, almost half of the population of Earth would likely have a smartphone. In the US in 2019, the number of people who spent more time looking at or using mobile devices was more than the number of people watching television. People spend most of their time using smartphones due to an increase in the number of apps. Hence, marketers to reach their target audiences depend on mobile and integrating apps in their marketing and advertising strategies. Based on another study in 2015, mobile devices accounted for around 51% of the consumers’ total time spent in digital media. These factors are eventually driving the in-app advertising market.
Cases of ad fraud – One of the common concerns for advertisers is Ad fraud, and it is there even in in-app advertising. Ad stacking, false impressions and fake clicks, among others, are some of the common malpractices. Publishers are also encountering another kind of ad fraud that generally comes from unethical advertisers. Also, there is ad-blocking software. All these factors are eventually acting as restraints for the In-app Advertising market.
Increase in the number of apps – App use has become very common in people’s lives for entertainment, communication, gaming, retail and dating, among others. Several apps are available on mobile devices, so the user is spending more time on apps. Based on one of the studies, around 88% of mobile usage time is not spent on apps, and consumers are spending an average of around 5.5 hours per day on apps on their smartphones, which is bringing opportunities to both publishers and marketers. Another study suggests that US advertisers spend almost a quarter of mobile ad budgets on video, with a significant portion allocated to video ads on social media such as Instagram. Facebook, TikTok and Snapchat. All these factors eventually drive the In-app Advertising market in the forecasting period.
The regions analyzed for the market include North America, Europe, South America, Asia Pacific, the Middle East, and Africa. Asia Pacific emerged as the largest market for the global In-app Advertising market, with a 37.32% share of the market revenue in 2022. This share is attributed to the growing Chinese market. More than a quarter of the global smartphone users are from China, spending more than 99% of their time on apps. The mobile advertising infrastructure is expanding in China and other regional emerging economies, like India and Indonesia. It offers big opportunities for advertisers to capitalize on the in-app advertising market in the region. Also, the Asia Pacific region accounted for more than 45% per cent of global app downloads. These factors are propelling the growth of the market in the region.
Asia Pacific Region In-app Advertising Market Share in 2022 - 37.32%
www.thebrainyinsights.com
Check the geographical analysis of this market by requesting a free sample
The type segment is divided into banner ads, interstitial ads, rich media ads, video ads and native ads. The banner ads segment dominated the market, with a market share of around 38.45% in 2022. It is a leading ad format. Advertisers, ad networks and services often add new banner formats to expand their impact. The most common are the expandable banners, which must be tapped or pulled on a corner. Banner ads are very effective due to their minimal pictures, suitable texts and consistent colours.
The platform segment is divided into android, IOS and others. The android segment dominated the market, with a market share of around 67.66% in 2022. This market share is due to factors like the growing adoption of smartphones in the developing countries of the Asia Pacific region like China and India. Moreover, Android is an open-source operating system; several devices can run on the Android platform. IOS only runs on Apple devices.
The application segment is divided into entertainment, social, gaming, online shopping, news and others. The entertainment segment dominated the market, with a market share of around 25.47% in 2022. The entertainment segment, which includes OTT platforms, is growing in demand. Advertisers use such apps to target their audience by using information like age, location, gender, viewing habits and demographics, among others. It enhances the performance of the advertising campaigns.
| Attribute | Description |
|---|---|
| Market Size | Revenue (USD Billion) |
| Market size value in 2022 | USD 135.92 Billion |
| Market size value in 2032 | USD 904.61 Billion |
| CAGR (2023 to 2032) | 20.87% |
| Historical data | 2019-2021 |
| Base Year | 2022 |
| Forecast | 2023-2032 |
| Region | The regions analyzed for the market are Asia Pacific, Europe, South America, North America, and Middle East & Africa. Furthermore, the regions are further analyzed at the country level. |
| Segments | Type, Platform and Application |
Asia Pacific region emerged as the largest market for the In-app Advertising.
The market's growth will be influenced by increase in the number of smartphone users.
Cases of ad fraud could hamper the market growth.
Increase in the number of apps will provide huge opportunities to the market.
Key players are InMobi, ironSource (Unity Software Inc.), Chartboost, Inc, Google AdMob (Google LLC), Leadbolt, Flurry (Yahoo Inc.), TUNE, Inc., Amobee, Inc., BYYD Inc, Smaato, Inc., AppLovin and Glispa GmbH among others.
1. Introduction
1.1. Objectives of the Study
1.2. Market Definition
1.3. Research Scope
1.4. Currency
1.5. Key Target Audience
2. Research Methodology and Assumptions
3. Executive Summary
4. Premium Insights
4.1. Porter’s Five Forces Analysis
4.2. Value Chain Analysis
4.3. Top Investment Pockets
4.3.1. Market Attractiveness Analysis By Type
4.3.2. Market Attractiveness Analysis By Platform
4.3.3. Market Attractiveness Analysis By Application
4.3.4. Market Attractiveness Analysis By Region
4.4. Industry Trends
5. Market Dynamics
5.1. Market Evaluation
5.2. Drivers
5.2.1. Increase in the number of smartphone users
5.3. Restraints
5.3.1. Cases of ad fraud
5.4. Opportunities
5.4.1. Increase in the number of apps
5.5. Challenges
5.5.1. Economic slowdown
6. Global In-app Advertising Market Analysis and Forecast, By Type
6.1. Segment Overview
6.2. Banner Ads
6.3. Interstitial Ads
6.4. Rich Media Ads
6.5. Video Ads
6.6. Native Ads
7. Global In-app Advertising Market Analysis and Forecast, By Platform
7.1. Segment Overview
7.2. Android
7.3. IOS
7.4. Others
8. Global In-app Advertising Market Analysis and Forecast, By Application
8.1. Segment Overview
8.2. Entertainment
8.3. Social
8.4. Gaming
8.5. Online Shopping
8.6. News
8.7. Others
9. Global In-app Advertising Market Analysis and Forecast, By Regional Analysis
9.1. Segment Overview
9.2. North America
9.2.1. U.S.
9.2.2. Canada
9.2.3. Mexico
9.3. Europe
9.3.1. Germany
9.3.2. France
9.3.3. U.K.
9.3.4. Italy
9.3.5. Spain
9.4. Asia-Pacific
9.4.1. Japan
9.4.2. China
9.4.3. India
9.5. South America
9.5.1. Brazil
9.6. Middle East and Africa
9.6.1. UAE
9.6.2. South Africa
10. Global In-app Advertising Market-Competitive Landscape
10.1. Overview
10.2. Market Share of Key Players in Global In-app Advertising Market
10.2.1. Global Company Market Share
10.2.2. North America Company Market Share
10.2.3. Europe Company Market Share
10.2.4. APAC Company Market Share
10.3. Competitive Situations and Trends
10.3.1. Type Launches and Developments
10.3.2. Partnerships, Collaborations, and Agreements
10.3.3. Mergers & Acquisitions
10.3.4. Expansions
11. Company Profiles
11.1. InMobi
11.1.1. Business Overview
11.1.2. Company Snapshot
11.1.3. Company Market Share Analysis
11.1.4. Company Type Portfolio
11.1.5. Recent Developments
11.1.6. SWOT Analysis
11.2. ironSource (Unity Software Inc.)
11.2.1. Business Overview
11.2.2. Company Snapshot
11.2.3. Company Market Share Analysis
11.2.4. Company Type Portfolio
11.2.5. Recent Developments
11.2.6. SWOT Analysis
11.3. Chartboost, Inc
11.3.1. Business Overview
11.3.2. Company Snapshot
11.3.3. Company Market Share Analysis
11.3.4. Company Type Portfolio
11.3.5. Recent Developments
11.3.6. SWOT Analysis
11.4. Google AdMob (Google LLC)
11.4.1. Business Overview
11.4.2. Company Snapshot
11.4.3. Company Market Share Analysis
11.4.4. Company Type Portfolio
11.4.5. Recent Developments
11.4.6. SWOT Analysis
11.5. Leadbolt
11.5.1. Business Overview
11.5.2. Company Snapshot
11.5.3. Company Market Share Analysis
11.5.4. Company Type Portfolio
11.5.5. Recent Developments
11.5.6. SWOT Analysis
11.6. Flurry (Yahoo Inc.)
11.6.1. Business Overview
11.6.2. Company Snapshot
11.6.3. Company Market Share Analysis
11.6.4. Company Type Portfolio
11.6.5. Recent Developments
11.6.6. SWOT Analysis
11.7. TUNE, Inc.
11.7.1. Business Overview
11.7.2. Company Snapshot
11.7.3. Company Market Share Analysis
11.7.4. Company Type Portfolio
11.7.5. Recent Developments
11.7.6. SWOT Analysis
11.8. Amobee, Inc.
11.8.1. Business Overview
11.8.2. Company Snapshot
11.8.3. Company Market Share Analysis
11.8.4. Company Type Portfolio
11.8.5. Recent Developments
11.8.6. SWOT Analysis
11.9. BYYD Inc
11.9.1. Business Overview
11.9.2. Company Snapshot
11.9.3. Company Market Share Analysis
11.9.4. Company Type Portfolio
11.9.5. Recent Developments
11.9.6. SWOT Analysis
11.10. Smaato, Inc.
11.10.1. Business Overview
11.10.2. Company Snapshot
11.10.3. Company Market Share Analysis
11.10.4. Company Type Portfolio
11.10.5. Recent Developments
11.10.6. SWOT Analysis
11.11. AppLovin
11.11.1. Business Overview
11.11.2. Company Snapshot
11.11.3. Company Market Share Analysis
11.11.4. Company Type Portfolio
11.11.5. Recent Developments
11.11.6. SWOT Analysis
11.12. Glispa GmbH
11.12.1. Business Overview
11.12.2. Company Snapshot
11.12.3. Company Market Share Analysis
11.12.4. Company Type Portfolio
11.12.5. Recent Developments
11.12.6. SWOT Analysis
List of Table
1. Global In-app Advertising Market, By Type, 2019-2032 (USD Billion)
2. Global Banner Ads, In-app Advertising Market, By Region, 2019-2032 (USD Billion)
3. Global Interstitial Ads, In-app Advertising Market, By Region, 2019-2032 (USD Billion)
4. Global Rich Media Ads, In-app Advertising Market, By Region, 2019-2032 (USD Billion)
5. Global Video Ads, In-app Advertising Market, By Region, 2019-2032 (USD Billion)
6. Global Native Ads, In-app Advertising Market, By Region, 2019-2032 (USD Billion)
7. Global In-app Advertising Market, By Platform, 2019-2032 (USD Billion)
8. Global Android, In-app Advertising Market, By Region, 2019-2032 (USD Billion)
9. Global IOS, In-app Advertising Market, By Region, 2019-2032 (USD Billion)
10. Global Others, In-app Advertising Market, By Region, 2019-2032 (USD Billion)
11. Global In-app Advertising Market, By Application, 2019-2032 (USD Billion)
12. Global Entertainment, In-app Advertising Market, By Region, 2019-2032 (USD Billion)
13. Global Social, In-app Advertising Market, By Region, 2019-2032 (USD Billion)
14. Global Gaming, In-app Advertising Market, By Region, 2019-2032 (USD Billion)
15. Global Online Shopping, In-app Advertising Market, By Region, 2019-2032 (USD Billion)
16. Global News, In-app Advertising Market, By Region, 2019-2032 (USD Billion)
17. Global Others, In-app Advertising Market, By Region, 2019-2032 (USD Billion)
18. North America In-app Advertising Market, By Type, 2019-2032 (USD Billion)
19. North America In-app Advertising Market, By Platform, 2019-2032 (USD Billion)
20. North America In-app Advertising Market, By Application, 2019-2032 (USD Billion)
21. U.S. In-app Advertising Market, By Type, 2019-2032 (USD Billion)
22. U.S. In-app Advertising Market, By Platform, 2019-2032 (USD Billion)
23. U.S. In-app Advertising Market, By Application, 2019-2032 (USD Billion)
24. Canada In-app Advertising Market, By Type, 2019-2032 (USD Billion)
25. Canada In-app Advertising Market, By Platform, 2019-2032 (USD Billion)
26. Canada In-app Advertising Market, By Application, 2019-2032 (USD Billion)
27. Mexico In-app Advertising Market, By Type, 2019-2032 (USD Billion)
28. Mexico In-app Advertising Market, By Platform, 2019-2032 (USD Billion)
29. Mexico In-app Advertising Market, By Application, 2019-2032 (USD Billion)
30. Europe In-app Advertising Market, By Type, 2019-2032 (USD Billion)
31. Europe In-app Advertising Market, By Platform, 2019-2032 (USD Billion)
32. Europe In-app Advertising Market, By Application, 2019-2032 (USD Billion)
33. Germany In-app Advertising Market, By Type, 2019-2032 (USD Billion)
34. Germany In-app Advertising Market, By Platform, 2019-2032 (USD Billion)
35. Germany In-app Advertising Market, By Application, 2019-2032 (USD Billion)
36. France In-app Advertising Market, By Type, 2019-2032 (USD Billion)
37. France In-app Advertising Market, By Platform, 2019-2032 (USD Billion)
38. France In-app Advertising Market, By Application, 2019-2032 (USD Billion)
39. U.K. In-app Advertising Market, By Type, 2019-2032 (USD Billion)
40. U.K. In-app Advertising Market, By Platform, 2019-2032 (USD Billion)
41. U.K. In-app Advertising Market, By Application, 2019-2032 (USD Billion)
42. Italy In-app Advertising Market, By Type, 2019-2032 (USD Billion)
43. Italy In-app Advertising Market, By Platform, 2019-2032 (USD Billion)
44. Italy In-app Advertising Market, By Application, 2019-2032 (USD Billion)
45. Spain In-app Advertising Market, By Type, 2019-2032 (USD Billion)
46. Spain In-app Advertising Market, By Platform, 2019-2032 (USD Billion)
47. Spain In-app Advertising Market, By Application, 2019-2032 (USD Billion)
48. Asia Pacific In-app Advertising Market, By Type, 2019-2032 (USD Billion)
49. Asia Pacific In-app Advertising Market, By Platform, 2019-2032 (USD Billion)
50. Asia Pacific In-app Advertising Market, By Application, 2019-2032 (USD Billion)
51. Japan In-app Advertising Market, By Type, 2019-2032 (USD Billion)
52. Japan In-app Advertising Market, By Platform, 2019-2032 (USD Billion)
53. Japan In-app Advertising Market, By Application, 2019-2032 (USD Billion)
54. China In-app Advertising Market, By Type, 2019-2032 (USD Billion)
55. China In-app Advertising Market, By Platform, 2019-2032 (USD Billion)
56. China In-app Advertising Market, By Application, 2019-2032 (USD Billion)
57. India In-app Advertising Market, By Type, 2019-2032 (USD Billion)
58. India In-app Advertising Market, By Platform, 2019-2032 (USD Billion)
59. India In-app Advertising Market, By Application, 2019-2032 (USD Billion)
60. South America In-app Advertising Market, By Type, 2019-2032 (USD Billion)
61. South America In-app Advertising Market, By Platform, 2019-2032 (USD Billion)
62. South America In-app Advertising Market, By Application, 2019-2032 (USD Billion)
63. Brazil In-app Advertising Market, By Type, 2019-2032 (USD Billion)
64. Brazil In-app Advertising Market, By Platform, 2019-2032 (USD Billion)
65. Brazil In-app Advertising Market, By Application, 2019-2032 (USD Billion)
66. Middle East and Africa In-app Advertising Market, By Type, 2019-2032 (USD Billion)
67. Middle East and Africa In-app Advertising Market, By Platform, 2019-2032 (USD Billion)
68. Middle East and Africa In-app Advertising Market, By Application, 2019-2032 (USD Billion)
69. UAE In-app Advertising Market, By Type, 2019-2032 (USD Billion)
70. UAE In-app Advertising Market, By Platform, 2019-2032 (USD Billion)
71. UAE In-app Advertising Market, By Application, 2019-2032 (USD Billion)
72. South Africa In-app Advertising Market, By Type, 2019-2032 (USD Billion)
73. South Africa In-app Advertising Market, By Platform, 2019-2032 (USD Billion)
74. South Africa In-app Advertising Market, By Application, 2019-2032 (USD Billion)
List of Figures
1. Global In-app Advertising Market Segmentation
2. Global In-app Advertising Market: Research Methodology
3. Market Size Estimation Methodology: Bottom-Up Approach
4. Market Size Estimation Methodology: Top-Down Approach
5. Data Triangulation
6. Porter’s Five Forces Analysis
7. Value Chain Analysis
8. Global In-app Advertising Market Attractiveness Analysis By Type
9. Global In-app Advertising Market Attractiveness Analysis By Platform
10. Global In-app Advertising Market Attractiveness Analysis By Application
11. Global In-app Advertising Market Attractiveness Analysis By Region
12. Global In-app Advertising Market: Dynamics
13. Global In-app Advertising Market Share By Type (2023 & 2032)
14. Global In-app Advertising Market Share By Platform (2023 & 2032)
15. Global In-app Advertising Market Share By Application (2023 & 2032)
16. Global In-app Advertising Market Share By Regions (2023 & 2032)
17. Global In-app Advertising Market Share By Company (2022)
This study forecasts revenue at global, regional, and country levels from 2019 to 2032. The Brainy Insights has segmented the global In-app Advertising market based on below mentioned segments:
Global In-app Advertising Market by Type:
Global In-app Advertising Market by Platform:
Global In-app Advertising Market by Application:
Global In-app Advertising by Region:
Research has its special purpose to undertake marketing efficiently. In this competitive scenario, businesses need information across all industry verticals; the information about customer wants, market demand, competition, industry trends, distribution channels etc. This information needs to be updated regularly because businesses operate in a dynamic environment. Our organization, The Brainy Insights incorporates scientific and systematic research procedures in order to get proper market insights and industry analysis for overall business success. The analysis consists of studying the market from a miniscule level wherein we implement statistical tools which helps us in examining the data with accuracy and precision.
Our research reports feature both; quantitative and qualitative aspects for any market. Qualitative information for any market research process are fundamental because they reveal the customer needs and wants, usage and consumption for any product/service related to a specific industry. This in turn aids the marketers/investors in knowing certain perceptions of the customers. Qualitative research can enlighten about the different product concepts and designs along with unique service offering that in turn, helps define marketing problems and generate opportunities. On the other hand, quantitative research engages with the data collection process through interviews, e-mail interactions, surveys and pilot studies. Quantitative aspects for the market research are useful to validate the hypotheses generated during qualitative research method, explore empirical patterns in the data with the help of statistical tools, and finally make the market estimations.
The Brainy Insights offers comprehensive research and analysis, based on a wide assortment of factual insights gained through interviews with CXOs and global experts and secondary data from reliable sources. Our analysts and industry specialist assume vital roles in building up statistical tools and analysis models, which are used to analyse the data and arrive at accurate insights with exceedingly informative research discoveries. The data provided by our organization have proven precious to a diverse range of companies, facilitating them to address issues such as determining which products/services are the most appealing, whether or not customers use the product in the manner anticipated, the purchasing intentions of the market and many others.
Our research methodology encompasses an idyllic combination of primary and secondary initiatives. Key phases involved in this process are listed below:

The phase involves the gathering and collecting of market data and its related information with the help of different sources & research procedures.

The data procurement stage involves in data gathering and collecting through various data sources.
This stage involves in extensive research. These data sources includes:
Purchased Database: Purchased databases play a crucial role in estimating the market sizes irrespective of the domain. Our purchased database includes:
Primary Research: The Brainy Insights interacts with leading companies and experts of the concerned domain to develop the analyst team’s market understanding and expertise. It improves and substantiates every single data presented in the market reports. Primary research mainly involves in telephonic interviews, E-mail interactions and face-to-face interviews with the raw material providers, manufacturers/producers, distributors, & independent consultants. The interviews that we conduct provides valuable data on market size and industry growth trends prevailing in the market. Our organization also conducts surveys with the various industry experts in order to gain overall insights of the industry/market. For instance, in healthcare industry we conduct surveys with the pharmacists, doctors, surgeons and nurses in order to gain insights and key information of a medical product/device/equipment which the customers are going to usage. Surveys are conducted in the form of questionnaire designed by our own analyst team. Surveys plays an important role in primary research because surveys helps us to identify the key target audiences of the market. Additionally, surveys helps to identify the key target audience engaged with the market. Our survey team conducts the survey by targeting the key audience, thus gaining insights from them. Based on the perspectives of the customers, this information is utilized to formulate market strategies. Moreover, market surveys helps us to understand the current competitive situation of the industry. To be precise, our survey process typically involve with the 360 analysis of the market. This analytical process begins by identifying the prospective customers for a product or service related to the market/industry to obtain data on how a product/service could fit into customers’ lives.

Secondary Research: The secondary data sources includes information published by the on-profit organizations such as World bank, WHO, company fillings, investor presentations, annual reports, national government documents, statistical databases, blogs, articles, white papers and others. From the annual report, we analyse a company’s revenue to understand the key segment and market share of that organization in a particular region. We analyse the company websites and adopt the product mapping technique which is important for deriving the segment revenue. In the product mapping method, we select and categorize the products offered by the companies catering to domain specific market, deduce the product revenue for each of the companies so as to get overall estimation of the market size. We also source data and analyses trends based on information received from supply side and demand side intermediaries in the value chain. The supply side denotes the data gathered from supplier, distributor, wholesaler and the demand side illustrates the data gathered from the end customers for respective market domain.

The supply side for a domain specific market is analysed by:
The demand side for the market is estimated through:
In-house Library: Apart from these third-party sources, we have our in-house library of qualitative and quantitative information. Our in-house database includes market data for various industry and domains. These data are updated on regular basis as per the changing market scenario. Our library includes, historic databases, internal audit reports and archives.
Sometimes there are instances where there is no metadata or raw data available for any domain specific market. For those cases, we use our expertise to forecast and estimate the market size in order to generate comprehensive data sets. Our analyst team adopt a robust research technique in order to produce the estimates:
Data Synthesis: This stage involves the analysis & mapping of all the information obtained from the previous step. It also involves in scrutinizing the data for any discrepancy observed while data gathering related to the market. The data is collected with consideration to the heterogeneity of sources. Robust scientific techniques are in place for synthesizing disparate data sets and provide the essential contextual information that can orient market strategies. The Brainy Insights has extensive experience in data synthesis where the data passes through various stages:


Market Deduction & Formulation: The final stage comprises of assigning data points at appropriate market spaces so as to deduce feasible conclusions. Analyst perspective & subject matter expert based holistic form of market sizing coupled with industry analysis also plays a crucial role in this stage.
This stage involves in finalization of the market size and numbers that we have collected from data integration step. With data interpolation, it is made sure that there is no gap in the market data. Successful trend analysis is done by our analysts using extrapolation techniques, which provide the best possible forecasts for the market.
Data Validation & Market Feedback: Validation is the most important step in the process. Validation & re-validation via an intricately designed process helps us finalize data-points to be used for final calculations.

The Brainy Insights interacts with leading companies and experts of the concerned domain to develop the analyst team’s market understanding and expertise. It improves and substantiates every single data presented in the market reports. The data validation interview and discussion panels are typically composed of the most experienced industry members. The participants include, however, are not limited to:
Moreover, we always validate our data and findings through primary respondents from all the major regions we are working on.


Free Customization
Fortune 500 Clients
Free Yearly Update On Purchase Of Multi/Corporate License
Companies Served Till Date