- +1-315-215-1633
- sales@thebrainyinsights.com

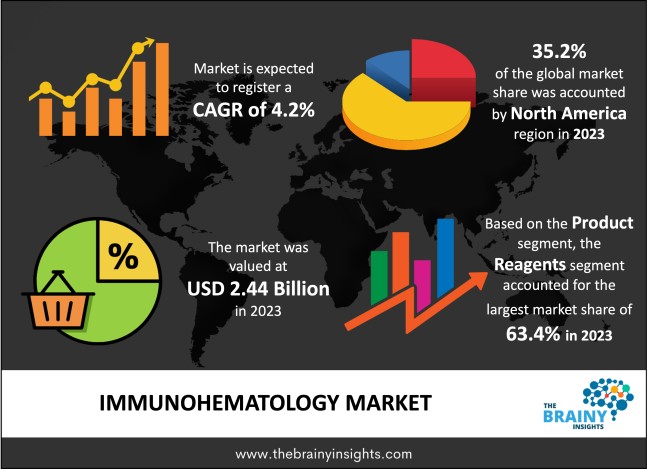
Global immunohematology market is expected to reach USD 3.53 billion by 2033, at a CAGR of 4.2% from 2023 to 2033. Global Immunohematology market is witnessing a considerable growth owing to low operating costs, and environmental friendliness of pipeline transportation. Blood banking, also called immunohematology or transfusion medicine, is a specialized discipline within laboratory science that concentrates on blood group and antibody analysis associated with transfusions. It encompasses identifying and characterizing antigens found in red blood cell surfaces and the corresponding antibodies in plasma. The primary objective of this field involves secure and compatible transmission by matching donor blood type to recipient blood type, preventing adverse reactions. This area assumes an important role in transplantations, therapy for hematologic disorders, and managing safe practices related to transfusions overall. Immunohematologists utilize both serological techniques and molecular methods when conducting tests like crossmatching procedures for typing purposes, ensuring effective measures for safety among recipients undergoing such interventions involving donated (transfused) blood products.
Immunohematology usually known as blood banking is a division of hematology which studies antigen-antibody reactions and analogous phenomena as they connect to the pathogenesis and clinical manifestations of blood disorders. A person working in this field is referred to as an immunohematologist. Their day-to-day responsibilities include blood typing, cross-matching and antibody identification. Immunohematology and Transfusion Medicine is a medical post graduate field in many countries. The specialist Immunohematology and Transfusion Physician offers expert opinion for difficult transfusions, massive transfusions, incompatibility work up, therapeutic plasmapheresis, cellular therapy, leukoreduced and washed blood products, irradiated blood therapy, stem cell procedures, platelet rich plasma therapies, HLA and cord blood banking. Other research avenues are in the arena of stem cell researches, regenerative medicine and cellular therapy. High occurrence of hematological diseases, surging number of trauma cases, increasing demand for platelets, plasma factors & immunoglobin, and increased consciousness regarding the significance of blood-transfusion related diseases & medical care are the key factors boosting the market growth. Government and private institutions are investing significantly in the development of blood banks. This would surge the demand for immunohematology devices, thereby favorably impacting market growth. Lately, rapid technological developments in immunohematology have directed the way for the development of a diagnostic approach in the direction of, in vitro study of compatibility between the donor’s and receiver’s blood. Some of the key technological advancement include automation of the immunohematology devices, developed testing devices, and new transfusion techniques. The fully automated immunohematology devices execute blood screening tests and deliver accurate results and further simplifying the identification process. Advanced antiglobulin screening instruments and assays confirm for proper blood typing. These progress have allowed clinics and hospitals to deliver emergency assistance. The companies are concentrating on improving the safety and longevity of blood stored in blood banks by updating advanced immunohematology devices. Features such as high initial investments, inadequate reimbursements of high-tech devices, and lack of awareness of technologically advanced devices in developed and developing countries hamper the market growth worldwide.
Get an overview of this study by requesting a free sample
Growing awareness about the importance of blood transfusion for saving the life of patients is boosting blood donation activities across the globe, which continues to play the major driver for the growth of the immunohematology market. In last few years, global events associated with blood collection, processing, testing, and storage have touched new heights. This makes a huge demand for immunohematology devices across the world, boosting growth of the immunohematology market.
Increase in the cases of hematological diseases, surge in the number of trauma cases, increase in demand for platelets, plasma factors and immunoglobin, and increased awareness regarding the importance of blood-transfusion related diseases & medical care are the important factors augmenting the market growth. Government and private institutions are investing significantly in the development of blood banks. This would increase the demand for immunohematology devices, thereby favorably impacting market growth.
Though the clinical laboratory industry is witnessing incremental growth, reimbursement limitations of high-tech equipment, including immunohematology devices such as analyzer and reagents, are putting major restraint for market players. High cost of immunohematology devices generate needs for end-users to make high initial investments, which is limiting the sales of new immunohematology devices. As most laboratories, blood banks, and research organizations are looking for ways to reduce costs, the immunohematology market has been witnessing major restraints in its growth.
It also discovered that high-income countries, for instance the U.S. and U.K., are responsible for an over 50% share in the blood donations collected globally. This shows lucrative opportunities for immunohematology market players in developed countries. A surge in the number of blood donors, blood banks, and blood collection events in high-income countries are likely to contribute its substantial share in the growth of the immunohematology market in the upcoming years.
The global Immunohematology market has been segmented based on product, application, disease, end user and regions.
The regions analyzed for the market include North America, Europe, South America, Asia Pacific, and the Middle East and Africa. North America is the leading region in the global Immunohematology market, accounting for around 35.2% of the market share in 2023.
North America Immunohematology Market Share in 2023 - 35.2%
www.thebrainyinsights.com
Check the geographical analysis of this market by requesting a free sample
Developing and developed countries are offering greater opportunities and major players are continuously focused on new developments, strategic partnerships, acquisitions and venture capital investments to obtain high growth in the market.
For instance, FDA clears ORTHO Sera ID-MTS for use on the ORTHO VISION Analyzer, fully automated technology from ortho clinical diagnostics aids in extended antigen phenotyping and ensures delivery of safe blood to transfusion Patients.
In April 2018, Immucor announced FDA clearance in the United States to best match donor-patient blood for Echo LumenaTM. This is designed for the small to mid-volume laboratory segment, is Immucor’s fifth generation immunohematology instrument and gets brilliant performance and clearer test results with the smallest benchtop footprint and the fastest type and screen turnaround time on the global market.
As per The Brainy Insights, the size of the immunohematology market was valued at USD 2.44 billion in 2023 and is anticipated to reach USD 3.53 billion by 2033.
Global immunohematology market is growing at a CAGR of 4.2% during the forecast period 2024-2033.
The North America region emerged as the largest market for the immunohematology.
Growing awareness about the importance of blood transfusion is the key driving factor for the immunohematology market.
High initial investments, inadequate reimbursements of high-tech devices could hamper the market growth.
Blood donations in developed countries industries will provide huge opportunities to the market.
Key players are Siemens Healthcare GmbH, Bio-Rad Laboratories, Ortho Clinical Diagnostics, Grifols, Immucor, Abbott laboratories.
1. Introduction
1.1. Objectives of the Study
1.2. Market Definition
1.3. Research Scope
1.4. Currency
1.5. Key Target Audience
2. Research Methodology and Assumptions
3. Executive Summary
4. Premium Insights
4.1. Porter’s Five Forces Analysis
4.2. Value Chain Analysis
4.3. Top Investment Pockets
4.3.1. Market Attractiveness Analysis By Product
4.3.2. Market Attractiveness Analysis By Application
4.3.3. Market Attractiveness Analysis By Disease
4.3.4. Market Attractiveness Analysis By End-User
4.3.5. Market Attractiveness Analysis By Region
4.4. Industry Trends
5. Market Dynamics
5.1. Market Evaluation
5.2. Drivers
5.2.1. Growing awareness about the importance of blood transfusion
5.2.2. The rise in the number of trauma cases, increasing demand for platelets, plasma factors and immunoglobin
5.3. Restrains
5.3.1. High initial investments, inadequate reimbursements of high-tech devices
5.4. Opportunities
5.4.1. Blood donations in developed countries
6. Global Immunohematology Market Analysis and Forecast, By Product
6.1. Segment Overview
6.2. Reagents
6.3. Analyzers
7. Global Immunohematology Market Analysis and Forecast, By Application
7.1. Segment Overview
7.2. Pretransfusion testing
7.2.1. ABO and Rh Typing
7.2.2. Antibody Detection
7.2.3. Cross matching
7.3. Investigation of immune hemolysis
7.4. Perinatal testing
7.5. Blood group Phenotyping / genotyping
7.6. Leucocyte and platelet Serology
8. Global Immunohematology Market Analysis and Forecast, By Disease
8.1. Segment Overview
8.2. Blood-related diseases
8.3. HIV
8.4. Hepatitis
9. Global Immunohematology Market Analysis and Forecast, By End-User
9.1. Segment Overview
9.2. Hospitals
9.3. Blood banks
9.4. Diagnostic laboratories
10. Global Immunohematology Market Analysis and Forecast, By Regional Analysis
10.1. Segment Overview
10.2. North America
10.2.1. U.S.
10.2.2. Canada
10.2.3. Mexico
10.3. Europe
10.3.1. Germany
10.3.2. France
10.3.3. U.K.
10.3.4. Italy
10.3.5. Spain
10.4. Asia-Pacific
10.4.1. Japan
10.4.2. China
10.4.3. India
10.5. South America
10.5.1. Brazil
10.6. Middle East and Africa
10.6.1. UAE
10.6.2. South Africa
11. Global Immunohematology Market-Competitive Landscape
11.1. Overview
11.2. Market Share of Key Players in Global Immunohematology Market
11.2.1. Global Company Market Share
11.2.2. North America Company Market Share
11.2.3. Europe Company Market Share
11.2.4. APAC Company Market Share
11.3. Competitive Situations and Trends
11.3.1. Product Launches and Developments
11.3.2. Partnerships, Collaborations, and Agreements
11.3.3. Mergers & Acquisitions
11.3.4. Expansions
12. Company Profiles
12.1. Siemens Healthcare GmbH
12.1.1. Business Overview
12.1.2. Company Snapshot
12.1.3. Company Market Share Analysis
12.1.4. Company Product Portfolio
12.1.5. Recent Developments
12.1.6. SWOT Analysis
12.2. Bio-Rad Laboratories
12.2.1. Business Overview
12.2.2. Company Snapshot
12.2.3. Company Market Share Analysis
12.2.4. Company Product Portfolio
12.2.5. Recent Developments
12.2.6. SWOT Analysis
12.3. Ortho Clinical Diagnostics
12.3.1. Business Overview
12.3.2. Company Snapshot
12.3.3. Company Market Share Analysis
12.3.4. Company Product Portfolio
12.3.5. Recent Developments
12.3.6. SWOT Analysis
12.4. Grifols
12.4.1. Business Overview
12.4.2. Company Snapshot
12.4.3. Company Market Share Analysis
12.4.4. Company Product Portfolio
12.4.5. Recent Developments
12.4.6. SWOT Analysis
12.5. Immucor
12.5.1. Business Overview
12.5.2. Company Snapshot
12.5.3. Company Market Share Analysis
12.5.4. Company Product Portfolio
12.5.5. Recent Developments
12.5.6. SWOT Analysis
12.6. Abbott laboratories
12.6.1. Business Overview
12.6.2. Company Snapshot
12.6.3. Company Market Share Analysis
12.6.4. Company Product Portfolio
12.6.5. Recent Developments
12.6.6. SWOT Analysis
12.7. Beckman Coulter
12.7.1. Business Overview
12.7.2. Company Snapshot
12.7.3. Company Market Share Analysis
12.7.4. Company Product Portfolio
12.7.5. Recent Developments
12.7.6. SWOT Analysis
12.8. ThermoFisher
12.8.1. Business Overview
12.8.2. Company Snapshot
12.8.3. Company Market Share Analysis
12.8.4. Company Product Portfolio
12.8.5. Recent Developments
12.8.6. SWOT Analysis
12.9. Becton Dickinson
12.9.1. Business Overview
12.9.2. Company Snapshot
12.9.3. Company Market Share Analysis
12.9.4. Company Product Portfolio
12.9.5. Recent Developments
12.9.6. SWOT Analysis
12.10. Merck KGaA
12.10.1. Business Overview
12.10.2. Company Snapshot
12.10.3. Company Market Share Analysis
12.10.4. Company Product Portfolio
12.10.5. Recent Developments
12.10.6. SWOT Analysis
List of Table
1. Global Immunohematology Market, By Product, 2020-2033 (USD Billion)
2. Global Reagents Immunohematology Market, By Region, 2020-2033 (USD Billion)
3. Global Analyzers Immunohematology Market, By Region, 2020-2033 (USD Billion)
4. Global Immunohematology Market, By Application, 2020-2033 (USD Billion)
5. Global Pretransfusion testing Immunohematology Market, By Region, 2020-2033 (USD Billion)
6. Global Investigation of immune hemolysis Immunohematology Market, By Region, 2020-2033 (USD Billion)
7. Global Perinatal testing Immunohematology Market, By Region, 2020-2033 (USD Billion)
8. Global Blood group Phenotyping / genotyping Immunohematology Market, By Region, 2020-2033 (USD Billion)
9. Global Leucocyte and platelet Serology, Perinatal testing Immunohematology Market, By Region, 2020-2033 (USD Billion)
10. Global Immunohematology Market, By Disease, 2020-2033 (USD Billion)
11. Global Blood-related diseases Immunohematology Market, By Region, 2020-2033 (USD Billion)
12. Global HIV Immunohematology Market, By Region, 2020-2033 (USD Billion)
13. Global Hepatitis Immunohematology Market, By Region, 2020-2033 (USD Billion)
14. Global Immunohematology Market, By End-User, 2020-2033 (USD Billion)
15. Global Hospitals Immunohematology Market, By Region, 2020-2033 (USD Billion)
16. Global Blood banks Immunohematology Market, By Region, 2020-2033 (USD Billion)
17. Global Diagnostic laboratories Immunohematology Market, By Region, 2020-2033 (USD Billion)
18. Global Immunohematology Market, By Region, 2020-2033 (USD Billion)
19. Global Immunohematology Market, By North America, 2020-2033 (USD Billion)
20. North America Immunohematology Market, By Product, 2020-2033 (USD Billion)
21. North America Immunohematology Market, By Application, 2020-2033 (USD Billion)
22. North America Immunohematology Market, By Disease, 2020-2033 (USD Billion)
23. North America Immunohematology Market, By End-User, 2020-2033 (USD Billion)
24. U.S. Immunohematology Market, By Product, 2020-2033 (USD Billion)
25. U.S. Immunohematology Market, By Application, 2020-2033 (USD Billion)
26. U.S. Immunohematology Market, By Disease, 2020-2033 (USD Billion)
27. U.S. Immunohematology Market, By End-User, 2020-2033 (USD Billion)
28. Canada Immunohematology Market, By Product, 2020-2033 (USD Billion)
29. Canada Immunohematology Market, By Application, 2020-2033 (USD Billion)
30. Canada Immunohematology Market, By Disease, 2020-2033 (USD Billion)
31. Canada Immunohematology Market, By End-User, 2020-2033 (USD Billion)
32. Mexico Immunohematology Market, By Product, 2020-2033 (USD Billion)
33. Mexico Immunohematology Market, By Application, 2020-2033 (USD Billion)
34. Mexico Immunohematology Market, By Disease, 2020-2033 (USD Billion)
35. Mexico Immunohematology Market, By End-User, 2020-2033 (USD Billion)
36. Europe Immunohematology Market, By Product, 2020-2033 (USD Billion)
37. Europe Immunohematology Market, By Application, 2020-2033 (USD Billion)
38. Europe Immunohematology Market, By Disease, 2020-2033 (USD Billion)
39. Europe Immunohematology Market, By End-User, 2020-2033 (USD Billion)
40. Germany Immunohematology Market, By Product, 2020-2033 (USD Billion)
41. Germany Immunohematology Market, By Application, 2020-2033 (USD Billion)
42. Germany Immunohematology Market, By Disease, 2020-2033 (USD Billion)
43. Germany Immunohematology Market, By End-User, 2020-2033 (USD Billion)
44. France Immunohematology Market, By Product, 2020-2033 (USD Billion)
45. France Immunohematology Market, By Application, 2020-2033 (USD Billion)
46. France Immunohematology Market, By Disease, 2020-2033 (USD Billion)
47. France Immunohematology Market, By End-User, 2020-2033 (USD Billion)
48. U.K. Immunohematology Market, By Product, 2020-2033 (USD Billion)
49. U.K. Immunohematology Market, By Application, 2020-2033 (USD Billion)
50. U.K. Immunohematology Market, By Disease, 2020-2033 (USD Billion)
51. U.K. Immunohematology Market, By End-User, 2020-2033 (USD Billion)
52. Italy Immunohematology Market, By Product, 2020-2033 (USD Billion)
53. Italy Immunohematology Market, By Application, 2020-2033 (USD Billion)
54. Italy Immunohematology Market, By Disease, 2020-2033 (USD Billion)
55. Italy Immunohematology Market, By End-User, 2020-2033 (USD Billion)
56. Spain Immunohematology Market, By Product, 2020-2033 (USD Billion)
57. Spain Immunohematology Market, By Application, 2020-2033 (USD Billion)
58. Spain Immunohematology Market, By Disease, 2020-2033 (USD Billion)
59. Spain Immunohematology Market, By End-User, 2020-2033 (USD Billion)
60. Asia Pacific Immunohematology Market, By Product, 2020-2033 (USD Billion)
61. Asia Pacific Immunohematology Market, By Application, 2020-2033 (USD Billion)
62. Asia Pacific Immunohematology Market, By Disease, 2020-2033 (USD Billion)
63. Asia Pacific Immunohematology Market, By End-User, 2020-2033 (USD Billion)
64. Japan Immunohematology Market, By Product, 2020-2033 (USD Billion)
65. Japan Immunohematology Market, By Application, 2020-2033 (USD Billion)
66. Japan Immunohematology Market, By Disease, 2020-2033 (USD Billion)
67. Japan Immunohematology Market, By End-User, 2020-2033 (USD Billion)
68. China Immunohematology Market, By Product, 2020-2033 (USD Billion)
69. China Immunohematology Market, By Application, 2020-2033 (USD Billion)
70. China Immunohematology Market, By Disease, 2020-2033 (USD Billion)
71. China Immunohematology Market, By End-User, 2020-2033 (USD Billion)
72. India Immunohematology Market, By Product, 2020-2033 (USD Billion)
73. India Immunohematology Market, By Application, 2020-2033 (USD Billion)
74. India Immunohematology Market, By Disease, 2020-2033 (USD Billion)
75. India Immunohematology Market, By End-User, 2020-2033 (USD Billion)
76. South America Immunohematology Market, By Product, 2020-2033 (USD Billion)
77. South America Immunohematology Market, By Application, 2020-2033 (USD Billion)
78. South America Immunohematology Market, By Disease, 2020-2033 (USD Billion)
79. South America Immunohematology Market, By End-User, 2020-2033 (USD Billion)
80. Brazil Immunohematology Market, By Product, 2020-2033 (USD Billion)
81. Brazil Immunohematology Market, By Application, 2020-2033 (USD Billion)
82. Brazil Immunohematology Market, By Disease, 2020-2033 (USD Billion)
83. Brazil Immunohematology Market, By End-User, 2020-2033 (USD Billion)
84. Middle East and Africa Immunohematology Market, By Product, 2020-2033 (USD Billion)
85. Middle East and Africa Immunohematology Market, By Application, 2020-2033 (USD Billion)
86. Middle East and Africa Immunohematology Market, By Disease, 2020-2033 (USD Billion)
87. Middle East and Africa Immunohematology Market, By End-User, 2020-2033 (USD Billion)
88. UAE Immunohematology Market, By Product, 2020-2033 (USD Billion)
89. UAE Immunohematology Market, By Application, 2020-2033 (USD Billion)
90. UAE Immunohematology Market, By Disease, 2020-2033 (USD Billion)
91. UAE Immunohematology Market, By End-User, 2020-2033 (USD Billion)
92. South Africa Immunohematology Market, By Product, 2020-2033 (USD Billion)
93. South Africa Immunohematology Market, By Application, 2020-2033 (USD Billion)
94. South Africa Immunohematology Market, By Disease, 2020-2033 (USD Billion)
95. South Africa Immunohematology Market, By End-User, 2020-2033 (USD Billion)
List of Figures
1. Global Immunohematology Market Segmentation
2. Immunohematology Market: Research Methodology
3. Market Size Estimation Methodology: Bottom-Up Approach
4. Market Size Estimation Methodology: Top-Down Approach
5. Data Triangulation
6. Porter’s Five Forces Analysis
7. Value Chain Analysis
8. Global Immunohematology Market Attractiveness Analysis By Product
9. Global Immunohematology Market Attractiveness Analysis By Application
10. Global Immunohematology Market Attractiveness Analysis By Disease
11. Global Immunohematology Market Attractiveness Analysis By End-User
12. Global Immunohematology Market Attractiveness Analysis By Region
13. Global Immunohematology Market: Dynamics
14. Global Immunohematology Market Share by Product (2023 & 2033)
15. Global Immunohematology Market Share by Application (2023 & 2033)
16. Global Immunohematology Market Share by Disease (2023 & 2033)
17. Global Immunohematology Market Share by End-User (2023 & 2033)
18. Global Immunohematology Market Share by Regions (2023 & 2033)
19. Global Immunohematology Market Share by Company (2023)
This study forecasts revenue at global, regional, and country levels from 2020 to 2033. The Brainy Insights has segmented the global Immunohematology market on the basis of below mentioned segments:
Global Immunohematology Market by Product:
Global Immunohematology Market by Application:
Global Immunohematology Market by Disease:
Global Immunohematology Market by End User:
Global Immunohematology Market by Region:
Research has its special purpose to undertake marketing efficiently. In this competitive scenario, businesses need information across all industry verticals; the information about customer wants, market demand, competition, industry trends, distribution channels etc. This information needs to be updated regularly because businesses operate in a dynamic environment. Our organization, The Brainy Insights incorporates scientific and systematic research procedures in order to get proper market insights and industry analysis for overall business success. The analysis consists of studying the market from a miniscule level wherein we implement statistical tools which helps us in examining the data with accuracy and precision.
Our research reports feature both; quantitative and qualitative aspects for any market. Qualitative information for any market research process are fundamental because they reveal the customer needs and wants, usage and consumption for any product/service related to a specific industry. This in turn aids the marketers/investors in knowing certain perceptions of the customers. Qualitative research can enlighten about the different product concepts and designs along with unique service offering that in turn, helps define marketing problems and generate opportunities. On the other hand, quantitative research engages with the data collection process through interviews, e-mail interactions, surveys and pilot studies. Quantitative aspects for the market research are useful to validate the hypotheses generated during qualitative research method, explore empirical patterns in the data with the help of statistical tools, and finally make the market estimations.
The Brainy Insights offers comprehensive research and analysis, based on a wide assortment of factual insights gained through interviews with CXOs and global experts and secondary data from reliable sources. Our analysts and industry specialist assume vital roles in building up statistical tools and analysis models, which are used to analyse the data and arrive at accurate insights with exceedingly informative research discoveries. The data provided by our organization have proven precious to a diverse range of companies, facilitating them to address issues such as determining which products/services are the most appealing, whether or not customers use the product in the manner anticipated, the purchasing intentions of the market and many others.
Our research methodology encompasses an idyllic combination of primary and secondary initiatives. Key phases involved in this process are listed below:

The phase involves the gathering and collecting of market data and its related information with the help of different sources & research procedures.

The data procurement stage involves in data gathering and collecting through various data sources.
This stage involves in extensive research. These data sources includes:
Purchased Database: Purchased databases play a crucial role in estimating the market sizes irrespective of the domain. Our purchased database includes:
Primary Research: The Brainy Insights interacts with leading companies and experts of the concerned domain to develop the analyst team’s market understanding and expertise. It improves and substantiates every single data presented in the market reports. Primary research mainly involves in telephonic interviews, E-mail interactions and face-to-face interviews with the raw material providers, manufacturers/producers, distributors, & independent consultants. The interviews that we conduct provides valuable data on market size and industry growth trends prevailing in the market. Our organization also conducts surveys with the various industry experts in order to gain overall insights of the industry/market. For instance, in healthcare industry we conduct surveys with the pharmacists, doctors, surgeons and nurses in order to gain insights and key information of a medical product/device/equipment which the customers are going to usage. Surveys are conducted in the form of questionnaire designed by our own analyst team. Surveys plays an important role in primary research because surveys helps us to identify the key target audiences of the market. Additionally, surveys helps to identify the key target audience engaged with the market. Our survey team conducts the survey by targeting the key audience, thus gaining insights from them. Based on the perspectives of the customers, this information is utilized to formulate market strategies. Moreover, market surveys helps us to understand the current competitive situation of the industry. To be precise, our survey process typically involve with the 360 analysis of the market. This analytical process begins by identifying the prospective customers for a product or service related to the market/industry to obtain data on how a product/service could fit into customers’ lives.

Secondary Research: The secondary data sources includes information published by the on-profit organizations such as World bank, WHO, company fillings, investor presentations, annual reports, national government documents, statistical databases, blogs, articles, white papers and others. From the annual report, we analyse a company’s revenue to understand the key segment and market share of that organization in a particular region. We analyse the company websites and adopt the product mapping technique which is important for deriving the segment revenue. In the product mapping method, we select and categorize the products offered by the companies catering to domain specific market, deduce the product revenue for each of the companies so as to get overall estimation of the market size. We also source data and analyses trends based on information received from supply side and demand side intermediaries in the value chain. The supply side denotes the data gathered from supplier, distributor, wholesaler and the demand side illustrates the data gathered from the end customers for respective market domain.

The supply side for a domain specific market is analysed by:
The demand side for the market is estimated through:
In-house Library: Apart from these third-party sources, we have our in-house library of qualitative and quantitative information. Our in-house database includes market data for various industry and domains. These data are updated on regular basis as per the changing market scenario. Our library includes, historic databases, internal audit reports and archives.
Sometimes there are instances where there is no metadata or raw data available for any domain specific market. For those cases, we use our expertise to forecast and estimate the market size in order to generate comprehensive data sets. Our analyst team adopt a robust research technique in order to produce the estimates:
Data Synthesis: This stage involves the analysis & mapping of all the information obtained from the previous step. It also involves in scrutinizing the data for any discrepancy observed while data gathering related to the market. The data is collected with consideration to the heterogeneity of sources. Robust scientific techniques are in place for synthesizing disparate data sets and provide the essential contextual information that can orient market strategies. The Brainy Insights has extensive experience in data synthesis where the data passes through various stages:


Market Deduction & Formulation: The final stage comprises of assigning data points at appropriate market spaces so as to deduce feasible conclusions. Analyst perspective & subject matter expert based holistic form of market sizing coupled with industry analysis also plays a crucial role in this stage.
This stage involves in finalization of the market size and numbers that we have collected from data integration step. With data interpolation, it is made sure that there is no gap in the market data. Successful trend analysis is done by our analysts using extrapolation techniques, which provide the best possible forecasts for the market.
Data Validation & Market Feedback: Validation is the most important step in the process. Validation & re-validation via an intricately designed process helps us finalize data-points to be used for final calculations.

The Brainy Insights interacts with leading companies and experts of the concerned domain to develop the analyst team’s market understanding and expertise. It improves and substantiates every single data presented in the market reports. The data validation interview and discussion panels are typically composed of the most experienced industry members. The participants include, however, are not limited to:
Moreover, we always validate our data and findings through primary respondents from all the major regions we are working on.


Free Customization
Fortune 500 Clients
Free Yearly Update On Purchase Of Multi/Corporate License
Companies Served Till Date