- +1-315-215-1633
- sales@thebrainyinsights.com

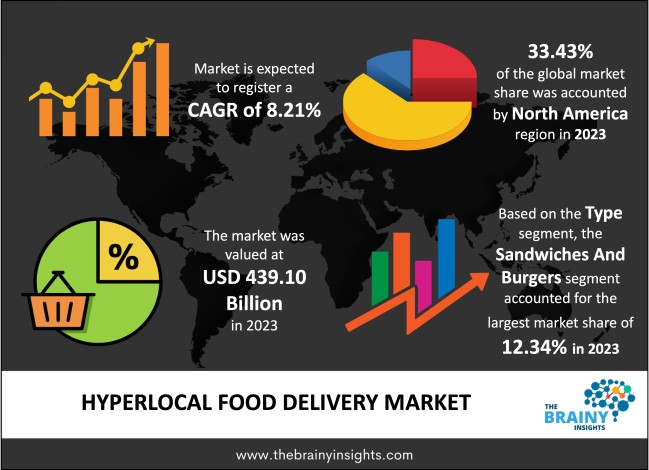
The global hyperlocal food delivery market was valued at USD 439.10 billion in 2023 and it is growing at a CAGR of 8.21% from 2024 to 2033. The global hyperlocal food delivery market is expected to reach USD 966.58 billion by 2033. The Asia Pacific is expected to grow the fastest during the forecast period
Hyperlocal food delivery is the type of delivery done or performed within a limited geographical location or locality described by a radius restricted by specific miles or pin codes. It's a kind of delivery usually done by selecting orders that consumers place online from local offline stores based on nearby areas to a consumer's place. The hyperlocal delivery model best fits for deliveries containing medicine, grocery, food, and daily household items. People ordering groceries from a neighboring store through a mobile application or website is an excellent hyperlocal delivery example.
Various elements have been pushing the growth of the hyperlocal services market, which includes urbanization, smartphones, changing customer tastes, and improved ways of living. It is primarily due to the expansion of E-commerce business funding and the digitalization of business trends. Additionally, multiple E-commerce companies are acquiring hyperlocal businesses to decrease transportation costs and minimize delivery times. Customer expectations are rising with the growth of online marketplaces, e-commerce platforms, and delivery-based companies. Players that deliver faster than their competitors tend to lure more customers, so the hyperlocal delivery model is a cut-throat competition for the market players. The well-funded start-ups, organized products and services, and on-demand delivery have pushed hyperlocal E-commerce popularity. The success has led to curiosity and participation by some significant business houses and online companies. Google shows that most information people require from within a one-kilometer area. Hyperlocal has adopted a fast and unique business model, offering tremendous advantages over common e-commerce platforms. Consumers can get products delivered quickly to their houses. It has more credibility as products are produced from local shops to local customers.
Get an overview of this study by requesting a free sample
Ensure fast delivery- Consumers do not like waiting for the delivery of food, groceries, and medicines. They want these to be delivered quickly, which means ‘within an hour. Hyperlocal deliveries make it possible to fulfill this expectation which drives the market growth. However, the stores and grocery outlets which are nearby customers address complete such deliveries quickly and reduces the delivery turnaround time. The entire process of visiting a warehouse or choosing up orders from a hub is missed considerably in the case of hyperlocal deliveries, which impacts delivery durations. Then, technologies like automation, data analytics, real-time dynamic route optimization, machine learning, the Internet of things (IoT), predictive intelligence, and crowdsourcing decrease the time needed to execute delivery.
Increasing competition- The hyperlocal segment falls under the same category where competition is neck to neck. The hyperlocal food delivery has grown tremendously. The competition is intense in the industry. Market players such as uber eats, zomato, Grab, etc., and hyperlocal companies are joining the picture, offering the hyperlocal industries big competition. Most sellers are grabbing their opportunities to get these services and make access to all these delivery partners for hiring them. It would help to get an excellent hyperlocal service provider to overcome the increasing threat of competitors.
New advanced technologies- Due to the fast growth in digital logistics tools, technology is not a barrier. Advanced routing platforms can authorize grocery& food delivery providers and retailers to develop effective routes that improves delivery turnaround time from a store/ restaurant to a consumer's address. It minimizes the chances of delays and diversions and generates an accurate estimated time of arrival. The platforms also help businesses operate multi-drop deliveries, an essential part of hyperlocal operations that benefit every delivery. Geo-tagging & Geolocation tools make it more comfortable to locate consumers' addresses in crowded, congested, or highly populated places. It's beneficial to identify addresses that are not 100% accurate.
The regions analyzed for the market include North America, Europe, South America, Asia Pacific, the Middle East, and Africa. North America emerged as the largest market for the global hyperlocal food delivery market, with a 33.43% share of the market revenue in 2023.
North America currently dominates the hyperlocal food delivery market due to It is one of the world's biggest online food delivery markets, contributing to almost 33.43% of the total revenue. The region's considerable urban people, hectic lifestyles, and growing internet and smartphone penetration are various reasons for pushing the United States market. Also, China is the second-largest country in the hyperlocal food delivery market, with the fastest-growing rate in the Asia Pacific region. The country's large young population, which makes up most of the customer base, has helped in the development of China's hyperlocal food delivery market.
North America Region Hyperlocal Food Delivery Market Share in 2023 - 33.43%
www.thebrainyinsights.com
Check the geographical analysis of this market by requesting a free sample
The type segment is divided into salads, soups, lunch & dinner, sandwiches and burgers, pizza, desserts, beverages, and others. The sandwiches and burgers segment dominated the market, with a market share of around 12.34% in 2023. Burgers have been a leading item ordered in the United States in restaurants for an extendedperiod, but the sandwiches have come more strongly over the last few years. There are more sandwiches in restaurant concepts, and chicken sandwiches are preferable on menus.
The delivery type segment is divided into platform to consumer, and restaurant to consumer. The platform to consumer segment dominated the market, with a market share of around 55.55% in 2023. The latest internet platforms surge to capture consumers in the market across APAC, Europe, North America, and the Middle East, and hyperlocal food delivery services to the doorstep are undergoing rapid changes. Although the new Internet channels are gathering substantial investment and high valuations, there is still minimal understanding of market dynamics, potential, or user behavior.
The payment method segment is divided into online payment and cash-on-delivery.. The online payment segment dominated the market, with a market share of around 59.44% in 2023. The accessibility of many online hyperlocal food delivery businesses, a better understanding by consumers of the progress of online E-commerce platforms, and the availability of a better, easier, and more secure alternative for online payment of services are the major driving elements of the market.
| Attribute | Description |
|---|---|
| Market Size | Revenue (USD Billion) |
| Market size value in 2023 | USD 439.10 Billion |
| Market size value in 2033 | USD 966.58 Billion |
| CAGR (2024 to 2033) | 8.21% |
| Historical data | 2020-2022 |
| Base Year | 2023 |
| Forecast | 2024-2033 |
| Region | North America, Europe, Asia Pacific, South America, and Middle East and Africa. |
| Segments | The segments are Type, Delivery type, Payment method |
Ensure fast delivery to propel market growth.
Increasing competition to hinder market growth.
New advanced technologies will provide huge opportunities to the market.
1. Introduction
1.1. Objectives of the Study
1.2. Market Definition
1.3. Research Scope
1.4. Currency
1.5. Key Target Audience
2. Research Methodology and Assumptions
3. Executive Summary
4. Premium Insights
4.1. Porter’s Five Forces Analysis
4.2. Value Chain Analysis
4.3. Top Investment Pockets
4.3.1. Market Attractiveness Analysis by Type
4.3.2. Market Attractiveness Analysis by Delivery Type
4.3.3. Market Attractiveness Analysis by Payment Method
4.3.4. Market Attractiveness Analysis by Region
4.4. Industry Trends
5. Market Dynamics
5.1. Market Evaluation
5.2. Drivers
5.2.1. Ensure fast delivery to propel market growth
5.3. Restraints
5.3.1. Increasing competition to hinder market growth
5.4. Opportunities
5.4.1. New advanced technologies
6. Global Hyperlocal Food Delivery Market Analysis and Forecast, By Type:
6.1. Segment Overview
6.2. Salads
6.3. Soups
6.4. Lunch & Dinner
6.5. Sandwiches and Burgers
6.6. Pizza
6.7. Desserts
6.8. Beverages
6.9. Others
7. Global Hyperlocal Food Delivery Market Analysis and Forecast, By Delivery Type
7.1. Segment Overview
7.2. Platform to Consumer
7.3. Restaurant to Consumer
8. Global Hyperlocal Food Delivery Market Analysis and Forecast, By Payment Method
8.1. Segment Overview
8.2. Online Payment
8.3. Cash On Delivery
9. Global Hyperlocal Food Delivery Market Analysis and Forecast, By Regional Analysis
9.1. Segment Overview
9.2. North America
9.2.1. U.S.
9.2.2. Canada
9.2.3. Mexico
9.3. Europe
9.3.1. Germany
9.3.2. France
9.3.3. U.K.
9.3.4. Italy
9.3.5. Spain
9.4. Asia-Pacific
9.4.1. Japan
9.4.2. China
9.4.3. India
9.5. South America
9.5.1. Brazil
9.6. Middle East and Africa
9.6.1. UAE
9.6.2. South Africa
10. Global Hyperlocal Food Delivery Market-Competitive Landscape
10.1. Overview
10.2. Market Share of Key Players in the Hyperlocal Food Delivery Market
10.2.1. Global Company Market Share
10.2.2. North America Company Market Share
10.2.3. Europe Company Market Share
10.2.4. APAC Company Market Share
10.3. Competitive Situations and Trends
10.3.1. Product Launches and Developments
10.3.2. Partnerships, Collaborations, and Agreements
10.3.3. Mergers & Acquisitions
10.3.4. Expansions
11. Company Profiles
11.1. Zomato
11.1.1. Business Overview
11.1.2. Company Snapshot
11.1.3. Company Market Share Analysis
11.1.4. Company Product Portfolio
11.1.5. Recent Developments
11.1.6. SWOT Analysis
11.2. Yandex.Eda
11.2.1. Business Overview
11.2.2. Company Snapshot
11.2.3. Company Market Share Analysis
11.2.4. Company Product Portfolio
11.2.5. Recent Developments
11.2.6. SWOT Analysis
11.3. Uber Eats
11.3.1. Business Overview
11.3.2. Company Snapshot
11.3.3. Company Market Share Analysis
11.3.4. Company Product Portfolio
11.3.5. Recent Developments
11.3.6. SWOT Analysis
11.4. Takeaway.com
11.4.1. Business Overview
11.4.2. Company Snapshot
11.4.3. Company Market Share Analysis
11.4.4. Company Product Portfolio
11.4.5. Recent Developments
11.4.6. SWOT Analysis
11.5. Rappi
11.5.1. Business Overview
11.5.2. Company Snapshot
11.5.3. Company Market Share Analysis
11.5.4. Company Product Portfolio
11.5.5. Recent Developments
11.5.6. SWOT Analysis
11.6. Postmates
11.6.1. Business Overview
11.6.2. Company Snapshot
11.6.3. Company Market Share Analysis
11.6.4. Company Product Portfolio
11.6.5. Recent Developments
11.6.6. SWOT Analysis
11.7. Meituan Dianping
11.7.1. Business Overview
11.7.2. Company Snapshot
11.7.3. Company Market Share Analysis
11.7.4. Company Product Portfolio
11.7.5. Recent Developments
11.7.6. SWOT Analysis
11.8. Just Eat.
11.8.1. Business Overview
11.8.2. Company Snapshot
11.8.3. Company Market Share Analysis
11.8.4. Company Product Portfolio
11.8.5. Recent Developments
11.8.6. SWOT Analysis
11.9. Jumia Food
11.9.1. Business Overview
11.9.2. Company Snapshot
11.9.3. Company Market Share Analysis
11.9.4. Company Product Portfolio
11.9.5. Recent Developments
11.9.6. SWOT Analysis
11.10. iFood
11.10.1. Business Overview
11.10.2. Company Snapshot
11.10.3. Company Market Share Analysis
11.10.4. Company Product Portfolio
11.10.5. Recent Developments
11.10.6. SWOT Analysis
11.11. Grubhub
11.11.1. Business Overview
11.11.2. Company Snapshot
11.11.3. Company Market Share Analysis
11.11.4. Company Product Portfolio
11.11.5. Recent Developments
11.11.6. SWOT Analysis
11.12. Ele.Me
11.12.1. Business Overview
11.12.2. Company Snapshot
11.12.3. Company Market Share Analysis
11.12.4. Company Product Portfolio
11.12.5. Recent Developments
11.12.6. SWOT Analysis
11.13. DoorDash
11.13.1. Business Overview
11.13.2. Company Snapshot
11.13.3. Company Market Share Analysis
11.13.4. Company Product Portfolio
11.13.5. Recent Developments
11.13.6. SWOT Analysis
11.14. Delivery Hero
11.14.1. Business Overview
11.14.2. Company Snapshot
11.14.3. Company Market Share Analysis
11.14.4. Company Product Portfolio
11.14.5. Recent Developments
11.14.6. SWOT Analysis
11.15. Deliveroo
11.15.1. Business Overview
11.15.2. Company Snapshot
11.15.3. Company Market Share Analysis
11.15.4. Company Product Portfolio
11.15.5. Recent Developments
11.15.6. SWOT Analysis
11.16. Damae-can
11.16.1. Business Overview
11.16.2. Company Snapshot
11.16.3. Company Market Share Analysis
11.16.4. Company Product Portfolio
11.16.5. Recent Developments
11.16.6. SWOT Analysis
List of Table
1. Global Hyperlocal Food Delivery Market, By Type, 2020-2033 (USD Billion)
2. Global Salads Hyperlocal Food Delivery Market, By Region, 2020-2033 (USD Billion)
3. Global Soups Hyperlocal Food Delivery Market, By Region, 2020-2033 (USD Billion)
4. Global Lunch & Dinner Hyperlocal Food Delivery Market, By Region, 2020-2033 (USD Billion)
5. Global Sandwiches and Burgers Hyperlocal Food Delivery Market, By Region, 2020-2033 (USD Billion)
6. Global Pizza Hyperlocal Food Delivery Market, By Region, 2020-2033 (USD Billion)
7. Global Desserts Hyperlocal Food Delivery Market, By Region, 2020-2033 (USD Billion)
8. Global Beverages Hyperlocal Food Delivery Market, By Region, 2020-2033 (USD Billion)
9. Global Others Hyperlocal Food Delivery Market, By Region, 2020-2033 (USD Billion)
10. Global Hyperlocal Food Delivery Market, By Delivery Type, 2020-2033 (USD Billion)
11. Global Platform to Consumer Hyperlocal Food Delivery Market, By Region, 2020-2033 (USD Billion)
12. Global Restaurant to Consumer Hyperlocal Food Delivery Market, By Region, 2020-2033 (USD Billion)
13. Global Hyperlocal Food Delivery Market, By Payment Method, 2020-2033 (USD Billion)
14. Global Online Payment Hyperlocal Food Delivery Market, By Region, 2020-2033 (USD Billion)
15. Global Cash on Delivery Hyperlocal Food Delivery Market, By Region, 2020-2033 (USD Billion)
16. North America Hyperlocal Food Delivery Market, By Type, 2020-2033 (USD Billion)
17. North America Hyperlocal Food Delivery Market, By Delivery Type, 2020-2033 (USD Billion)
18. North America Hyperlocal Food Delivery Market, By Payment Method, 2020-2033 (USD Billion)
19. U.S. Hyperlocal Food Delivery Market, By Type, 2020-2033 (USD Billion)
20. U.S. Hyperlocal Food Delivery Market, By Delivery Type, 2020-2033 (USD Billion)
21. U.S. Hyperlocal Food Delivery Market, By Payment Method, 2020-2033 (USD Billion)
22. Canada Hyperlocal Food Delivery Market, By Type, 2020-2033 (USD Billion)
23. Canada Hyperlocal Food Delivery Market, By Delivery Type, 2020-2033 (USD Billion)
24. Canada Hyperlocal Food Delivery Market, By Payment Method, 2020-2033 (USD Billion)
25. Mexico Hyperlocal Food Delivery Market, By Type, 2020-2033 (USD Billion)
26. Mexico Hyperlocal Food Delivery Market, By Delivery Type, 2020-2033 (USD Billion)
27. Mexico Hyperlocal Food Delivery Market, By Payment Method, 2020-2033 (USD Billion)
28. Europe Hyperlocal Food Delivery Market, By Type, 2020-2033 (USD Billion)
29. Europe Hyperlocal Food Delivery Market, By Delivery Type, 2020-2033 (USD Billion)
30. Europe Hyperlocal Food Delivery Market, By Payment Method, 2020-2033 (USD Billion)
31. Germany Hyperlocal Food Delivery Market, By Type, 2020-2033 (USD Billion)
32. Germany Hyperlocal Food Delivery Market, By Delivery Type, 2020-2033 (USD Billion)
33. Germany Hyperlocal Food Delivery Market, By Payment Method, 2020-2033 (USD Billion)
34. France Hyperlocal Food Delivery Market, By Type 2020-2033 (USD Billion)
35. France Hyperlocal Food Delivery Market, By Delivery Type, 2020-2033 (USD Billion)
36. France Hyperlocal Food Delivery Market, By Payment Method, 2020-2033 (USD Billion)
37. U.K. Hyperlocal Food Delivery Market, By Type, 2020-2033 (USD Billion)
38. U.K. Hyperlocal Food Delivery Market, By Delivery Type, 2020-2033 (USD Billion)
39. U.K. Hyperlocal Food Delivery Market, By Payment Method, 2020-2033 (USD Billion)
40. Italy Hyperlocal Food Delivery Market, By Type, 2020-2033 (USD Billion)
41. Italy Hyperlocal Food Delivery Market, By Delivery Type, 2020-2033 (USD Billion)
42. Italy Hyperlocal Food Delivery Market, By Payment Method, 2020-2033 (USD Billion)
43. Spain Hyperlocal Food Delivery Market, By Type, 2020-2033 (USD Billion)
44. Spain Hyperlocal Food Delivery Market, By Delivery Type, 2020-2033 (USD Billion)
45. Spain Hyperlocal Food Delivery Market, By Payment Method, 2020-2033 (USD Billion)
46. Asia Pacific Hyperlocal Food Delivery Market, By Type, 2020-2033 (USD Billion)
47. Asia Pacific Hyperlocal Food Delivery Market, By Delivery Type, 2020-2033 (USD Billion)
48. Asia Pacific Hyperlocal Food Delivery Market, By Payment Method, 2020-2033 (USD Billion)
49. Japan Hyperlocal Food Delivery Market, By Type, 2020-2033 (USD Billion)
50. Japan Hyperlocal Food Delivery Market, By Delivery Type, 2020-2033 (USD Billion)
51. Japan Hyperlocal Food Delivery Market, By Payment Method, 2020-2033 (USD Billion)
52. China Hyperlocal Food Delivery Market, By Type 2020-2033 (USD Billion)
53. China Hyperlocal Food Delivery Market, By Delivery Type, 2020-2033 (USD Billion)
54. China Hyperlocal Food Delivery Market, By Payment Method, 2020-2033 (USD Billion)
55. India Hyperlocal Food Delivery Market, By Type 2020-2033 (USD Billion)
56. India Hyperlocal Food Delivery Market, By Delivery Type, 2020-2033 (USD Billion)
57. India Hyperlocal Food Delivery Market, By Payment Method, 2020-2033 (USD Billion)
58. South America Hyperlocal Food Delivery Market, By Type, 2020-2033 (USD Billion)
59. South America Hyperlocal Food Delivery Market, By Delivery Type, 2020-2033 (USD Billion)
60. South America Hyperlocal Food Delivery Market, By Payment Method, 2020-2033 (USD Billion)
61. Brazil Hyperlocal Food Delivery Market, By Type 2020-2033 (USD Billion)
62. Brazil Hyperlocal Food Delivery Market, By Delivery Type, 2020-2033 (USD Billion)
63. Brazil Hyperlocal Food Delivery Market, By Payment Method, 2020-2033 (USD Billion)
64. Middle East and Africa Hyperlocal Food Delivery Market, By Type, 2020-2033 (USD Billion)
65. Middle East and Africa Hyperlocal Food Delivery Market, By Delivery Type, 2020-2033 (USD Billion)
66. Middle East and Africa Hyperlocal Food Delivery Market, By Payment Method, 2020-2033 (USD Billion)
67. UAE Hyperlocal Food Delivery Market, By Type, 2020-2033 (USD Billion)
68. UAE Hyperlocal Food Delivery Market, By Delivery Type, 2020-2033 (USD Billion)
69. UAE Hyperlocal Food Delivery Market, By Payment Method, 2020-2033 (USD Billion)
70. South Africa Hyperlocal Food Delivery Market, By Type 2020-2033 (USD Billion)
71. South Africa Hyperlocal Food Delivery Market, By Delivery Type, 2020-2033 (USD Billion)
72. South Africa Hyperlocal Food Delivery Market, By Payment Method, 2020-2033 (USD Billion)
List of Figures
1. Global Hyperlocal Food Delivery Market Segmentation
2. Hyperlocal Food Delivery Market: Research Methodology
3. Market Size Estimation Methodology: Bottom-Up Approach
4. Market Size Estimation Methodology: Top-Down Approach
5. Data Triangulation
6. Porter’s Five Forces Analysis
7. Value Chain Analysis
8. Global Hyperlocal Food Delivery Market Attractiveness Analysis by Type
9. Global Hyperlocal Food Delivery Market Attractiveness Analysis by Delivery Type
10. Global Hyperlocal Food Delivery Market Attractiveness Analysis by Payment Method
11. Global Hyperlocal Food Delivery Market Attractiveness Analysis by Region
12. Global Hyperlocal Food Delivery Market: Dynamics
13. Global Hyperlocal Food Delivery Market Share by Type (2023 & 2033)
14. Global Hyperlocal Food Delivery Market Share by Delivery Type (2023 & 2033)
15. Global Hyperlocal Food Delivery Market Share by Payment Method (2023 & 2033)
16. Global Hyperlocal Food Delivery Market Share by Regions (2023 & 2033)
17. Global Hyperlocal Food Delivery Market Share by Company (2023)
This study forecasts revenue at global, regional, and country levels from 2020 to 2033. The Brainy Insights has segmented the global hyperlocal food delivery market based on below mentioned segments:
Global Hyperlocal Food Delivery Market by Type:
Global Hyperlocal Food Delivery Market by Delivery Type:
Global Hyperlocal Food Delivery Market by Payment Method:
Global Hyperlocal Food Delivery Market by Region:
Research has its special purpose to undertake marketing efficiently. In this competitive scenario, businesses need information across all industry verticals; the information about customer wants, market demand, competition, industry trends, distribution channels etc. This information needs to be updated regularly because businesses operate in a dynamic environment. Our organization, The Brainy Insights incorporates scientific and systematic research procedures in order to get proper market insights and industry analysis for overall business success. The analysis consists of studying the market from a miniscule level wherein we implement statistical tools which helps us in examining the data with accuracy and precision.
Our research reports feature both; quantitative and qualitative aspects for any market. Qualitative information for any market research process are fundamental because they reveal the customer needs and wants, usage and consumption for any product/service related to a specific industry. This in turn aids the marketers/investors in knowing certain perceptions of the customers. Qualitative research can enlighten about the different product concepts and designs along with unique service offering that in turn, helps define marketing problems and generate opportunities. On the other hand, quantitative research engages with the data collection process through interviews, e-mail interactions, surveys and pilot studies. Quantitative aspects for the market research are useful to validate the hypotheses generated during qualitative research method, explore empirical patterns in the data with the help of statistical tools, and finally make the market estimations.
The Brainy Insights offers comprehensive research and analysis, based on a wide assortment of factual insights gained through interviews with CXOs and global experts and secondary data from reliable sources. Our analysts and industry specialist assume vital roles in building up statistical tools and analysis models, which are used to analyse the data and arrive at accurate insights with exceedingly informative research discoveries. The data provided by our organization have proven precious to a diverse range of companies, facilitating them to address issues such as determining which products/services are the most appealing, whether or not customers use the product in the manner anticipated, the purchasing intentions of the market and many others.
Our research methodology encompasses an idyllic combination of primary and secondary initiatives. Key phases involved in this process are listed below:

The phase involves the gathering and collecting of market data and its related information with the help of different sources & research procedures.

The data procurement stage involves in data gathering and collecting through various data sources.
This stage involves in extensive research. These data sources includes:
Purchased Database: Purchased databases play a crucial role in estimating the market sizes irrespective of the domain. Our purchased database includes:
Primary Research: The Brainy Insights interacts with leading companies and experts of the concerned domain to develop the analyst team’s market understanding and expertise. It improves and substantiates every single data presented in the market reports. Primary research mainly involves in telephonic interviews, E-mail interactions and face-to-face interviews with the raw material providers, manufacturers/producers, distributors, & independent consultants. The interviews that we conduct provides valuable data on market size and industry growth trends prevailing in the market. Our organization also conducts surveys with the various industry experts in order to gain overall insights of the industry/market. For instance, in healthcare industry we conduct surveys with the pharmacists, doctors, surgeons and nurses in order to gain insights and key information of a medical product/device/equipment which the customers are going to usage. Surveys are conducted in the form of questionnaire designed by our own analyst team. Surveys plays an important role in primary research because surveys helps us to identify the key target audiences of the market. Additionally, surveys helps to identify the key target audience engaged with the market. Our survey team conducts the survey by targeting the key audience, thus gaining insights from them. Based on the perspectives of the customers, this information is utilized to formulate market strategies. Moreover, market surveys helps us to understand the current competitive situation of the industry. To be precise, our survey process typically involve with the 360 analysis of the market. This analytical process begins by identifying the prospective customers for a product or service related to the market/industry to obtain data on how a product/service could fit into customers’ lives.

Secondary Research: The secondary data sources includes information published by the on-profit organizations such as World bank, WHO, company fillings, investor presentations, annual reports, national government documents, statistical databases, blogs, articles, white papers and others. From the annual report, we analyse a company’s revenue to understand the key segment and market share of that organization in a particular region. We analyse the company websites and adopt the product mapping technique which is important for deriving the segment revenue. In the product mapping method, we select and categorize the products offered by the companies catering to domain specific market, deduce the product revenue for each of the companies so as to get overall estimation of the market size. We also source data and analyses trends based on information received from supply side and demand side intermediaries in the value chain. The supply side denotes the data gathered from supplier, distributor, wholesaler and the demand side illustrates the data gathered from the end customers for respective market domain.

The supply side for a domain specific market is analysed by:
The demand side for the market is estimated through:
In-house Library: Apart from these third-party sources, we have our in-house library of qualitative and quantitative information. Our in-house database includes market data for various industry and domains. These data are updated on regular basis as per the changing market scenario. Our library includes, historic databases, internal audit reports and archives.
Sometimes there are instances where there is no metadata or raw data available for any domain specific market. For those cases, we use our expertise to forecast and estimate the market size in order to generate comprehensive data sets. Our analyst team adopt a robust research technique in order to produce the estimates:
Data Synthesis: This stage involves the analysis & mapping of all the information obtained from the previous step. It also involves in scrutinizing the data for any discrepancy observed while data gathering related to the market. The data is collected with consideration to the heterogeneity of sources. Robust scientific techniques are in place for synthesizing disparate data sets and provide the essential contextual information that can orient market strategies. The Brainy Insights has extensive experience in data synthesis where the data passes through various stages:


Market Deduction & Formulation: The final stage comprises of assigning data points at appropriate market spaces so as to deduce feasible conclusions. Analyst perspective & subject matter expert based holistic form of market sizing coupled with industry analysis also plays a crucial role in this stage.
This stage involves in finalization of the market size and numbers that we have collected from data integration step. With data interpolation, it is made sure that there is no gap in the market data. Successful trend analysis is done by our analysts using extrapolation techniques, which provide the best possible forecasts for the market.
Data Validation & Market Feedback: Validation is the most important step in the process. Validation & re-validation via an intricately designed process helps us finalize data-points to be used for final calculations.

The Brainy Insights interacts with leading companies and experts of the concerned domain to develop the analyst team’s market understanding and expertise. It improves and substantiates every single data presented in the market reports. The data validation interview and discussion panels are typically composed of the most experienced industry members. The participants include, however, are not limited to:
Moreover, we always validate our data and findings through primary respondents from all the major regions we are working on.


Free Customization
Fortune 500 Clients
Free Yearly Update On Purchase Of Multi/Corporate License
Companies Served Till Date