- +1-315-215-1633
- sales@thebrainyinsights.com

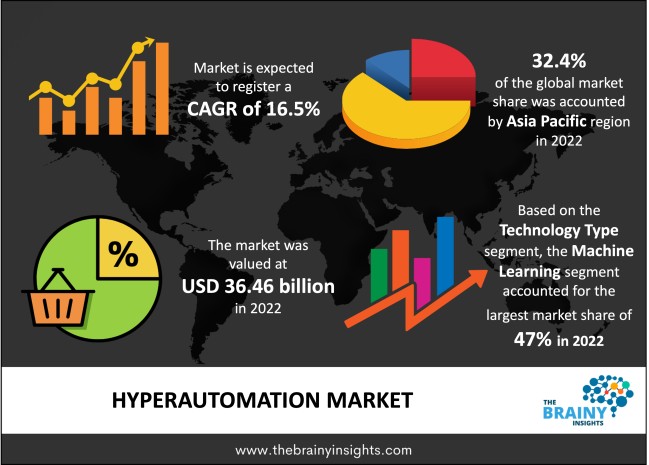
The global Hyperautomation market was valued at USD 36.46 billion in 2022 and growing at a CAGR of 16.5% from 2023 to 2032. The market is expected to reach USD 168 billion by 2032. Digitization of traditional manufacturing plants has propelled the growth of the Hyperautomation Market. Further, increased demand to lower overall business operational costs may also provide lucrative opportunities towards the growth of the Hyperautomation Market, in the period forecasted.
Hyperautomation is a business mechanism that integrates Artificial Intelligence (AI), Machine Learning (ML), Robotic Process Automation (RPA) and solves the complex business problems. Every increasing market and a need to survive in the competitive environment. Management must adapt itself as per the changing environmental factors. Thus, in the organizations are constantly adapting Hyperautomation, as a technological solution, to solve not only the redundant activities but also the complex mechanisms that were difficult to carry out in the past.
Hyperautomation is designed to streamline the end-to-end business processes. This is done by easy use of data collection, segregation and decision making from the complex set of problems. Various private institutions and startups are also raising huge chunks of investments, to boost the growth and production of the market. For instance: Accel raised USD 18.3 Billion, in the year 2022 towards the growth and development of its AI-Based technology. Additionally, AEye raised USD 314 Million, in the year 2022 for advancing various robotic vision applications for its production line.
Get an overview of this study by requesting a free sample
Digitization of traditional manufacturing plants- Rising digitization and automation of the traditional manufacturing plants is one of the major factors that boosts the growth of the Hyperautomation Market. To solve complex data problems and minimizing unwanted efforts of the labor. Various organizations have adapted Hyperautomation to reduce their Operating Expenditure (OPEX) and enhance their productivity and efficiency levels.
Scarcity of skilled workers- With constantly evolving technology, their prevails higher demand for the skilled and trained professionals, who manages and streamlines the workflow effectively and efficiently. Therefore, lack of skilled workers may hamper the growth of the Hyperautomation market in the period forecasted.
Increased demand of Hyperautomation to lower overall business operational costs- rising demand of the Hyperauomated technological solutions for reducing business operational costs may propel the growth of the Hyperautomated Market, globally. This not only saves times, but also, energy, labor, and money of the organization. For instance: In May 2019, Thermax Limited adopted the hyperauomation systems for substituting manual chemical mixing process to hyperautomated solution. Thereby reducing the 40man days’ time to 15-man days’ time. Consequently, reducing the business operational costs.
The regions analyzed for the market include North America, Europe, South America, Asia Pacific, the Middle East, and Africa. North America emerged as the largest market for the global Hyperautomation market, accounting to 47% of the total market. Owing to increasing adoption of the technologies and entry of new market players in the region. Whereas Asia Pacific region is anticipated to exhibit highest growth rate over the period. Owing to rising investments on IT infrastructure from various countries such as, India, China, Japan. Furthermore, increasing demand for cloud-computing in these countries have also contributed towards the growth of the Hyperautomation market in this region.
Asia Pacific Region Hyperautomation Market Share in 2022 - 32.4%
www.thebrainyinsights.com
Check the geographical analysis of this market by requesting a free sample
Machine learning has dominated the market accounting to 47% of the total market. Machine learning is a branch of Artificial Intelligence which primarily uses algorithms & models. Thereby uncovering critical insights and other focus areas. Hence, rising adoption of machine learning, globally with boost the overall growth of the Hyperautomation market.
IT & Telecom segment has dominated the Hyperautomation market with with a market revenue of USD 45.23 Billion in 2022. It is also expected to be the fastest growing segment across the globe. Owing to increased adoption of Integrating Robotic Process Automation (RPA). This ultimately helps in simplifying the operational tasks and providing long-term revenue generation opportunities in the period forecasted.
| Attribute | Description |
|---|---|
| Market Size | Revenue (USD Billion) |
| Market size value in 2022 | USD 36.46 Billion |
| Market size value in 2032 | USD 168 Billion |
| CAGR (2023 to 2032) | 16.5% |
| Historical data | 2019-2021 |
| Base Year | 2022 |
| Forecast | 2023-2032 |
| Regional Segments | The regions analyzed for the market are Asia Pacific, Europe, South America, North America, and Middle East & Africa. Furthermore, the regions are further analyzed at the country level. |
| Segments | Type, End-User Industry |
As per The Brainy Insights, the size of the hyperautomation market was valued at USD 36.46 billion in 2022 to USD 168 billion by 2032.
The global hyperautomation market is growing at a CAGR of 16.5% during the forecast period 2023-2032.
The Asia Pacific region emerged as the largest market for the hyperautomation.
Digitization of traditional manufacturing plants will influence the market's growth.
1. Introduction
1.1. Objectives of the Study
1.2. Market Definition
1.3. Research Scope
1.4. Currency
1.5. Key Target Audience
2. Research Methodology and Assumptions
3. Executive Summary
4. Premium Insights
4.1. Porter’s Five Forces Analysis
4.2. Value Chain Analysis
4.3. Top Investment Pockets
4.3.1. Market Attractiveness Analysis by Type
4.3.2. Market Attractiveness Analysis by End-User Industry
4.3.3. Market Attractiveness Analysis by Region
4.4. Industry Trends
5. Market Dynamics
5.1. Market Evaluation
5.2. Drivers
5.2.1. Digitization of traditional manufacturing plants
5.3. Restraints
5.3.1. Scarcity of skilled workers
5.4. Opportunities
5.4.1. Increased demand to lower overall business operational costs.
5.5. Challenges
5.5.1. Higher installation and maintenance costs
6. Global Hyperautomation Market Analysis and Forecast, By Type
6.1. Segment Overview
6.2. Biometrics
6.3. Machine Learning
6.4. Context-Aware Computing
6.5. Natural Learning Generation
6.6. Chatbots
6.7. Robotic Process Automation
7. Global Hyperautomation Market Analysis and Forecast, By End-User Industry
7.1. Segment Overview
7.2. BFSI
7.3. Retail
7.4. IT & Telecom
7.5. Education
7.6. Automotive
7.7. Manufacturing
7.8. Healthcare & Life Science
8. Global Hyperautomation Market Analysis and Forecast, By Regional Analysis
8.1. Segment Overview
8.2. North America
8.2.1. U.S.
8.2.2. Canada
8.2.3. Mexico
8.3. Europe
8.3.1. Germany
8.3.2. France
8.3.3. U.K.
8.3.4. Italy
8.3.5. Spain
8.4. Asia-Pacific
8.4.1. Japan
8.4.2. China
8.4.3. India
8.5. South America
8.5.1. Brazil
8.6. Middle East and Africa
8.6.1. UAE
8.6.2. South Africa
9. Global Hyperautomation Market-Competitive Landscape
9.1. Overview
9.2. Market Share of Key Players in Global Hyperautomation Market
9.2.1. Global Company Market Share
9.2.2. North America Company Market Share
9.2.3. Europe Company Market Share
9.2.4. APAC Company Market Share
9.3. Competitive Situations and Trends
9.3.1. Product Launches and Developments
9.3.2. Partnerships, Collaborations, and Agreements
9.3.3. Mergers & Acquisitions
9.3.4. Expansions
10. Company Profiles
10.1. UiPath
10.1.1. Business Overview
10.1.2. Company Snapshot
10.1.3. Company Market Share Analysis
10.1.4. Company Product Portfolio
10.1.5. Recent Developments
10.1.6. SWOT Analysis
10.2. Wipro Ltd
10.2.1. Business Overview
10.2.2. Company Snapshot
10.2.3. Company Market Share Analysis
10.2.4. Company Product Portfolio
10.2.5. Recent Developments
10.2.6. SWOT Analysis
10.3. Tata Consultancy Services Ltd
10.3.1. Business Overview
10.3.2. Company Snapshot
10.3.3. Company Market Share Analysis
10.3.4. Company Product Portfolio
10.3.5. Recent Developments
10.3.6. SWOT Analysis
10.4. Mitsubishi Electric Corporation
10.4.1. Business Overview
10.4.2. Company Snapshot
10.4.3. Company Market Share Analysis
10.4.4. Company Product Portfolio
10.4.5. Recent Developments
10.4.6. SWOT Analysis
10.5. OneGlobe LLC
10.5.1. Business Overview
10.5.2. Company Snapshot
10.5.3. Company Market Share Analysis
10.5.4. Company Product Portfolio
10.5.5. Recent Developments
10.5.6. SWOT Analysis
10.6. SolveXia
10.6.1. Business Overview
10.6.2. Company Snapshot
10.6.3. Company Market Share Analysis
10.6.4. Company Product Portfolio
10.6.5. Recent Developments
10.6.6. SWOT Analysis
10.7. Appian
10.7.1. Business Overview
10.7.2. Company Snapshot
10.7.3. Company Market Share Analysis
10.7.4. Company Product Portfolio
10.7.5. Recent Developments
10.7.6. SWOT Analysis
10.8. Automation Anywhere Inc
10.8.1. Business Overview
10.8.2. Company Snapshot
10.8.3. Company Market Share Analysis
10.8.4. Company Product Portfolio
10.8.5. Recent Developments
10.8.6. SWOT Analysis
10.9. Allerin Tech Pvt. Ltd
10.9.1. Business Overview
10.9.2. Company Snapshot
10.9.3. Company Market Share Analysis
10.9.4. Company Product Portfolio
10.9.5. Recent Developments
10.9.6. SWOT Analysis
10.10. PagerDuty Inc
10.10.1. Business Overview
10.10.2. Company Snapshot
10.10.3. Company Market Share Analysis
10.10.4. Company Product Portfolio
10.10.5. Recent Developments
10.10.6. SWOT Analysis
10.11. Honeywell International Inc
10.11.1. Business Overview
10.11.2. Company Snapshot
10.11.3. Company Market Share Analysis
10.11.4. Company Product Portfolio
10.11.5. Recent Developments
10.11.6. SWOT Analysis
List of Table
1. Global Hyperautomation Market, By Type, 2019-2032 (USD Trillion)
2. Global Biometrics, Hyperautomation Market, By Region, 2019-2032 (USD Trillion)
3. Global Machine Learning, Hyperautomation Market, By Region, 2019-2032 (USD Trillion)
4. Global Context-Aware Computing, Hyperautomation Market, By Region, 2019-2032 (USD Trillion)
5. Global Natural Learning Generation, Hyperautomation Market, By Region, 2019-2032 (USD Trillion)
6. Global Chatbots, Hyperautomation Market, By Region, 2019-2032 (USD Trillion)
7. Global Robotic Process Automation, Hyperautomation Market, By Region, 2019-2032 (USD Trillion)
8. Global Hyperautomation Market, By End-User Industry, 2019-2032 (USD Trillion)
9. Global BFSI, Hyperautomation Market, By Region, 2019-2032 (USD Trillion)
10. Global Retail, Hyperautomation Market, By Region, 2019-2032 (USD Trillion)
11. Global Information Technology (IT) & Telecom, Hyperautomation Market, By Region, 2019-2032 (USD Trillion)
12. Global Education, Hyperautomation Market, By Region, 2019-2032 (USD Trillion)
13. Global Automotive, Hyperautomation Market, By Region, 2019-2032 (USD Trillion)
14. Global Manufacturing, Hyperautomation Market, By Region, 2019-2032 (USD Trillion)
15. Global Healthcare & LifeScience, Hyperautomation Market, By Region, 2019-2032 (USD Trillion)
16. North America Hyperautomation Market, By Type, 2019-2032 (USD Trillion)
17. North America Hyperautomation Market, By End-User Industry, 2019-2032 (USD Trillion)
18. U.S. Hyperautomation Market, By Type, 2019-2032 (USD Trillion)
19. U.S. Hyperautomation Market, By End-User Industry, 2019-2032 (USD Trillion)
20. Canada Hyperautomation Market, By Type, 2019-2032 (USD Trillion)
21. Canada Hyperautomation Market, By End-User Industry, 2019-2032 (USD Trillion)
22. Mexico Hyperautomation Market, By Type, 2019-2032 (USD Trillion)
23. Mexico Hyperautomation Market, By End-User Industry, 2019-2032 (USD Trillion)
24. Europe Hyperautomation Market, By Type, 2019-2032 (USD Trillion)
25. Europe Hyperautomation Market, By End-User Industry, 2019-2032 (USD Trillion)
26. Germany Hyperautomation Market, By Type, 2019-2032 (USD Trillion)
27. Germany Hyperautomation Market, By End-User Industry, 2019-2032 (USD Trillion)
28. France Hyperautomation Market, By Type, 2019-2032 (USD Trillion)
29. France Hyperautomation Market, By Organization, 2019-2032 (USD Trillion)
30. U.K. Hyperautomation Market, By Type, 2019-2032 (USD Trillion)
31. U.K. Hyperautomation Market, By End-User Industry, 2019-2032 (USD Trillion)
32. Italy Hyperautomation Market, By Type, 2019-2032 (USD Trillion)
33. Italy Hyperautomation Market, By End-User Industry, 2019-2032 (USD Trillion)
34. Spain Hyperautomation Market, By Type, 2019-2032 (USD Trillion)
35. Spain Hyperautomation Market, By End-User Industry, 2019-2032 (USD Trillion)
36. Asia Pacific Hyperautomation Market, By Type, 2019-2032 (USD Trillion)
37. Asia Pacific Hyperautomation Market, By End-User Industry, 2019-2032 (USD Trillion)
38. Japan Hyperautomation Market, By Type, 2019-2032 (USD Trillion)
39. Japan Hyperautomation Market, By End-User Industry, 2019-2032 (USD Trillion)
40. China Hyperautomation Market, By Type, 2019-2032 (USD Trillion)
41. China Hyperautomation Market, By End-User Industry, 2019-2032 (USD Trillion)
42. India Hyperautomation Market, By Type, 2019-2032 (USD Trillion)
43. India Hyperautomation Market, By End-User Industry, 2019-2032 (USD Trillion)
44. South America Hyperautomation Market, By Type, 2019-2032 (USD Trillion)
45. South America Hyperautomation Market, By End-User Industry, 2019-2032 (USD Trillion)
46. Brazil Hyperautomation Market, By Type, 2019-2032 (USD Trillion)
47. Brazil Hyperautomation Market, By End-User Industry, 2019-2032 (USD Trillion)
48. Middle East and Africa Hyperautomation Market, By Type, 2019-2032 (USD Trillion)
49. Middle East and Africa Hyperautomation Market, By End-User Industry, 2019-2032 (USD Trillion)
50. UAE Hyperautomation Market, By Type, 2019-2032 (USD Trillion)
51. UAE Hyperautomation Market, By End-User Industry, 2019-2032 (USD Trillion)
52. South Africa Hyperautomation Market, By Type, 2019-2032 (USD Trillion)
53. South Africa Hyperautomation Market, By End-User Industry, 2019-2032 (USD Trillion)
List of Figures
1. Global Hyperautomation Market Segmentation
2. Global Hyperautomation Market: Research Methodology
3. Market Size Estimation Methodology: Bottom-Up Approach
4. Market Size Estimation Methodology: Top-Down Approach
5. Data Triangulation
6. Porter’s Five Forces Analysis
7. Value Chain Analysis
8. Global Hyperautomation Market Attractiveness Analysis by Type
9. Global Hyperautomation Market Attractiveness Analysis by End-User Industry
10. Global Hyperautomation Market Attractiveness Analysis by Region
11. Global Hyperautomation Market: Dynamics
12. Global Hyperautomation Market Share by Type (2023 & 2032)
13. Global Hyperautomation Market Share by End-User Industry (2023 & 2032)
14. Global Hyperautomation Market Share by Regions (2023 & 2032)
15. Global Hyperautomation Market Share by Company (2022)
This study forecasts revenue at global, regional, and country levels from 2019 to 2032. The Brainy Insights has segmented the global hyperautomation market based on below-mentioned segments:
Global Hyperautomation Market by Technology Type:
Global Hyperautomation Market by End-User Industry:
Global Hyperautomation Market by Region:
Research has its special purpose to undertake marketing efficiently. In this competitive scenario, businesses need information across all industry verticals; the information about customer wants, market demand, competition, industry trends, distribution channels etc. This information needs to be updated regularly because businesses operate in a dynamic environment. Our organization, The Brainy Insights incorporates scientific and systematic research procedures in order to get proper market insights and industry analysis for overall business success. The analysis consists of studying the market from a miniscule level wherein we implement statistical tools which helps us in examining the data with accuracy and precision.
Our research reports feature both; quantitative and qualitative aspects for any market. Qualitative information for any market research process are fundamental because they reveal the customer needs and wants, usage and consumption for any product/service related to a specific industry. This in turn aids the marketers/investors in knowing certain perceptions of the customers. Qualitative research can enlighten about the different product concepts and designs along with unique service offering that in turn, helps define marketing problems and generate opportunities. On the other hand, quantitative research engages with the data collection process through interviews, e-mail interactions, surveys and pilot studies. Quantitative aspects for the market research are useful to validate the hypotheses generated during qualitative research method, explore empirical patterns in the data with the help of statistical tools, and finally make the market estimations.
The Brainy Insights offers comprehensive research and analysis, based on a wide assortment of factual insights gained through interviews with CXOs and global experts and secondary data from reliable sources. Our analysts and industry specialist assume vital roles in building up statistical tools and analysis models, which are used to analyse the data and arrive at accurate insights with exceedingly informative research discoveries. The data provided by our organization have proven precious to a diverse range of companies, facilitating them to address issues such as determining which products/services are the most appealing, whether or not customers use the product in the manner anticipated, the purchasing intentions of the market and many others.
Our research methodology encompasses an idyllic combination of primary and secondary initiatives. Key phases involved in this process are listed below:

The phase involves the gathering and collecting of market data and its related information with the help of different sources & research procedures.

The data procurement stage involves in data gathering and collecting through various data sources.
This stage involves in extensive research. These data sources includes:
Purchased Database: Purchased databases play a crucial role in estimating the market sizes irrespective of the domain. Our purchased database includes:
Primary Research: The Brainy Insights interacts with leading companies and experts of the concerned domain to develop the analyst team’s market understanding and expertise. It improves and substantiates every single data presented in the market reports. Primary research mainly involves in telephonic interviews, E-mail interactions and face-to-face interviews with the raw material providers, manufacturers/producers, distributors, & independent consultants. The interviews that we conduct provides valuable data on market size and industry growth trends prevailing in the market. Our organization also conducts surveys with the various industry experts in order to gain overall insights of the industry/market. For instance, in healthcare industry we conduct surveys with the pharmacists, doctors, surgeons and nurses in order to gain insights and key information of a medical product/device/equipment which the customers are going to usage. Surveys are conducted in the form of questionnaire designed by our own analyst team. Surveys plays an important role in primary research because surveys helps us to identify the key target audiences of the market. Additionally, surveys helps to identify the key target audience engaged with the market. Our survey team conducts the survey by targeting the key audience, thus gaining insights from them. Based on the perspectives of the customers, this information is utilized to formulate market strategies. Moreover, market surveys helps us to understand the current competitive situation of the industry. To be precise, our survey process typically involve with the 360 analysis of the market. This analytical process begins by identifying the prospective customers for a product or service related to the market/industry to obtain data on how a product/service could fit into customers’ lives.

Secondary Research: The secondary data sources includes information published by the on-profit organizations such as World bank, WHO, company fillings, investor presentations, annual reports, national government documents, statistical databases, blogs, articles, white papers and others. From the annual report, we analyse a company’s revenue to understand the key segment and market share of that organization in a particular region. We analyse the company websites and adopt the product mapping technique which is important for deriving the segment revenue. In the product mapping method, we select and categorize the products offered by the companies catering to domain specific market, deduce the product revenue for each of the companies so as to get overall estimation of the market size. We also source data and analyses trends based on information received from supply side and demand side intermediaries in the value chain. The supply side denotes the data gathered from supplier, distributor, wholesaler and the demand side illustrates the data gathered from the end customers for respective market domain.

The supply side for a domain specific market is analysed by:
The demand side for the market is estimated through:
In-house Library: Apart from these third-party sources, we have our in-house library of qualitative and quantitative information. Our in-house database includes market data for various industry and domains. These data are updated on regular basis as per the changing market scenario. Our library includes, historic databases, internal audit reports and archives.
Sometimes there are instances where there is no metadata or raw data available for any domain specific market. For those cases, we use our expertise to forecast and estimate the market size in order to generate comprehensive data sets. Our analyst team adopt a robust research technique in order to produce the estimates:
Data Synthesis: This stage involves the analysis & mapping of all the information obtained from the previous step. It also involves in scrutinizing the data for any discrepancy observed while data gathering related to the market. The data is collected with consideration to the heterogeneity of sources. Robust scientific techniques are in place for synthesizing disparate data sets and provide the essential contextual information that can orient market strategies. The Brainy Insights has extensive experience in data synthesis where the data passes through various stages:


Market Deduction & Formulation: The final stage comprises of assigning data points at appropriate market spaces so as to deduce feasible conclusions. Analyst perspective & subject matter expert based holistic form of market sizing coupled with industry analysis also plays a crucial role in this stage.
This stage involves in finalization of the market size and numbers that we have collected from data integration step. With data interpolation, it is made sure that there is no gap in the market data. Successful trend analysis is done by our analysts using extrapolation techniques, which provide the best possible forecasts for the market.
Data Validation & Market Feedback: Validation is the most important step in the process. Validation & re-validation via an intricately designed process helps us finalize data-points to be used for final calculations.

The Brainy Insights interacts with leading companies and experts of the concerned domain to develop the analyst team’s market understanding and expertise. It improves and substantiates every single data presented in the market reports. The data validation interview and discussion panels are typically composed of the most experienced industry members. The participants include, however, are not limited to:
Moreover, we always validate our data and findings through primary respondents from all the major regions we are working on.


Free Customization
Fortune 500 Clients
Free Yearly Update On Purchase Of Multi/Corporate License
Companies Served Till Date