- +1-315-215-1633
- sales@thebrainyinsights.com

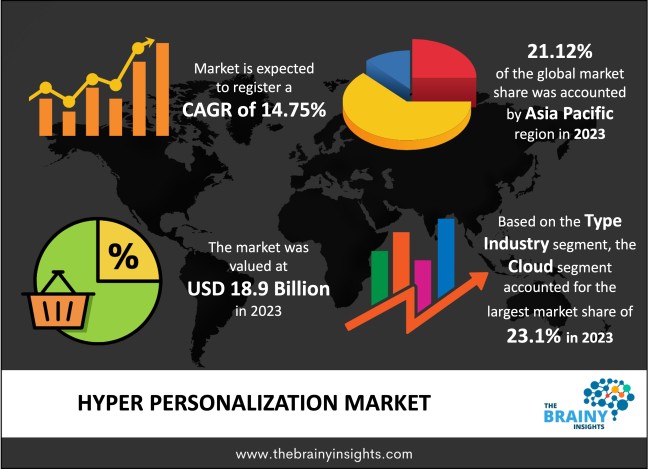
The global Hyper Personalization market was valued at USD 18.9 billion in 2023 and growing at a CAGR of 14.75% from 2024 to 2033. The market is expected to reach USD 74.82 billion by 2033. Increased customer preference towards one-to-one recommendations and personalized experiences and an increasing shift towards online shopping are the major driving factors propelling the growth of the Hyper Personalization Market in the forecasted period. Further, the introduction and advancements of smart devices may also provide lucrative opportunities for the growth of the Hyper Personalization Market.
Hyper Personalization is the most advanced strategy organizations adopt to enhance one-on-one marketing interactions with customers. This strategy is adopted using AI (Artificial Intelligence), Data Analytics, and Automation in the organization; Various SMEs have also adopted to delivery of personalized content using real-time data to individual users. Thus, with the adoption of this new strategy, organizations have leveled up higher customer satisfaction and customer engagement.
This advanced form of personalization is used in varied End-User Industries, ranging from BFSI, Retail, E-Commerce, Healthcare & Lifesciences to Media and Entertainment industries and others as well. For instance: the personalization method is used extensively in the E-Commerce industry to collect vast amounts of customer data, majorly from their browsing behavior, purchase history, and browsing history on various social media channels.
Hyper-personalization is a highly effective tool when brands have a complete understanding of their customers. With the help of hyper-personalization, brands can get their customers in their database and float contextualized messages to them as product targeting at their ideal time. Hyper-personalization is an advanced way to cater their market to individual customers.
Get an overview of this study by requesting a free sample
Increased customer preference towards personalized experience- Increased customer preference towards personalized experience is one of the major driving factors, propelling the growth of Hyper Personalized Market. Organizations heavily rely on Hyper Personalization to analyze behavioral and comprehend za ZZZZcustomer insights to enhance customer experience thereby increasing their satisfaction with the products/services offered by the organization.
Threat towards data breach and data security- Organizations encounter significant challenges in the form of data breaches and security threats, with the primary source of these issues stemming from the implementation of Hyper-Personalized software. This heightened level of personalization necessitates additional measures to safeguard consumer data.
Introduction and advancements of smart devices- Advancements of smart devices are one major factor that may create lucrative opportunities for Hyper Personalization devices in the market. For example, In Feb’23 Infosys introduced Infosys Equinox Studio, to manage their customer experience with minimal IT involvement for deploying, modifying, and building the same. This introduction of Infosys’ newest technology not only will help the business reduce their cost but also will help them create human-centric experiences in real-time.
The regions analyzed for the market include North America, Europe, South America, Asia Pacific, the Middle East, and Africa. North America emerged as the largest market for the global Hyper Personalization market, accounting for 43.23% of the total market. Owing to technological advancements, rising consumer awareness towards advanced features, and the presence of key market players. Whereas Europe is anticipated to exhibit the highest growth rate over the period. Owing to the rapid adoption of digital technologies and focus on personalized experience have also contributed to the growth of the Hyper Personalization market in this region.
Asia Pacific Region Hyper Personalization Market Share in 2023 - 21.12%
www.thebrainyinsights.com
Check the geographical analysis of this market by requesting a free sample
Cloud has dominated the market accounting for 23.1% of the total market. Rising awareness towards connecting consumers with brands globally and rapid adoption of the technology has raised market demand for Cloud in the Hyper Personalization Market.
The E-Commerce segment has dominated the Hyper Personalization market with a market revenue of USD 5.01 Billion in 2023. It is also expected to be the fastest-growing segment across the globe. Owing to the increased adoption of technology. This ultimately helps in simplifying the tasks and providing long-term revenue generation opportunities in the period forecasted.
| Attribute | Description |
|---|---|
| Market Size | Revenue (USD Billion) |
| Market size value in 2023 | USD 18.9 Billion |
| Market size value in 2033 | USD 74.82 Billion |
| CAGR (2024 to 2033) | 14.75% |
| Historical data | 2020-2022 |
| Base Year | 2023 |
| Forecast | 2024-2033 |
| Region | The regions analyzed for the market are Asia Pacific, Europe, South America, North America, and Middle East & Africa. Furthermore, the regions are further analyzed at the country level. |
| Segments | Type, End-User Industry |
As per The Brainy Insights, the size of the hyper personalization market was valued at USD 18.9 billion in 2023 to USD 74.82 billion by 2033.
The global hyper personalization market is growing at a CAGR of 14.75% during the forecast period 2024-2033.
The Asia Pacific region emerged as the largest market for the hyper personalization.
The increased customer preference towards personalized experience will influence the market's growth.
1. Introduction
1.1. Objectives of the Study
1.2. Market Definition
1.3. Research Scope
1.4. Currency
1.5. Key Target Audience
2. Research Methodology and Assumptions
3. Executive Summary
4. Premium Insights
4.1. Porter’s Five Forces Analysis
4.2. Value Chain Analysis
4.3. Top Investment Pockets
4.3.1. Market Attractiveness Analysis by Type
4.3.2. Market Attractiveness Analysis by End-User Industry
4.3.3. Market Attractiveness Analysis by Region
4.4. Industry Trends
5. Market Dynamics
5.1. Market Evaluation
5.2. Drivers
5.2.1. Increased customer preference towards one to one recommendation and personalized experience
5.2.2. Increasing shift towards online shopping
5.3. Restraints
5.3.1. Threat towards data breach and data security
5.4. Opportunities
5.4.1. Introduction and advancements of smart devices
5.5. Challenges
5.5.1. Lack of skilled workforce to manage complex data sets and handle data queries
6. Global Hyper Personalization Market Analysis and Forecast, By Type
6.1. Segment Overview
6.2. On-premises
6.3. Cloud-based
7. Global Hyper Personalization Market Analysis and Forecast, By End-User Industry
7.1. Segment Overview
7.2. BFSI
7.3. Retail
7.4. E-Commerce
7.5. Healthcare & Life Science
7.6. Media and Entertainment
7.7. Education
7.8. Others
8. Global Hyper Personalization Market Analysis and Forecast, By Regional Analysis
8.1. Segment Overview
8.2. North America
8.2.1. U.S.
8.2.2. Canada
8.2.3. Mexico
8.3. Europe
8.3.1. Germany
8.3.2. France
8.3.3. U.K.
8.3.4. Italy
8.3.5. Spain
8.4. Asia-Pacific
8.4.1. Japan
8.4.2. China
8.4.3. India
8.5. South America
8.5.1. Brazil
8.6. Middle East and Africa
8.6.1. UAE
8.6.2. South Africa
9. Global Hyper Personalization Market-Competitive Landscape
9.1. Overview
9.2. Market Share of Key Players in Global Hyper Personalization Market
9.2.1. Global Company Market Share
9.2.2. North America Company Market Share
9.2.3. Europe Company Market Share
9.2.4. APAC Company Market Share
9.3. Competitive Situations and Trends
9.3.1. Product Launches and Developments
9.3.2. Partnerships, Collaborations, and Agreements
9.3.3. Mergers & Acquisitions
9.3.4. Expansions
10. Company Profiles
10.1. PepsiCo Ltd
10.1.1. Business Overview
10.1.2. Company Snapshot
10.1.3. Company Market Share Analysis
10.1.4. Company Product Portfolio
10.1.5. Recent Developments
10.1.6. SWOT Analysis
10.2. Salesforce.com Inc
10.2.1. Business Overview
10.2.2. Company Snapshot
10.2.3. Company Market Share Analysis
10.2.4. Company Product Portfolio
10.2.5. Recent Developments
10.2.6. SWOT Analysis
10.3. IBM Corporation
10.3.1. Business Overview
10.3.2. Company Snapshot
10.3.3. Company Market Share Analysis
10.3.4. Company Product Portfolio
10.3.5. Recent Developments
10.3.6. SWOT Analysis
10.4. Amazon Web Services Inc
10.4.1. Business Overview
10.4.2. Company Snapshot
10.4.3. Company Market Share Analysis
10.4.4. Company Product Portfolio
10.4.5. Recent Developments
10.4.6. SWOT Analysis
10.5. Oracle Corporation
10.5.1. Business Overview
10.5.2. Company Snapshot
10.5.3. Company Market Share Analysis
10.5.4. Company Product Portfolio
10.5.5. Recent Developments
10.5.6. SWOT Analysis
10.6. Google LLC
10.6.1. Business Overview
10.6.2. Company Snapshot
10.6.3. Company Market Share Analysis
10.6.4. Company Product Portfolio
10.6.5. Recent Developments
10.6.6. SWOT Analysis
10.7. SAP SE
10.7.1. Business Overview
10.7.2. Company Snapshot
10.7.3. Company Market Share Analysis
10.7.4. Company Product Portfolio
10.7.5. Recent Developments
10.7.6. SWOT Analysis
10.8. Microsoft Corporation
10.8.1. Business Overview
10.8.2. Company Snapshot
10.8.3. Company Market Share Analysis
10.8.4. Company Product Portfolio
10.8.5. Recent Developments
10.8.6. SWOT Analysis
10.9. SAS Institute Inc
10.9.1. Business Overview
10.9.2. Company Snapshot
10.9.3. Company Market Share Analysis
10.9.4. Company Product Portfolio
10.9.5. Recent Developments
10.9.6. SWOT Analysis
10.10. Infosys Ltd
10.10.1. Business Overview
10.10.2. Company Snapshot
10.10.3. Company Market Share Analysis
10.10.4. Company Product Portfolio
10.10.5. Recent Developments
10.10.6. SWOT Analysis
List of Table
1. Global Hyper Personalization Market, By Type, 2020-2033(USD Billion)
2. Global On-premises, Hyper Personalization Market, By Region, 2020-2033(USD Billion)
3. Global Cloud-based, Hyper Personalization Market, By Region, 2020-2033(USD Billion)
4. Global Hyper Personalization Market, By End-User Industry, 2020-2033(USD Billion)
5. Global BFSI, Hyper Personalization Market, By Region, 2020-2033(USD Billion)
6. Global Retail, Hyper Personalization Market, By Region, 2020-2033(USD Billion)
7. Global E-Commerce, Hyper Personalization Market, By Region, 2020-2033(USD Billion)
8. Global Healthcare & Life Science, Hyper Personalization Market, By Region, 2020-2033(USD Billion)
9. Global Media and Entertainment, Hyper Personalization Market, By Region, 2020-2033(USD Billion)
10. Global Education, Hyper Personalization Market, By Region, 2020-2033(USD Billion)
11. Global Others, Hyper Personalization Market, By Region, 2020-2033(USD Billion)
12. North America Hyper Personalization Market, By Type, 2020-2033(USD Billion)
13. North America Hyper Personalization Market, By End-User Industry, 2020-2033(USD Billion)
14. U.S. Hyper Personalization Market, By Type, 2020-2033(USD Billion)
15. U.S. Hyper Personalization Market, By End-User Industry, 2020-2033(USD Billion)
16. Canada Hyper Personalization Market, By Type, 2020-2033(USD Billion)
17. Canada Hyper Personalization Market, By End-User Industry, 2020-2033(USD Billion)
18. Mexico Hyper Personalization Market, By Type, 2020-2033(USD Billion)
19. Mexico Hyper Personalization Market, By End-User Industry, 2020-2033(USD Billion)
20. Europe Hyper Personalization Market, By Type, 2020-2033(USD Billion)
21. Europe Hyper Personalization Market, By End-User Industry, 2020-2033(USD Billion)
22. Germany Hyper Personalization Market, By Type, 2020-2033(USD Billion)
23. Germany Hyper Personalization Market, By End-User Industry, 2020-2033(USD Billion)
24. France Hyper Personalization Market, By Type, 2020-2033(USD Billion)
25. France Hyper Personalization Market, By End-User Industry, 2020-2033(USD Billion)
26. U.K. Hyper Personalization Market, By Type, 2020-2033(USD Billion)
27. U.K. Hyper Personalization Market, By End-User Industry, 2020-2033(USD Billion)
28. Italy Hyper Personalization Market, By Type, 2020-2033(USD Billion)
29. Italy Hyper Personalization Market, By End-User Industry, 2020-2033(USD Billion)
30. Spain Hyper Personalization Market, By Type, 2020-2033(USD Billion)
31. Spain Hyper Personalization Market, By End-User Industry, 2020-2033(USD Billion)
32. Asia Pacific Hyper Personalization Market, By Type, 2020-2033(USD Billion)
33. Asia Pacific Hyper Personalization Market, By End-User Industry, 2020-2033(USD Billion)
34. Japan Hyper Personalization Market, By Type, 2020-2033(USD Billion)
35. Japan Hyper Personalization Market, By End-User Industry, 2020-2033(USD Billion)
36. China Hyper Personalization Market, By Type, 2020-2033(USD Billion)
37. China Hyper Personalization Market, By End-User Industry, 2020-2033(USD Billion)
38. India Hyper Personalization Market, By Type, 2020-2033(USD Billion)
39. India Hyper Personalization Market, By End-User Industry, 2020-2033(USD Billion)
40. South America Hyper Personalization Market, By Type, 2020-2033(USD Billion)
41. South America Hyper Personalization Market, By End-User Industry, 2020-2033(USD Billion)
42. Brazil Hyper Personalization Market, By Type, 2020-2033(USD Billion)
43. Brazil Hyper Personalization Market, By End-User Industry, 2020-2033(USD Billion)
44. Middle East and Africa Hyper Personalization Market, By Type, 2020-2033(USD Billion)
45. Middle East and Africa Hyper Personalization Market, By End-User Industry, 2020-2033(USD Billion)
46. UAE Hyper Personalization Market, By Type, 2020-2033(USD Billion)
47. UAE Hyper Personalization Market, By End-User Industry, 2020-2033(USD Billion)
48. South Africa Hyper Personalization Market, By Type, 2020-2033(USD Billion)
49. South Africa Hyper Personalization Market, By End-User Industry, 2020-2033(USD Billion)
List of Figures
1. Global Hyper Personalization Market Segmentation
2. Global Hyper Personalization Market: Research Methodology
3. Market Size Estimation Methodology: Bottom-Up Approach
4. Market Size Estimation Methodology: Top-Down Approach
5. Data Triangulation
6. Porter’s Five Forces Analysis
7. Value Chain Analysis
8. Global Hyper Personalization Market Attractiveness Analysis by Type
9. Global Hyper Personalization Market Attractiveness Analysis by End-User Industry
10. Global Hyper Personalization Market Attractiveness Analysis by Region
11. Global Hyper Personalization Market: Dynamics
12. Global Hyper Personalization Market Share by Type (2024 & 2033)
13. Global Hyper Personalization Market Share by End-User Industry (2024 & 2033)
14. Global Hyper Personalization Market Share by Regions (2024 & 2033)
15. Global Hyper Personalization Market Share by Company (2023)
This study forecasts revenue at global, regional, and country levels from 2020 to 2033. The Brainy Insights has segmented the global hyper personalization market based on below-mentioned segments:
Global Hyper Personalization Market by Type:
Global Hyper Personalization Market by End-User Industry:
Global Hyper Personalization Market by Region:
Research has its special purpose to undertake marketing efficiently. In this competitive scenario, businesses need information across all industry verticals; the information about customer wants, market demand, competition, industry trends, distribution channels etc. This information needs to be updated regularly because businesses operate in a dynamic environment. Our organization, The Brainy Insights incorporates scientific and systematic research procedures in order to get proper market insights and industry analysis for overall business success. The analysis consists of studying the market from a miniscule level wherein we implement statistical tools which helps us in examining the data with accuracy and precision.
Our research reports feature both; quantitative and qualitative aspects for any market. Qualitative information for any market research process are fundamental because they reveal the customer needs and wants, usage and consumption for any product/service related to a specific industry. This in turn aids the marketers/investors in knowing certain perceptions of the customers. Qualitative research can enlighten about the different product concepts and designs along with unique service offering that in turn, helps define marketing problems and generate opportunities. On the other hand, quantitative research engages with the data collection process through interviews, e-mail interactions, surveys and pilot studies. Quantitative aspects for the market research are useful to validate the hypotheses generated during qualitative research method, explore empirical patterns in the data with the help of statistical tools, and finally make the market estimations.
The Brainy Insights offers comprehensive research and analysis, based on a wide assortment of factual insights gained through interviews with CXOs and global experts and secondary data from reliable sources. Our analysts and industry specialist assume vital roles in building up statistical tools and analysis models, which are used to analyse the data and arrive at accurate insights with exceedingly informative research discoveries. The data provided by our organization have proven precious to a diverse range of companies, facilitating them to address issues such as determining which products/services are the most appealing, whether or not customers use the product in the manner anticipated, the purchasing intentions of the market and many others.
Our research methodology encompasses an idyllic combination of primary and secondary initiatives. Key phases involved in this process are listed below:

The phase involves the gathering and collecting of market data and its related information with the help of different sources & research procedures.

The data procurement stage involves in data gathering and collecting through various data sources.
This stage involves in extensive research. These data sources includes:
Purchased Database: Purchased databases play a crucial role in estimating the market sizes irrespective of the domain. Our purchased database includes:
Primary Research: The Brainy Insights interacts with leading companies and experts of the concerned domain to develop the analyst team’s market understanding and expertise. It improves and substantiates every single data presented in the market reports. Primary research mainly involves in telephonic interviews, E-mail interactions and face-to-face interviews with the raw material providers, manufacturers/producers, distributors, & independent consultants. The interviews that we conduct provides valuable data on market size and industry growth trends prevailing in the market. Our organization also conducts surveys with the various industry experts in order to gain overall insights of the industry/market. For instance, in healthcare industry we conduct surveys with the pharmacists, doctors, surgeons and nurses in order to gain insights and key information of a medical product/device/equipment which the customers are going to usage. Surveys are conducted in the form of questionnaire designed by our own analyst team. Surveys plays an important role in primary research because surveys helps us to identify the key target audiences of the market. Additionally, surveys helps to identify the key target audience engaged with the market. Our survey team conducts the survey by targeting the key audience, thus gaining insights from them. Based on the perspectives of the customers, this information is utilized to formulate market strategies. Moreover, market surveys helps us to understand the current competitive situation of the industry. To be precise, our survey process typically involve with the 360 analysis of the market. This analytical process begins by identifying the prospective customers for a product or service related to the market/industry to obtain data on how a product/service could fit into customers’ lives.

Secondary Research: The secondary data sources includes information published by the on-profit organizations such as World bank, WHO, company fillings, investor presentations, annual reports, national government documents, statistical databases, blogs, articles, white papers and others. From the annual report, we analyse a company’s revenue to understand the key segment and market share of that organization in a particular region. We analyse the company websites and adopt the product mapping technique which is important for deriving the segment revenue. In the product mapping method, we select and categorize the products offered by the companies catering to domain specific market, deduce the product revenue for each of the companies so as to get overall estimation of the market size. We also source data and analyses trends based on information received from supply side and demand side intermediaries in the value chain. The supply side denotes the data gathered from supplier, distributor, wholesaler and the demand side illustrates the data gathered from the end customers for respective market domain.

The supply side for a domain specific market is analysed by:
The demand side for the market is estimated through:
In-house Library: Apart from these third-party sources, we have our in-house library of qualitative and quantitative information. Our in-house database includes market data for various industry and domains. These data are updated on regular basis as per the changing market scenario. Our library includes, historic databases, internal audit reports and archives.
Sometimes there are instances where there is no metadata or raw data available for any domain specific market. For those cases, we use our expertise to forecast and estimate the market size in order to generate comprehensive data sets. Our analyst team adopt a robust research technique in order to produce the estimates:
Data Synthesis: This stage involves the analysis & mapping of all the information obtained from the previous step. It also involves in scrutinizing the data for any discrepancy observed while data gathering related to the market. The data is collected with consideration to the heterogeneity of sources. Robust scientific techniques are in place for synthesizing disparate data sets and provide the essential contextual information that can orient market strategies. The Brainy Insights has extensive experience in data synthesis where the data passes through various stages:


Market Deduction & Formulation: The final stage comprises of assigning data points at appropriate market spaces so as to deduce feasible conclusions. Analyst perspective & subject matter expert based holistic form of market sizing coupled with industry analysis also plays a crucial role in this stage.
This stage involves in finalization of the market size and numbers that we have collected from data integration step. With data interpolation, it is made sure that there is no gap in the market data. Successful trend analysis is done by our analysts using extrapolation techniques, which provide the best possible forecasts for the market.
Data Validation & Market Feedback: Validation is the most important step in the process. Validation & re-validation via an intricately designed process helps us finalize data-points to be used for final calculations.

The Brainy Insights interacts with leading companies and experts of the concerned domain to develop the analyst team’s market understanding and expertise. It improves and substantiates every single data presented in the market reports. The data validation interview and discussion panels are typically composed of the most experienced industry members. The participants include, however, are not limited to:
Moreover, we always validate our data and findings through primary respondents from all the major regions we are working on.


Free Customization
Fortune 500 Clients
Free Yearly Update On Purchase Of Multi/Corporate License
Companies Served Till Date