- +1-315-215-1633
- sales@thebrainyinsights.com

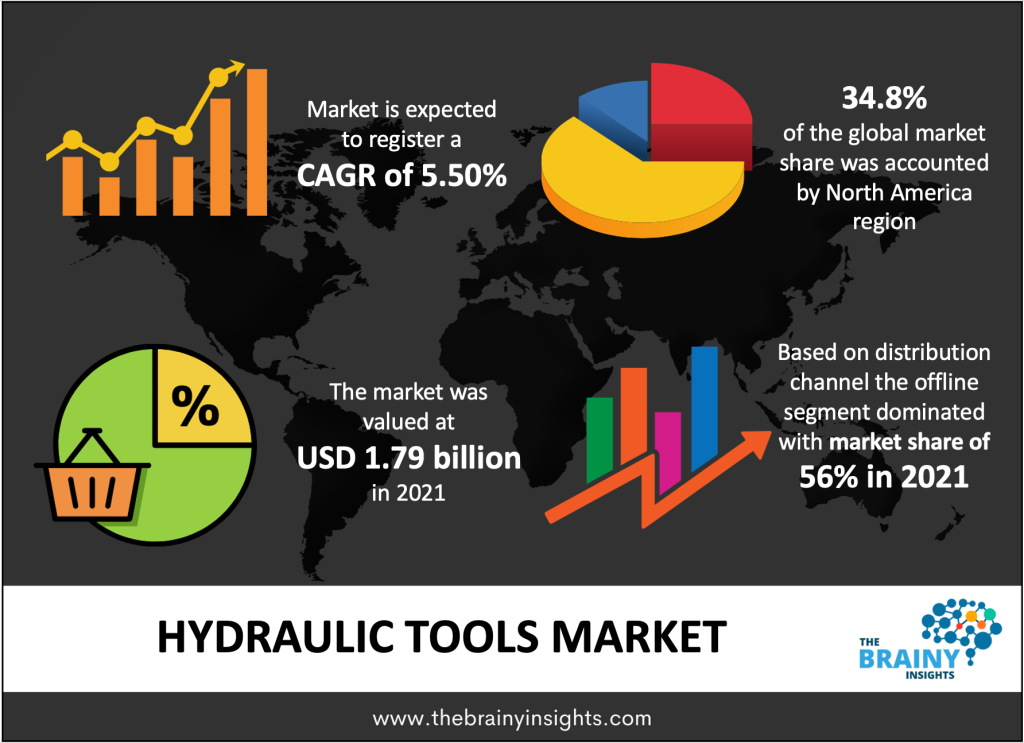
The global hydraulic tools market was valued at USD 1.79 billion in 2021, expected to reach USD 2.89 billion by 2030 which is growing at a CAGR of 5.50% from 2022 to 2030. The Asia Pacific is expected to grow the fastest during the forecast period
Hydraulic tools are high-powered tools that utilize pressurized fluid to drive hydraulic machinery. The fluid pushes via hydraulic tubes and into the tool’s actuator, where the pressure accumulated in the fluid is moved to the machine’s moving parts. Then the fluid is channeled back via a pumping mechanism to be re-pressurized. Hydraulic tools are robust, movable, and flexible enough for various uses. Numerous hydraulic tools can be connected to a hydraulic power unit or attached to the hydraulic system of a larger part of the equipment. Hydraulic tools are a generic term that contains low to high-pressure equipment and tooling. Tools are not only limited to drills, cylinders, crimpers, jacks, spreaders, cutters, splitters, breakers, drivers, torque wrenches, punches, and saws.
Hydraulic tools and systems are operated in small and large industries, including constructing new facilities, production, and infrastructure such as bridges. The aerospace industry utilizes hydraulic equipment for power generation, robotics, and construction. However, it is an efficient and cost-effective way to form repetitive action for which hydraulic system-based equipment is well suited. The function of a hydraulic system may be different depending on its application. Regardless, all hydraulic systems work via similar basic rules that involve using a fluid pumped into a pressure chamber. The force on a plate area in the chamber drives a piston designed to execute a specific task. Hydraulic systems transfer power by using fluid pressure within a sealed system. The brakes on wheelchair, lifts, cars, trucks, hydraulic jacks, and wing flaps on aircraft generally use hydraulic systems. Multiple manufacturers use hydraulic systems due to their benefits over mechanical and electrical systems, such as offering high power in a small space. In contrast, the fluid leakage from the system can create a problem and a hindrance, after which the system doesn't work. Hydraulic tools are hand-used machines with hydraulic drives operated for different technological functions, like pressing parts in and out and tightening threaded joints. It utilizes a pressurized fluid, commonly hydraulic oil, as the basis of power to perform a work, which gives several advantages over alternative power solutions.
Get an overview of this study by requesting a free sample
Improve Efficiency- Hydraulics is essential for moving considerable amounts of weight. When liquids are compressed, it has the potential to form a force ten times greater than the amount of pressure that was initially applied, which shows the possibility of moving hefty weight with less power used. Water is compressed within a machine under forces which is less important than the rate at which it comes out. The rules permit the hydraulics to move large amounts of weight quickly, which helps in improving efficiency.
Easy To Control- Hydraulics allow users to control whatever weight is transferred from a remote or control panel. An operator starts, stops, raises, lowers, accelerates, or decelerates a button with a single push. Elevators are an excellent illustration of the simplicity of hydraulics. With just a push of a button, a hydraulic system can take people down or up on many floors of a hotel, office building, or residential society. When operating heavy machinery, individuals enjoy the simplistic qualities of hydraulics to place their equipment in specific locations for work.
Leakage Problem- If hydraulic systems don't have hydraulic fluids, they will not function, which creates a problem when a leakage happens. The leak should be repaired so that the hydraulic fluids can continue to produce flow; else, the hydraulic system will begin to slow down. Regardless, places that have leakage will have increased temperatures. However, this phenomenon can be advantageous since these temperatures can help the operators of the hydraulic systems to find the leak and prevent the leaks by using proper plumbing techniques and the appropriate materials and by performing routine preventative maintenance.
New advanced technologies- The hydraulic industry is pushing forward to make user interface applications. Parker has already developed a UX Toolkit software tool that streamlines all machine applications. The application contained core machine functions, diagnostics or prediction applications that reduce downtime, smart control systems, and GPS monitoring & navigation applications. By operating Parker’s pro display human-machine interface module, the preferred features can be concentrated into a single display and a uniform user interface.
The regions analyzed for the market include North America, Europe, South America, Asia Pacific, the Middle East, and Africa. North America emerged as the largest market for the global hydraulic tools market, with a 34.8% share of the market revenue in 2021.
In North America, 80% of mining is considered surface mining, in which the overlying mineral layer, and the overburden, are destroyed. Then the mineral is extracted with the use of shafts or tunnels. The two-part process in surface mining includes the power of hydraulics. Hydraulics make mineral extraction achievable safely and efficiently. To clear the overburden and to support access to the minerals.
North America Region Hydraulic Tools Market Share in 2021 - 34.8%
www.thebrainyinsights.com
Check the geographical analysis of this market by requesting a free sample
The type segment is divided into hydraulic rescue tool, tension and torque tools, hydraulic cylinder and jack, and others. The hydraulic cylinder and jack segment dominated the market, with a market share of around 25% in 2021. Hydraulic cylinders and hydraulic jacks can be designed to any level of sophistication, right from easy to hard design.
The distribution channels segment is divided into online and offline. The offline segment dominated the market, with a market share of around 56% in 2021. COVID-19 has impacted the online global hydraulic tools market sales and is anticipated to hinder the global hydraulic tools market development.
The end user segment is divided into railway, gas, and petrochemical, industrial manufacturing, electric utility, oil, and others. The industrial manufacturing segment dominated the market, with a market share of around 17.2% in 2021. Hydraulic tools can form much greater force than pneumatic tools of a similar size due to fluids being incompressible, permitting hydraulic systems to run at much more increased pressure levels. Hydraulic tools are usually used in heavy-duty and construction industries.
North America region emerged as the largest market for the hydraulic tools market.
Improved efficiency helps to propel market growth.
Leakage problem can hinder market growth.
New advanced technologies will provide huge opportunities to the market.
1. Introduction
1.1. Objectives of the Study
1.2. Market Definition
1.3. Research Scope
1.4. Currency
1.5. Key Target Audience
2. Research Methodology and Assumptions
3. Executive Summary
4. Premium Insights
4.1. Porter’s Five Forces Analysis
4.2. Value Chain Analysis
4.3. Top Investment Pockets
4.3.1. Market Attractiveness Analysis by Type
4.3.2. Market Attractiveness Analysis by Distribution Channels
4.3.3. Market Attractiveness Analysis by End User
4.3.4. Market Attractiveness Analysis by Region
4.4. Industry Trends
5. Market Dynamics
5.1. Market Evaluation
5.2. Drivers
5.2.1. Improve efficiency to propel market growth
5.3. Restraints
5.3.1. Leakage problem to hinder market growth
5.4. Opportunities
5.4.1. New advanced technologies
6. Global Hydraulic Tools Market Analysis and Forecast, By Type:
6.1. Segment Overview
6.2. Hydraulic Rescue Tool
6.3. Tension and Torque Tools
6.4. Hydraulic Cylinder and Jack
6.5. Others
7. Global Hydraulic Tools Market Analysis and Forecast, By Distribution Channels
7.1. Segment Overview
7.2. Online
7.3. Offline
8. Global Hydraulic Tools Market Analysis and Forecast, By End User
8.1. Segment Overview
8.2. Railway
8.3. Gas And Petrochemical
8.4. Industrial Manufacturing
8.5. Electric Utility
8.6. Oil
8.7. Others
9. Global Hydraulic Tools Market Analysis and Forecast, By Regional Analysis
9.1. Segment Overview
9.2. North America
9.2.1. U.S.
9.2.2. Canada
9.2.3. Mexico
9.3. Europe
9.3.1. Germany
9.3.2. France
9.3.3. U.K.
9.3.4. Italy
9.3.5. Spain
9.4. Asia-Pacific
9.4.1. Japan
9.4.2. China
9.4.3. India
9.5. South America
9.5.1. Brazil
9.6. Middle East and Africa
9.6.1. UAE
9.6.2. South Africa
10. Global Hydraulic Tools Market-Competitive Landscape
10.1. Overview
10.2. Market Share of Key Players in the Hydraulic Tools Market
10.2.1. Global Company Market Share
10.2.2. North America Company Market Share
10.2.3. Europe Company Market Share
10.2.4. APAC Company Market Share
10.3. Competitive Situations and Trends
10.3.1. Product Launches and Developments
10.3.2. Partnerships, Collaborations, and Agreements
10.3.3. Mergers & Acquisitions
10.3.4. Expansions
11. Company Profiles
11.1. Textron Inc
11.1.1. Business Overview
11.1.2. Company Snapshot
11.1.3. Company Market Share Analysis
11.1.4. Company Product Portfolio
11.1.5. Recent Developments
11.1.6. SWOT Analysis
11.2. SPX Flow
11.2.1. Business Overview
11.2.2. Company Snapshot
11.2.3. Company Market Share Analysis
11.2.4. Company Product Portfolio
11.2.5. Recent Developments
11.2.6. SWOT Analysis
11.3. Shinn Fu
11.3.1. Business Overview
11.3.2. Company Snapshot
11.3.3. Company Market Share Analysis
11.3.4. Company Product Portfolio
11.3.5. Recent Developments
11.3.6. SWOT Analysis
11.4. Kudos Mechanical Co., Ltd
11.4.1. Business Overview
11.4.2. Company Snapshot
11.4.3. Company Market Share Analysis
11.4.4. Company Product Portfolio
11.4.5. Recent Developments
11.4.6. SWOT Analysis
11.5. IDEX Corporation
11.5.1. Business Overview
11.5.2. Company Snapshot
11.5.3. Company Market Share Analysis
11.5.4. Company Product Portfolio
11.5.5. Recent Developments
11.5.6. SWOT Analysis
11.6. HTL Worldwide Ltd
11.6.1. Business Overview
11.6.2. Company Snapshot
11.6.3. Company Market Share Analysis
11.6.4. Company Product Portfolio
11.6.5. Recent Developments
11.6.6. SWOT Analysis
11.7. Hi-Force
11.7.1. Business Overview
11.7.2. Company Snapshot
11.7.3. Company Market Share Analysis
11.7.4. Company Product Portfolio
11.7.5. Recent Developments
11.7.6. SWOT Analysis
11.8. Cembre Inc.
11.8.1. Business Overview
11.8.2. Company Snapshot
11.8.3. Company Market Share Analysis
11.8.4. Company Product Portfolio
11.8.5. Recent Developments
11.8.6. SWOT Analysis
11.9. Atlas Copco AB
11.9.1. Business Overview
11.9.2. Company Snapshot
11.9.3. Company Market Share Analysis
11.9.4. Company Product Portfolio
11.9.5. Recent Developments
11.9.6. SWOT Analysis
11.10. Actuant Corporation
11.10.1. Business Overview
11.10.2. Company Snapshot
11.10.3. Company Market Share Analysis
11.10.4. Company Product Portfolio
11.10.5. Recent Developments
11.10.6. SWOT Analysis
List of Table
1. Global Hydraulic Tools Market, By Type, 2019-2030 (USD Billion)
2. Global Hydraulic Rescue Tool Hydraulic Tools Market, By Region, 2019-2030 (USD Billion)
3. Global Tension and Torque Tools Hydraulic Tools Market, By Region, 2019-2030 (USD Billion)
4. Global Hydraulic Cylinder and Jack Hydraulic Tools Market, By Region, 2019-2030 (USD Billion)
5. Global Others Hydraulic Tools Market, By Region, 2019-2030 (USD Billion)
6. Global Hydraulic Tools Market, By Distribution Channels, 2019-2030 (USD Billion)
7. Global Online Hydraulic Tools Market, By Region, 2019-2030 (USD Billion)
8. Global Offline Hydraulic Tools Market, By Region, 2019-2030 (USD Billion)
9. Global Hydraulic Tools Market, By End User, 2019-2030 (USD Billion)
10. Global Railway Hydraulic Tools Market, By Region, 2019-2030 (USD Billion)
11. Global Gas and Petrochemical Hydraulic Tools Market, By Region, 2019-2030 (USD Billion)
12. Global Industrial Manufacturing Hydraulic Tools Market, By Region, 2019-2030 (USD Billion)
13. Global Electric Utility Hydraulic Tools Market, By Region, 2019-2030 (USD Billion)
14. Global oil Hydraulic Tools Market, By Region, 2019-2030 (USD Billion)
15. Global others Hydraulic Tools Market, By Region, 2019-2030 (USD Billion)
16. North America Hydraulic Tools Market, By Type, 2019-2030 (USD Billion)
17. North America Hydraulic Tools Market, By Distribution Channels, 2019-2030 (USD Billion)
18. North America Hydraulic Tools Market, By End User, 2019-2030 (USD Billion)
19. U.S. Hydraulic Tools Market, By Type, 2019-2030 (USD Billion)
20. U.S. Hydraulic Tools Market, By Distribution Channels, 2019-2030 (USD Billion)
21. U.S. Hydraulic Tools Market, By End User, 2019-2030 (USD Billion)
22. Canada Hydraulic Tools Market, By Type, 2019-2030 (USD Billion)
23. Canada Hydraulic Tools Market, By Distribution Channels, 2019-2030 (USD Billion)
24. Canada Hydraulic Tools Market, By End User, 2019-2030 (USD Billion)
25. Mexico Hydraulic Tools Market, By Type, 2019-2030 (USD Billion)
26. Mexico Hydraulic Tools Market, By Distribution Channels, 2019-2030 (USD Billion)
27. Mexico Hydraulic Tools Market, By End User, 2019-2030 (USD Billion)
28. Europe Hydraulic Tools Market, By Type, 2019-2030 (USD Billion)
29. Europe Hydraulic Tools Market, By Distribution Channels, 2019-2030 (USD Billion)
30. Europe Hydraulic Tools Market, By End User, 2019-2030 (USD Billion)
31. Germany Hydraulic Tools Market, By Type, 2019-2030 (USD Billion)
32. Germany Hydraulic Tools Market, By Distribution Channels, 2019-2030 (USD Billion)
33. Germany Hydraulic Tools Market, By End User, 2019-2030 (USD Billion)
34. France Hydraulic Tools Market, By Type 2019-2030 (USD Billion)
35. France Hydraulic Tools Market, By Distribution Channels, 2019-2030 (USD Billion)
36. France Hydraulic Tools Market, By End User, 2019-2030 (USD Billion)
37. U.K. Hydraulic Tools Market, By Type, 2019-2030 (USD Billion)
38. U.K. Hydraulic Tools Market, By Distribution Channels, 2019-2030 (USD Billion)
39. U.K. Hydraulic Tools Market, By End User, 2019-2030 (USD Billion)
40. Italy Hydraulic Tools Market, By Type, 2019-2030 (USD Billion)
41. Italy Hydraulic Tools Market, By Distribution Channels, 2019-2030 (USD Billion)
42. Italy Hydraulic Tools Market, By End User, 2019-2030 (USD Billion)
43. Spain Hydraulic Tools Market, By Type, 2019-2030 (USD Billion)
44. Spain Hydraulic Tools Market, By Distribution Channels, 2019-2030 (USD Billion)
45. Spain Hydraulic Tools Market, By End User, 2019-2030 (USD Billion)
46. Asia Pacific Hydraulic Tools Market, By Type, 2019-2030 (USD Billion)
47. Asia Pacific Hydraulic Tools Market, By Distribution Channels, 2019-2030 (USD Billion)
48. Asia Pacific Hydraulic Tools Market, By End User, 2019-2030 (USD Billion)
49. Japan Hydraulic Tools Market, By Type, 2019-2030 (USD Billion)
50. Japan Hydraulic Tools Market, By Distribution Channels, 2019-2030 (USD Billion)
51. Japan Hydraulic Tools Market, By End User, 2019-2030 (USD Billion)
52. China Hydraulic Tools Market, By Type 2019-2030 (USD Billion)
53. China Hydraulic Tools Market, By Distribution Channels, 2019-2030 (USD Billion)
54. China Hydraulic Tools Market, By End User, 2019-2030 (USD Billion)
55. India Hydraulic Tools Market, By Type 2019-2030 (USD Billion)
56. India Hydraulic Tools Market, By Distribution Channels, 2019-2030 (USD Billion)
57. India Hydraulic Tools Market, By End User, 2019-2030 (USD Billion)
58. South America Hydraulic Tools Market, By Type, 2019-2030 (USD Billion)
59. South America Hydraulic Tools Market, By Distribution Channels, 2019-2030 (USD Billion)
60. South America Hydraulic Tools Market, By End User, 2019-2030 (USD Billion)
61. Brazil Hydraulic Tools Market, By Type 2019-2030 (USD Billion)
62. Brazil Hydraulic Tools Market, By Distribution Channels, 2019-2030 (USD Billion)
63. Brazil Hydraulic Tools Market, By End User, 2019-2030 (USD Billion)
64. Middle East and Africa Hydraulic Tools Market, By Type, 2019-2030 (USD Billion)
65. Middle East and Africa Hydraulic Tools Market, By Distribution Channels, 2019-2030 (USD Billion)
66. Middle East and Africa Hydraulic Tools Market, By End User, 2019-2030 (USD Billion)
67. UAE Hydraulic Tools Market, By Type, 2019-2030 (USD Billion)
68. UAE Hydraulic Tools Market, By Distribution Channels, 2019-2030 (USD Billion)
69. UAE Hydraulic Tools Market, By End User, 2019-2030 (USD Billion)
70. South Africa Hydraulic Tools Market, By Type 2019-2030 (USD Billion)
71. South Africa Hydraulic Tools Market, By Distribution Channels, 2019-2030 (USD Billion)
72. South Africa Hydraulic Tools Market, By End User, 2019-2030 (USD Billion)
List of Figures
1. Global Hydraulic Tools Market Segmentation
2. Hydraulic Tools Market: Research Methodology
3. Market Size Estimation Methodology: Bottom-Up Approach
4. Market Size Estimation Methodology: Top-Down Approach
5. Data Triangulation
6. Porter’s Five Forces Analysis
7. Value Chain Analysis
8. Global Hydraulic Tools Market Attractiveness Analysis by Type
9. Global Hydraulic Tools Market Attractiveness Analysis by Distribution Channels
10. Global Hydraulic Tools Market Attractiveness Analysis by End User
11. Global Hydraulic Tools Market Attractiveness Analysis by Region
12. Global Hydraulic Tools Market: Dynamics
13. Global Hydraulic Tools Market Share by Type (2022 & 2030)
14. Global Hydraulic Tools Market Share by Distribution Channels (2022 & 2030)
15. Global Hydraulic Tools Market Share by End User (2022 & 2030)
16. Global Hydraulic Tools Market Share by Regions (2022 & 2030)
17. Global Hydraulic Tools Market Share by Company (2021)
This study forecasts revenue at global, regional, and country levels from 2019 to 2030. The Brainy Insights has segmented the global hydraulic tools market based on below mentioned segments:
Global Hydraulic Tools Type:
Global Hydraulic Tools Market by Distribution Channels:
Global Hydraulic Tools Market by End User:
Global Hydraulic Tools Market by Region:
Research has its special purpose to undertake marketing efficiently. In this competitive scenario, businesses need information across all industry verticals; the information about customer wants, market demand, competition, industry trends, distribution channels etc. This information needs to be updated regularly because businesses operate in a dynamic environment. Our organization, The Brainy Insights incorporates scientific and systematic research procedures in order to get proper market insights and industry analysis for overall business success. The analysis consists of studying the market from a miniscule level wherein we implement statistical tools which helps us in examining the data with accuracy and precision.
Our research reports feature both; quantitative and qualitative aspects for any market. Qualitative information for any market research process are fundamental because they reveal the customer needs and wants, usage and consumption for any product/service related to a specific industry. This in turn aids the marketers/investors in knowing certain perceptions of the customers. Qualitative research can enlighten about the different product concepts and designs along with unique service offering that in turn, helps define marketing problems and generate opportunities. On the other hand, quantitative research engages with the data collection process through interviews, e-mail interactions, surveys and pilot studies. Quantitative aspects for the market research are useful to validate the hypotheses generated during qualitative research method, explore empirical patterns in the data with the help of statistical tools, and finally make the market estimations.
The Brainy Insights offers comprehensive research and analysis, based on a wide assortment of factual insights gained through interviews with CXOs and global experts and secondary data from reliable sources. Our analysts and industry specialist assume vital roles in building up statistical tools and analysis models, which are used to analyse the data and arrive at accurate insights with exceedingly informative research discoveries. The data provided by our organization have proven precious to a diverse range of companies, facilitating them to address issues such as determining which products/services are the most appealing, whether or not customers use the product in the manner anticipated, the purchasing intentions of the market and many others.
Our research methodology encompasses an idyllic combination of primary and secondary initiatives. Key phases involved in this process are listed below:

The phase involves the gathering and collecting of market data and its related information with the help of different sources & research procedures.

The data procurement stage involves in data gathering and collecting through various data sources.
This stage involves in extensive research. These data sources includes:
Purchased Database: Purchased databases play a crucial role in estimating the market sizes irrespective of the domain. Our purchased database includes:
Primary Research: The Brainy Insights interacts with leading companies and experts of the concerned domain to develop the analyst team’s market understanding and expertise. It improves and substantiates every single data presented in the market reports. Primary research mainly involves in telephonic interviews, E-mail interactions and face-to-face interviews with the raw material providers, manufacturers/producers, distributors, & independent consultants. The interviews that we conduct provides valuable data on market size and industry growth trends prevailing in the market. Our organization also conducts surveys with the various industry experts in order to gain overall insights of the industry/market. For instance, in healthcare industry we conduct surveys with the pharmacists, doctors, surgeons and nurses in order to gain insights and key information of a medical product/device/equipment which the customers are going to usage. Surveys are conducted in the form of questionnaire designed by our own analyst team. Surveys plays an important role in primary research because surveys helps us to identify the key target audiences of the market. Additionally, surveys helps to identify the key target audience engaged with the market. Our survey team conducts the survey by targeting the key audience, thus gaining insights from them. Based on the perspectives of the customers, this information is utilized to formulate market strategies. Moreover, market surveys helps us to understand the current competitive situation of the industry. To be precise, our survey process typically involve with the 360 analysis of the market. This analytical process begins by identifying the prospective customers for a product or service related to the market/industry to obtain data on how a product/service could fit into customers’ lives.

Secondary Research: The secondary data sources includes information published by the on-profit organizations such as World bank, WHO, company fillings, investor presentations, annual reports, national government documents, statistical databases, blogs, articles, white papers and others. From the annual report, we analyse a company’s revenue to understand the key segment and market share of that organization in a particular region. We analyse the company websites and adopt the product mapping technique which is important for deriving the segment revenue. In the product mapping method, we select and categorize the products offered by the companies catering to domain specific market, deduce the product revenue for each of the companies so as to get overall estimation of the market size. We also source data and analyses trends based on information received from supply side and demand side intermediaries in the value chain. The supply side denotes the data gathered from supplier, distributor, wholesaler and the demand side illustrates the data gathered from the end customers for respective market domain.

The supply side for a domain specific market is analysed by:
The demand side for the market is estimated through:
In-house Library: Apart from these third-party sources, we have our in-house library of qualitative and quantitative information. Our in-house database includes market data for various industry and domains. These data are updated on regular basis as per the changing market scenario. Our library includes, historic databases, internal audit reports and archives.
Sometimes there are instances where there is no metadata or raw data available for any domain specific market. For those cases, we use our expertise to forecast and estimate the market size in order to generate comprehensive data sets. Our analyst team adopt a robust research technique in order to produce the estimates:
Data Synthesis: This stage involves the analysis & mapping of all the information obtained from the previous step. It also involves in scrutinizing the data for any discrepancy observed while data gathering related to the market. The data is collected with consideration to the heterogeneity of sources. Robust scientific techniques are in place for synthesizing disparate data sets and provide the essential contextual information that can orient market strategies. The Brainy Insights has extensive experience in data synthesis where the data passes through various stages:


Market Deduction & Formulation: The final stage comprises of assigning data points at appropriate market spaces so as to deduce feasible conclusions. Analyst perspective & subject matter expert based holistic form of market sizing coupled with industry analysis also plays a crucial role in this stage.
This stage involves in finalization of the market size and numbers that we have collected from data integration step. With data interpolation, it is made sure that there is no gap in the market data. Successful trend analysis is done by our analysts using extrapolation techniques, which provide the best possible forecasts for the market.
Data Validation & Market Feedback: Validation is the most important step in the process. Validation & re-validation via an intricately designed process helps us finalize data-points to be used for final calculations.

The Brainy Insights interacts with leading companies and experts of the concerned domain to develop the analyst team’s market understanding and expertise. It improves and substantiates every single data presented in the market reports. The data validation interview and discussion panels are typically composed of the most experienced industry members. The participants include, however, are not limited to:
Moreover, we always validate our data and findings through primary respondents from all the major regions we are working on.


Free Customization
Fortune 500 Clients
Free Yearly Update On Purchase Of Multi/Corporate License
Companies Served Till Date