- +1-315-215-1633
- sales@thebrainyinsights.com

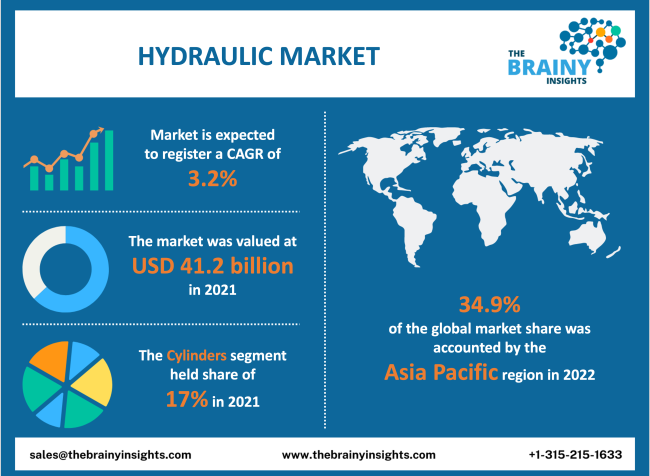
The global hydraulic market was valued at USD 41.2 billion in 2022 and is anticipated to grow at a CAGR of 3.2% from 2022 to 2030. The global hydraulic market is expected to reach USD 54.7 billion by 2030. The main factors propelling the market's growth are the rising demand for material handling equipment, expanding construction activity, rising demand for cutting-edge agricultural equipment, and growing adoption of hydraulic equipment by various industries.
Hydraulic pressure is the force delivered by the controlled circulation of pressured fluid, primarily water-soluble oil or a water-glycol mixture, to a motor that transforms it into a mechanical output capable of working on a load. Hydraulics are frequently used for moving components of automated systems that lift large materials. An airplane's landing gear uses several hydraulic cylinders to position the wheels and support the aircraft's landing. A hydraulic shock absorber, steering, jacks, lifts, breaks, airplanes, and heavy machinery are a few examples of hydraulics. Motors, pumps, valves, filters, accumulators, cylinders, transmissions, and other parts are included in hydraulics. Some notable hydraulics applications include automobile power steering, airplane landing gear, front-end loaders, packaging machinery, the bottle-filling industry, artificial hearts, logic control systems, and robotic material handling. Hydraulic system parts are typically purple. Blue and yellow are the typical hues for hydraulic lines. Using fluids under pressure to generate, control, and transmit power increases the demand for material handling equipment. A fluid motor produces a torque that results in rotary motions, whereas a fluid cylinder produces a force that results in linear motion. The constraints limiting market expansion are high production and maintenance costs and rising worries about oil leaks. Oil leakage in hydraulic cylinders is caused by several variables, including improper connections and fittings and environmental variables like vibrations, shocks, and temperature changes.
Get an overview of this study by requesting a free sample
Demand for various hydraulic systems is continually rising as the modern industry requires faster speeds and more efficiency at higher working pressures and temperatures. Lubrication, energy transmission, and heat removal from machine parts are all tasks that hydraulic oils carry out. The growth of industrial sector will further accelerate the growth rate of the hydraulic market. Additionally, the improved quality of hydraulic fluids will contribute to an increase in market value. The base oils in Groups II and III are also appropriate for lubricant formulations for automatic transmission engines, heavy-duty vehicles, and passenger cars. Their different qualities are anticipated to support the market's expansion.
Hydraulic equipment is being gradually replaced with electromechanical technologies. For instance, when the cost of ancillary hydraulic equipment is considered, an electromechanical system is less expensive than a hydraulic system. Additionally, because there is less chance of a leak, these systems need minimal upkeep and repair. Furthermore, electromechanical devices only require electricity when the load is being moved. In contrast, hydraulic systems must maintain operational fluid pressure levels to retain the position while holding the load, which might slow down how quickly they respond to operator inputs. This constrains the market for hydraulic equipment.
The main issue is the energy consumption of hydraulic equipment, which drives up the overall cost of buying and running industrial facilities and gear. Due to the high pressure in hydraulic equipment, a large amount of energy is used, which raises energy prices. Energy-efficient hydraulic equipment is used to reduce additional costs. Additionally, several recent developments in hydraulic technology have raised its effectiveness. For instance, variable speed pump drives minimize pressure-holding losses during pauses and partial load operation in plastics processing equipment.
It is anticipated that the switch to synthetic hydraulic fluid and the increase in the cost of synthetic and bio-based hydraulic fluid will restrain the growth of the hydraulic oil market over the forecast period.
The global hydraulic market has been segmented based on component, product type, end-user, and region.
The regions analyzed for the market include North America, Europe, South America, Asia Pacific, the Middle East, and Africa. Asia-Pacific emerged as the largest market for the global hydraulic market, with a 34.9% share of the market revenue in 2022.
Due to a large population base in countries like China and India, the hydraulic equipment market in the Asia-Pacific region is growing at the fastest rate. The demand for hydraulic equipment is further increased by the brisk growth of the manufacturing, building, mining, agricultural, and transportation sectors. Manufacturers have established manufacturing facilities in response to the rising demand in the region. Key players have taken different developmental tactics to strengthen their position in the industry. For instance, to fulfill the increasing request for valves, manifolds, and integrated packages, Sun Hydraulics began building on its new plant in Incheon, Korea, in October 2017.
North America is expected to be the fastest-growing region. Over the past few years, North America's food and beverage, pharmaceutical, and FMCG businesses have experienced rapid growth. The demand for hydraulic-operated filling and packing machines has increased due to FMCG product demand, new manufacturing facilities, and the expansion of existing companies. When filling bags and sacks, the food and beverage industry uses conveyors powered by hydraulic motors. In addition, firms like Liebherr, Hitachi, and Caterpillar introduced new hydraulic-operated cranes, dozers, tractors, and tree cutters to meet the growing demand for advanced equipment in the construction, mining, and agricultural industries.
Asia-Pacific Region Hydraulic Market Share in 2022 - 34.9%
www.thebrainyinsights.com
Check the geographical analysis of this market by requesting a free sample
As per The Brainy Insights, the size of the hydraulic market was valued at USD 41.2 billion in 2021 to USD 54.7 billion by 2030.
The global hydraulic market is growing at a CAGR of 3.2% during the forecast period 2022-2030.
North American region emerged as the largest market for hydraulic.
The market's growth will be influenced by the increasing demand for hydraulic in industries.
Replacement of hydraulic equipment could hamper market growth.
The surge in the need for energy-efficient hydraulic equipment will provide huge opportunities to the market.
1. Introduction
1.1. Objectives of the Study
1.2. Market Definition
1.3. Research Scope
1.4. Currency
1.5. Key Target Audience
2. Research Methodology and Assumptions
3. Executive Summary
4. Premium Insights
4.1. Porter’s Five Forces Analysis
4.2. Value Chain Analysis
4.3. Top Investment Pockets
4.3.1. Market Attractiveness Analysis By Component
4.3.2. Market Attractiveness Analysis By Product Type
4.3.3. Market Attractiveness Analysis By End-User
4.3.4. Market Attractiveness Analysis By Region
4.4. Industry Trends
5. Market Dynamics
5.1. Market Evaluation
5.2. Drivers
5.2.1. High requirement of hydraulic oils
5.3. Restraints
5.3.1. Replacement of hydraulic equipment
5.4. Opportunities
5.4.1. The surge in the need for energy-efficient hydraulic equipment
5.5. Challenges
5.5.1. High cost
1. Global Hydraulic Market Analysis and Forecast, By Component
1.1. Segment Overview
1.2. Motor
1.3. Cylinder
1.4. Pumps
1.5. Valves
1.6. Accumulators
1.7. Filters
1.8. Transmission
1.9. Others
2. Global Hydraulic Market Analysis and Forecast, By Product Type
2.1. Segment Overview
2.2. Mobile Hydraulic
2.3. Industrial Hydraulics
3. Global Hydraulic Market Analysis and Forecast, By End-User
3.1. Segment Overview
3.2. Agriculture
3.3. Aerospace
3.4. Automotive
3.5. Construction
3.6. Material Handling
3.7. Marine
3.8. Metal & Machinery Manufacturing
3.9. Mining
3.10. Oil & Gas
3.11. Others
4. Global Hydraulic Market Analysis and Forecast, By Regional Analysis
4.1. Segment Overview
4.2. North America
4.2.1. U.S.
4.2.2. Canada
4.2.3. Mexico
4.3. Europe
4.3.1. Germany
4.3.2. France
4.3.3. U.K.
4.3.4. Italy
4.3.5. Spain
4.4. Asia-Pacific
4.4.1. Japan
4.4.2. China
4.4.3. India
4.5. South America
4.5.1. Brazil
4.6. Middle East and Africa
4.6.1. UAE
4.6.2. South Africa
5. Global Hydraulic Market-Competitive Landscape
5.1. Overview
5.2. Market Share of Key Players in Global Hydraulic Market
5.2.1. Global Company Market Share
5.2.2. North America Company Market Share
5.2.3. Europe Company Market Share
5.2.4. APAC Company Market Share
5.3. Competitive Situations and Trends
5.3.1. Product Launches and Developments
5.3.2. Partnerships, Collaborations, and Agreements
5.3.3. Mergers & Acquisitions
5.3.4. Expansions
6. Company Profiles
6.1. Chevron Corporation.
6.1.1. Business Overview
6.1.2. Company Snapshot
6.1.3. Company Market Share Analysis
6.1.4. Company Product Portfolio
6.1.5. Recent Developments
6.1.6. SWOT Analysis
6.2. S-OIL CORPORATION
6.2.1. Business Overview
6.2.2. Company Snapshot
6.2.3. Company Market Share Analysis
6.2.4. Company Product Portfolio
6.2.5. Recent Developments
6.2.6. SWOT Analysis
6.3. Motiva Enterprises LLC.
6.3.1. Business Overview
6.3.2. Company Snapshot
6.3.3. Company Market Share Analysis
6.3.4. Company Product Portfolio
6.3.5. Recent Developments
6.3.6. SWOT Analysis
6.4. SK innovation Co., Ltd.
6.4.1. Business Overview
6.4.2. Company Snapshot
6.4.3. Company Market Share Analysis
6.4.4. Company Product Portfolio
6.4.5. Recent Developments
6.4.6. SWOT Analysis
6.5. AVISTA OIL Deutschland GmbH
6.5.1. Business Overview
6.5.2. Company Snapshot
6.5.3. Company Market Share Analysis
6.5.4. Company Product Portfolio
6.5.5. Recent Developments
6.5.6. SWOT Analysis
6.6. Calumet Specialty Products Partners, L.P.
6.6.1. Business Overview
6.6.2. Company Snapshot
6.6.3. Company Market Share Analysis
6.6.4. Company Product Portfolio
6.6.5. Recent Developments
6.6.6. SWOT Analysis
6.7. Petroliam Nasional Berhad (PETRONAS)
6.7.1. Business Overview
6.7.2. Company Snapshot
6.7.3. Company Market Share Analysis
6.7.4. Company Product Portfolio
6.7.5. Recent Developments
6.7.6. SWOT Analysis
6.8. Exxon Mobil Corporation
6.8.1. Business Overview
6.8.2. Company Snapshot
6.8.3. Company Market Share Analysis
6.8.4. Company Product Portfolio
6.8.5. Recent Developments
6.8.6. SWOT Analysis
6.9. PetroChina Company Limited
6.9.1. Business Overview
6.9.2. Company Snapshot
6.9.3. Company Market Share Analysis
6.9.4. Company Product Portfolio
6.9.5. Recent Developments
6.9.6. SWOT Analysis
6.10. Saudi Aramco
6.10.1. Business Overview
6.10.2. Company Snapshot
6.10.3. Company Market Share Analysis
6.10.4. Company Product Portfolio
6.10.5. Recent Developments
6.10.6. SWOT Analysis
6.11. Abu Dhabi National Oil Company (ADNOC)
6.11.1. Business Overview
6.11.2. Company Snapshot
6.11.3. Company Market Share Analysis
6.11.4. Company Product Portfolio
6.11.5. Recent Developments
6.11.6. SWOT Analysis
List of Table
1. Global Hydraulic Market, By Component, 2019-2030 (USD Billion)
2. Global Motor, Hydraulic Market, By Region, 2019-2030 (USD Billion)
3. Global Cylinder, Hydraulic Market, By Region, 2019-2030 (USD Billion)
4. Global Pumps, Hydraulic Market, By Region, 2019-2030 (USD Billion)
5. Global Valves, Hydraulic Market, By Region, 2019-2030 (USD Billion)
6. Global Accumulators, Hydraulic Market, By Region, 2019-2030 (USD Billion)
7. Global Filters, Hydraulic Market, By Region, 2019-2030 (USD Billion)
8. Global Transmission, Hydraulic Market, By Region, 2019-2030 (USD Billion)
9. Global Others, Hydraulic Market, By Region, 2019-2030 (USD Billion)
10. Global Hydraulic Market, By Product Type, 2019-2030 (USD Billion)
11. Global Mobile Hydraulic, Hydraulic Market, By Region, 2019-2030 (USD Billion)
12. Global Industrial Hydraulics, Hydraulic Market, By Region, 2019-2030 (USD Billion)
13. Global Hydraulic Market, By End-User, 2019-2030 (USD Billion)
14. Global Agriculture, Hydraulic Market, By Region, 2019-2030 (USD Billion)
15. Global Aerospace, Hydraulic Market, By Region, 2019-2030 (USD Billion)
16. Global Automotive, Hydraulic Market, By Region, 2019-2030 (USD Billion)
17. Global Construction, Hydraulic Market, By Region, 2019-2030 (USD Billion)
18. Global Material Handling, Hydraulic Market, By Region, 2019-2030 (USD Billion)
19. Global Marine, Hydraulic Market, By Region, 2019-2030 (USD Billion)
20. Global Metal & Machinery Manufacturing, Hydraulic Market, By Region, 2019-2030 (USD Billion)
21. Global Mining, Hydraulic Market, By Region, 2019-2030 (USD Billion)
22. Global Oil & Gas, Hydraulic Market, By Region, 2019-2030 (USD Billion)
23. Global Others, Hydraulic Market, By Region, 2019-2030 (USD Billion)
24. North America Hydraulic Market, By Component, 2019-2030 (USD Billion)
25. North America Hydraulic Market, By Product Type, 2019-2030 (USD Billion)
26. North America Hydraulic Market, By End-User, 2019-2030 (USD Billion)
27. U.S. Hydraulic Market, By Component, 2019-2030 (USD Billion)
28. U.S. Hydraulic Market, By Product Type, 2019-2030 (USD Billion)
29. U.S. Hydraulic Market, By End-User, 2019-2030 (USD Billion)
30. Canada Hydraulic Market, By Component, 2019-2030 (USD Billion)
31. Canada Hydraulic Market, By Product Type, 2019-2030 (USD Billion)
32. Canada Hydraulic Market, By End-User, 2019-2030 (USD Billion)
33. Mexico Hydraulic Market, By Component, 2019-2030 (USD Billion)
34. Mexico Hydraulic Market, By Product Type, 2019-2030 (USD Billion)
35. Mexico Hydraulic Market, By End-User, 2019-2030 (USD Billion)
36. Europe Hydraulic Market, By Component, 2019-2030 (USD Billion)
37. Europe Hydraulic Market, By Product Type, 2019-2030 (USD Billion)
38. Europe Hydraulic Market, By End-User, 2019-2030 (USD Billion)
39. Germany Hydraulic Market, By Component, 2019-2030 (USD Billion)
40. Germany Hydraulic Market, By Product Type, 2019-2030 (USD Billion)
41. Germany Hydraulic Market, By End-User, 2019-2030 (USD Billion)
42. France Hydraulic Market, By Component, 2019-2030 (USD Billion)
43. France Hydraulic Market, By Product Type, 2019-2030 (USD Billion)
44. France Hydraulic Market, By End-User, 2019-2030 (USD Billion)
45. U.K. Hydraulic Market, By Component, 2019-2030 (USD Billion)
46. U.K. Hydraulic Market, By Product Type, 2019-2030 (USD Billion)
47. U.K. Hydraulic Market, By End-User, 2019-2030 (USD Billion)
48. Italy Hydraulic Market, By Component, 2019-2030 (USD Billion)
49. Italy Hydraulic Market, By Product Type, 2019-2030 (USD Billion)
50. Italy Hydraulic Market, By End-User, 2019-2030 (USD Billion)
51. Spain Hydraulic Market, By Component, 2019-2030 (USD Billion)
52. Spain Hydraulic Market, By Product Type, 2019-2030 (USD Billion)
53. Spain Hydraulic Market, By End-User, 2019-2030 (USD Billion)
54. Asia Pacific Hydraulic Market, By Component, 2019-2030 (USD Billion)
55. Asia Pacific Hydraulic Market, By Product Type, 2019-2030 (USD Billion)
56. Asia Pacific Hydraulic Market, By End-User, 2019-2030 (USD Billion)
57. Japan Hydraulic Market, By Component, 2019-2030 (USD Billion)
58. Japan Hydraulic Market, By Product Type, 2019-2030 (USD Billion)
59. Japan Hydraulic Market, By End-User, 2019-2030 (USD Billion)
60. China Hydraulic Market, By Component, 2019-2030 (USD Billion)
61. China Hydraulic Market, By Product Type, 2019-2030 (USD Billion)
62. China Hydraulic Market, By End-User, 2019-2030 (USD Billion)
63. India Hydraulic Market, By Component, 2019-2030 (USD Billion)
64. India Hydraulic Market, By Product Type, 2019-2030 (USD Billion)
65. India Hydraulic Market, By End-User, 2019-2030 (USD Billion)
66. South America Hydraulic Market, By Component, 2019-2030 (USD Billion)
67. South America Hydraulic Market, By Product Type, 2019-2030 (USD Billion)
68. South America Hydraulic Market, By End-User, 2019-2030 (USD Billion)
69. Brazil Hydraulic Market, By Component, 2019-2030 (USD Billion)
70. Brazil Hydraulic Market, By Product Type, 2019-2030 (USD Billion)
71. Brazil Hydraulic Market, By End-User, 2019-2030 (USD Billion)
72. Middle East and Africa Hydraulic Market, By Component, 2019-2030 (USD Billion)
73. Middle East and Africa Hydraulic Market, By Product Type, 2019-2030 (USD Billion)
74. Middle East and Africa Hydraulic Market, By End-User, 2019-2030 (USD Billion)
75. UAE Hydraulic Market, By Component, 2019-2030 (USD Billion)
76. UAE Hydraulic Market, By Product Type, 2019-2030 (USD Billion)
77. UAE Hydraulic Market, By End-User, 2019-2030 (USD Billion)
78. South Africa Hydraulic Market, By Component, 2019-2030 (USD Billion)
79. South Africa Hydraulic Market, By Product Type, 2019-2030 (USD Billion)
80. South Africa Hydraulic Market, By End-User, 2019-2030 (USD Billion)
List of Figures
1. Global Hydraulic Market Segmentation
2. Global Hydraulic Market: Research Methodology
3. Market Size Estimation Methodology: Bottom-Up Approach
4. Market Size Estimation Methodology: Top-Down Approach
5. Data Triangulation
6. Porter’s Five Forces Analysis
7. Value Chain Analysis
8. Global Hydraulic Market Attractiveness Analysis By Component
9. Global Hydraulic Market Attractiveness Analysis By Product Type
10. Global Hydraulic Market Attractiveness Analysis By End-User
11. Global Hydraulic Market Attractiveness Analysis By Region
12. Global Hydraulic Market: Dynamics
13. Global Hydraulic Market Share By Component (2022 & 2030)
14. Global Hydraulic Market Share By Product Type (2022 & 2030)
15. Global Hydraulic Market Share By End-User (2022 & 2030)
16. Global Hydraulic Market Share By Regions (2022 & 2030)
17. Global Hydraulic Market Share By Company (2021)
This study forecasts revenue at global, regional, and country levels from 2019 to 2030. Brainy Insights has segmented the global Hydraulic market based on the below-mentioned segments:
Global Hydraulic Market by Component:
Global Hydraulic Market by Product Type:
Global Hydraulic Market by End-User:
Global Hydraulic Market by Region:
Research has its special purpose to undertake marketing efficiently. In this competitive scenario, businesses need information across all industry verticals; the information about customer wants, market demand, competition, industry trends, distribution channels etc. This information needs to be updated regularly because businesses operate in a dynamic environment. Our organization, The Brainy Insights incorporates scientific and systematic research procedures in order to get proper market insights and industry analysis for overall business success. The analysis consists of studying the market from a miniscule level wherein we implement statistical tools which helps us in examining the data with accuracy and precision.
Our research reports feature both; quantitative and qualitative aspects for any market. Qualitative information for any market research process are fundamental because they reveal the customer needs and wants, usage and consumption for any product/service related to a specific industry. This in turn aids the marketers/investors in knowing certain perceptions of the customers. Qualitative research can enlighten about the different product concepts and designs along with unique service offering that in turn, helps define marketing problems and generate opportunities. On the other hand, quantitative research engages with the data collection process through interviews, e-mail interactions, surveys and pilot studies. Quantitative aspects for the market research are useful to validate the hypotheses generated during qualitative research method, explore empirical patterns in the data with the help of statistical tools, and finally make the market estimations.
The Brainy Insights offers comprehensive research and analysis, based on a wide assortment of factual insights gained through interviews with CXOs and global experts and secondary data from reliable sources. Our analysts and industry specialist assume vital roles in building up statistical tools and analysis models, which are used to analyse the data and arrive at accurate insights with exceedingly informative research discoveries. The data provided by our organization have proven precious to a diverse range of companies, facilitating them to address issues such as determining which products/services are the most appealing, whether or not customers use the product in the manner anticipated, the purchasing intentions of the market and many others.
Our research methodology encompasses an idyllic combination of primary and secondary initiatives. Key phases involved in this process are listed below:

The phase involves the gathering and collecting of market data and its related information with the help of different sources & research procedures.

The data procurement stage involves in data gathering and collecting through various data sources.
This stage involves in extensive research. These data sources includes:
Purchased Database: Purchased databases play a crucial role in estimating the market sizes irrespective of the domain. Our purchased database includes:
Primary Research: The Brainy Insights interacts with leading companies and experts of the concerned domain to develop the analyst team’s market understanding and expertise. It improves and substantiates every single data presented in the market reports. Primary research mainly involves in telephonic interviews, E-mail interactions and face-to-face interviews with the raw material providers, manufacturers/producers, distributors, & independent consultants. The interviews that we conduct provides valuable data on market size and industry growth trends prevailing in the market. Our organization also conducts surveys with the various industry experts in order to gain overall insights of the industry/market. For instance, in healthcare industry we conduct surveys with the pharmacists, doctors, surgeons and nurses in order to gain insights and key information of a medical product/device/equipment which the customers are going to usage. Surveys are conducted in the form of questionnaire designed by our own analyst team. Surveys plays an important role in primary research because surveys helps us to identify the key target audiences of the market. Additionally, surveys helps to identify the key target audience engaged with the market. Our survey team conducts the survey by targeting the key audience, thus gaining insights from them. Based on the perspectives of the customers, this information is utilized to formulate market strategies. Moreover, market surveys helps us to understand the current competitive situation of the industry. To be precise, our survey process typically involve with the 360 analysis of the market. This analytical process begins by identifying the prospective customers for a product or service related to the market/industry to obtain data on how a product/service could fit into customers’ lives.

Secondary Research: The secondary data sources includes information published by the on-profit organizations such as World bank, WHO, company fillings, investor presentations, annual reports, national government documents, statistical databases, blogs, articles, white papers and others. From the annual report, we analyse a company’s revenue to understand the key segment and market share of that organization in a particular region. We analyse the company websites and adopt the product mapping technique which is important for deriving the segment revenue. In the product mapping method, we select and categorize the products offered by the companies catering to domain specific market, deduce the product revenue for each of the companies so as to get overall estimation of the market size. We also source data and analyses trends based on information received from supply side and demand side intermediaries in the value chain. The supply side denotes the data gathered from supplier, distributor, wholesaler and the demand side illustrates the data gathered from the end customers for respective market domain.

The supply side for a domain specific market is analysed by:
The demand side for the market is estimated through:
In-house Library: Apart from these third-party sources, we have our in-house library of qualitative and quantitative information. Our in-house database includes market data for various industry and domains. These data are updated on regular basis as per the changing market scenario. Our library includes, historic databases, internal audit reports and archives.
Sometimes there are instances where there is no metadata or raw data available for any domain specific market. For those cases, we use our expertise to forecast and estimate the market size in order to generate comprehensive data sets. Our analyst team adopt a robust research technique in order to produce the estimates:
Data Synthesis: This stage involves the analysis & mapping of all the information obtained from the previous step. It also involves in scrutinizing the data for any discrepancy observed while data gathering related to the market. The data is collected with consideration to the heterogeneity of sources. Robust scientific techniques are in place for synthesizing disparate data sets and provide the essential contextual information that can orient market strategies. The Brainy Insights has extensive experience in data synthesis where the data passes through various stages:


Market Deduction & Formulation: The final stage comprises of assigning data points at appropriate market spaces so as to deduce feasible conclusions. Analyst perspective & subject matter expert based holistic form of market sizing coupled with industry analysis also plays a crucial role in this stage.
This stage involves in finalization of the market size and numbers that we have collected from data integration step. With data interpolation, it is made sure that there is no gap in the market data. Successful trend analysis is done by our analysts using extrapolation techniques, which provide the best possible forecasts for the market.
Data Validation & Market Feedback: Validation is the most important step in the process. Validation & re-validation via an intricately designed process helps us finalize data-points to be used for final calculations.

The Brainy Insights interacts with leading companies and experts of the concerned domain to develop the analyst team’s market understanding and expertise. It improves and substantiates every single data presented in the market reports. The data validation interview and discussion panels are typically composed of the most experienced industry members. The participants include, however, are not limited to:
Moreover, we always validate our data and findings through primary respondents from all the major regions we are working on.


Free Customization
Fortune 500 Clients
Free Yearly Update On Purchase Of Multi/Corporate License
Companies Served Till Date