- +1-315-215-1633
- sales@thebrainyinsights.com

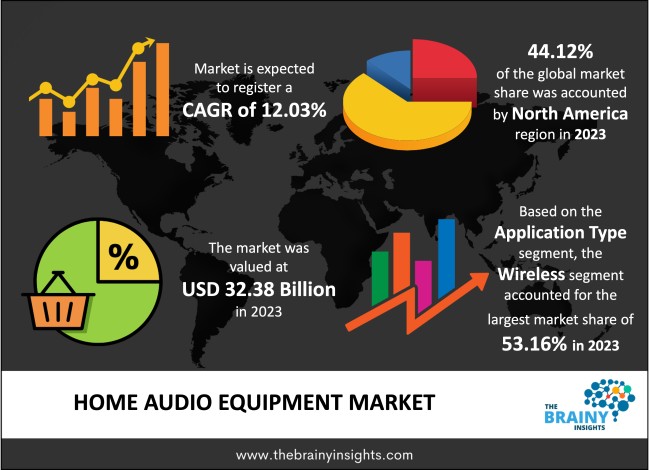
The global home audio equipment market was valued at USD 32.38 billion in 2023, increasing at a CAGR of 12.03% from 2024 to 2033 and anticipated to reach USD 100.83 billion by 2033. Asia Pacific is expected to grow the fastest during the forecast period. Also, the increasing sales of home audio equipment, such as amplifiers, speakers, headphones, receivers, etc., are expected to drive market growth during the forecast period. As demand grows, the market's leading organizations are looking for many strategies to expand their market share.
Audio equipment refers to machines that record, reproduce, or process sound. Audio equipment contains radio receivers, microphones, AV receivers, CD players, amplifiers, tape recorders, mixing consoles, effects units, speakers, and headphones. Audio equipment is widely utilized in many scenarios, such as bars, concerts, meeting rooms and the home where there is a requirement to record, reproduce, and enhance sound volume. Audio equipment means any audio and visual reproduction equipment, including satellite navigational help and traffic alert systems which form part of the Insured Vehicle's original specification and are permanently fitted by the vehicle manufacturer's specification. The main types of audio equipment are amplifiers, loudspeakers, microphones, turntables, and others. An amplifier is an electronic machine that boosts a signal's voltage, power, or current. The audio equipment prices range from low to medium to high and are available in different technologies like wireless and wired.
Get an overview of this study by requesting a free sample
For example, in February 2021, The SRS-RA3000, Sony India's latest premium wireless speakers, was founded. Sony's distinctive spatial sound technology is integrated into smart attributes in the RA3000.
The increasing adoption of audio equipment worldwide: The rising awareness and adoption of home audio equipment due to advertisement and promotions on online channels boost the sales of these products. Further, the over-the-top services utilized to describe movies and TV shows directly delivered to digital viewers without the need for a cable or satellite television subscription are also stimulating market growth. Moreover, the emergence of 5G infrastructure, smartphones, original media content, smart TV, and other technologies are also helping to drive market growth over the forecast period. Additionally, the increasing use of audio equipment for numerous applications in the sports or gaming industry and events, special occasions, and festivals propel the market growth during the forecast period.
The high equipment cost: The inadequate data network infrastructure and latency issues hamper the market growth. Moreover, the lack of skilled workforce in the core electronics sector, rise in raw material costs, complexity in designing and programming complex DSP architecture, a new technology developed by competitors, and currency fluctuations in various industries are restraining the market growth over the forecast period.
The increasing popularity of online distribution channels: The increasing adoption of e-commerce platforms and online distribution channels is one of the opportunity factors for market growth. Further, the expanding adoption of speakers in personal portable music players, smartphones, and computers is helping to stimulate market growth during the forecast period. Moreover, consumers' ever-growing demand for innovative products is pushing manufacturers to develop innovative audio solutions for external and internal applications and sustain in the industry, helping to drive market growth.
The regions analyzed for the market include Europe, South America, Asia Pacific, North America, the Middle East, and Africa. North America emerged as the largest global home audio equipment market, with a 44.12% market revenue share in 2023. North America dominates the home audio equipment market due to the rising discretionary incomes of people. Further, growing urbanization trends and individuals' acceptance of innovative technology developments are also helping to propel the market growth during the forecast period in this region. However, increased demand for high-quality audio and sound systems among users, rising demand for customized home theaters, and the increasing need for wireless streaming propel the market growth in this region.
Additionally, the Asia Pacific is expected to grow the fastest during the forecast period due to the increased government expenditure on pharmaceutical production. Moreover, the expansion of end-user industries in emerging economies, especially India and China, along with the rapid economic growth, are helping to drive market growth in this region. Apart from this, the rising disposable income levels of the people, along with the adoption of innovative technologies such as voice control, wireless, and others, are anticipated to propel the market growth in this region over the forecast period.
North America Region Home Audio Equipment Market Share in 2023 - 44.12%
www.thebrainyinsights.com
Check the geographical analysis of this market by requesting a free sample
The application type segment is divided into wireless and wired. The wireless segment dominated, with a market share of around 53.16% in 2023. This growth is attributed to the ability to deliver bass and other enhanced features at lower volume levels, along with compact size, hassle-free installation, and power efficiency. The soundbar, also known as a speaker bar, is a wireless audio instrument. A soundbar is a single or dual-speaker system that produces high-quality audio. Soundbar is utilized in conjunction with devices such as PCs, laptops, televisions, music players, smartphones, etc. However, the high internet connectivity, coupled with the rapid integration of soundbars with voice assistants, such as Google Assistance and Alexa, are also helping to boost the segment's market growth. Further, by 2033, the wired segment will likely dominate the market due to the ever-increasing number of large-scale events such as global concerts, music festivals, and sports events.
The product type segment is divided into home audio speakers and systems and home theatre in-a-box (HTIB). In 2023, the home audio speakers and systems segment dominated the market with 56.04%. This growth is attributed to easy access to immersive content and programming that elevates audio-visual systems to more powerful performance levels. Further, by 2033, the home theatre in a box (HTIB) segment will likely dominate the market due to its ability to be combined with TVs to provide a better audio experience. Additionally, the rising preferences towards customized products, growing demand for Blu-Ray's high-definition (HD) playback system, increasing demand for customer inclinations for portable devices, and the advancement in digital technology are also propelling the segment's market growth.
The audio components segment is divided into digital & signal processors, microphones, amplifiers, mixers, and others. In 2023, the microphones segment dominated the market with 29.08%. This growth is attributed to the rapid growth in the entertainment industry, low cost, and a wide variety of applications. Additionally, the increased sales of smartphones, tablets and other such devices, along with the flexibility in placement and setup, are also helping to drive the segment's market growth. Further, by 2033, the digital & signal processor segment will likely dominate the market due to the increased customer spending on audio equipment. Besides this, technological advancements, wireless infrastructure improvements, and the high demand for electronics products are also helping to boost the segment's market growth. However, the digital signal processor is widely used in communication, aerospace, military, and other customer & industrial applications.
| Attribute | Description |
|---|---|
| Market Size | Revenue (USD Billion) |
| Market size value in 2023 | USD 32.38 Billion |
| Market size value in 2033 | USD 100.83 Billion |
| CAGR (2024 to 2033) | 12.03% |
| Historical data | 2020-2022 |
| Base Year | 2023 |
| Forecast | 2024-2033 |
| Region | The key regions are North America, South America, Europe, Asia Pacific, and Middle East & Africa. |
| Segments | Key segments are application type, product type, audio components, and regions |
The North America region emerged as the largest market for home audio equipment.
The market's growth will be influenced by the increasing applications in the entertainment industry.
The high equipment cost could hamper the market growth.
The technological advancement will provide huge opportunities to the market.
1. Introduction
1.1. Objectives of the Study
1.2. Market Definition
1.3. Research Scope
1.4. Currency
1.5. Key Target Audience
2. Research Methodology and Assumptions
3. Executive Summary
4. Premium Insights
4.1. Porter’s Five Forces Analysis
4.2. Value Chain Analysis
4.3. Top Investment Pockets
4.3.1. Market Attractiveness Analysis By Application Type
4.3.2. Market Attractiveness Analysis By Product Type
4.3.3. Market Attractiveness Analysis By Audio Components
4.3.4. Market Attractiveness Analysis By Region
4.4. Industry Trends
5. Market Dynamics
5.1. Market Evaluation
5.2. Drivers
5.2.1. The increasing applications in entertainment industry
5.2.2. The increased adoption of home theaters
5.2.3. The growing number of smart homes
5.2.4. The increasing disposable incomes
5.3. Restraints
5.3.1. The high equipment cost
5.3.2. The inadequate data network infrastructure
5.4. Opportunities
5.4.1. The increasing popularity of online distribution channels
5.4.2. The advancement in technology
6. Global Home Audio Equipment Market Analysis and Forecast, By Application Type
6.1. Segment Overview
6.2. Wireless
6.3. Wired
7. Global Home Audio Equipment Market Analysis and Forecast, By Product Type
7.1. Segment Overview
7.2. Home Audio Speakers and Systems
7.3. Home Theatre In-A-Box (HTIB)
8. Global Home Audio Equipment Market Analysis and Forecast, By Audio Components
8.1. Segment Overview
8.2. Digital & Signal Processors
8.3. Microphones
8.4. Amplifiers
8.5. Mixers
8.6. Others
9. Global Home Audio Equipment Market Analysis and Forecast, By Regional Analysis
9.1. Segment Overview
9.2. North America
9.2.1. U.S.
9.2.2. Canada
9.2.3. Mexico
9.3. Europe
9.3.1. Germany
9.3.2. France
9.3.3. U.K.
9.3.4. Italy
9.3.5. Spain
9.4. Asia-Pacific
9.4.1. Japan
9.4.2. China
9.4.3. India
9.5. South America
9.5.1. Brazil
9.6. Middle East and Africa
9.6.1. UAE
9.6.2. South Africa
10. Global Home Audio Equipment Market-Competitive Landscape
10.1. Overview
10.2. Market Share of Key Players in Global Home Audio Equipment Market
10.2.1. Global Company Market Share
10.2.2. North America Company Market Share
10.2.3. Europe Company Market Share
10.2.4. APAC Company Market Share
10.3. Competitive Situations and Trends
10.3.1. Product Launches and Developments
10.3.2. Partnerships, Collaborations, and Agreements
10.3.3. Mergers & Acquisitions
10.3.4. Expansions
11. Company Profiles
11.1. Apple Inc.
11.1.1. Business Overview
11.1.2. Company Snapshot
11.1.3. Company Market Share Analysis
11.1.4. Company Product Portfolio
11.1.5. Recent Developments
11.1.6. SWOT Analysis
11.2. Amazon.com, Inc.
11.2.1. Business Overview
11.2.2. Company Snapshot
11.2.3. Company Market Share Analysis
11.2.4. Company Product Portfolio
11.2.5. Recent Developments
11.2.6. SWOT Analysis
11.3. Bowers & Wilkins Group Ltd.
11.3.1. Business Overview
11.3.2. Company Snapshot
11.3.3. Company Market Share Analysis
11.3.4. Company Product Portfolio
11.3.5. Recent Developments
11.3.6. SWOT Analysis
11.4. Blaupunkt GmbH
11.4.1. Business Overview
11.4.2. Company Snapshot
11.4.3. Company Market Share Analysis
11.4.4. Company Product Portfolio
11.4.5. Recent Developments
11.4.6. SWOT Analysis
11.5. Creative Technology Ltd.
11.5.1. Business Overview
11.5.2. Company Snapshot
11.5.3. Company Market Share Analysis
11.5.4. Company Product Portfolio
11.5.5. Recent Developments
11.5.6. SWOT Analysis
11.6. Bose Corporation
11.6.1. Business Overview
11.6.2. Company Snapshot
11.6.3. Company Market Share Analysis
11.6.4. Company Product Portfolio
11.6.5. Recent Developments
11.6.6. SWOT Analysis
11.7. Edifier Technology Co., Ltd.
11.7.1. Business Overview
11.7.2. Company Snapshot
11.7.3. Company Market Share Analysis
11.7.4. Company Product Portfolio
11.7.5. Recent Developments
11.7.6. SWOT Analysis
11.8. Sonos, Inc.
11.8.1. Business Overview
11.8.2. Company Snapshot
11.8.3. Company Market Share Analysis
11.8.4. Company Product Portfolio
11.8.5. Recent Developments
11.8.6. SWOT Analysis
11.9. Google LLC
11.9.1. Business Overview
11.9.2. Company Snapshot
11.9.3. Company Market Share Analysis
11.9.4. Company Product Portfolio
11.9.5. Recent Developments
11.9.6. SWOT Analysis
11.10. JVCKenwood Corporation
11.10.1. Business Overview
11.10.2. Company Snapshot
11.10.3. Company Market Share Analysis
11.10.4. Company Product Portfolio
11.10.5. Recent Developments
11.10.6. SWOT Analysis
11.11. Koninklijke Philips N.V.
11.11.1. Business Overview
11.11.2. Company Snapshot
11.11.3. Company Market Share Analysis
11.11.4. Company Product Portfolio
11.11.5. Recent Developments
11.11.6. SWOT Analysis
11.12. Sennheiser Electronic GmbH & Co. KG.
11.12.1. Business Overview
11.12.2. Company Snapshot
11.12.3. Company Market Share Analysis
11.12.4. Company Product Portfolio
11.12.5. Recent Developments
11.12.6. SWOT Analysis
11.13. Panasonic Corporation
11.13.1. Business Overview
11.13.2. Company Snapshot
11.13.3. Company Market Share Analysis
11.13.4. Company Product Portfolio
11.13.5. Recent Developments
11.13.6. SWOT Analysis
11.14. LG Corporation
11.14.1. Business Overview
11.14.2. Company Snapshot
11.14.3. Company Market Share Analysis
11.14.4. Company Product Portfolio
11.14.5. Recent Developments
11.14.6. SWOT Analysis
11.15. Pioneer Corporation
11.15.1. Business Overview
11.15.2. Company Snapshot
11.15.3. Company Market Share Analysis
11.15.4. Company Product Portfolio
11.15.5. Recent Developments
11.15.6. SWOT Analysis
11.16. Plantronics Inc.
11.16.1. Business Overview
11.16.2. Company Snapshot
11.16.3. Company Market Share Analysis
11.16.4. Company Product Portfolio
11.16.5. Recent Developments
11.16.6. SWOT Analysis
11.17. Samsung Electronics Co. Ltd.
11.17.1. Business Overview
11.17.2. Company Snapshot
11.17.3. Company Market Share Analysis
11.17.4. Company Product Portfolio
11.17.5. Recent Developments
11.17.6. SWOT Analysis
11.18. Polk Audio
11.18.1. Business Overview
11.18.2. Company Snapshot
11.18.3. Company Market Share Analysis
11.18.4. Company Product Portfolio
11.18.5. Recent Developments
11.18.6. SWOT Analysis
11.19. Sony Corporation
11.19.1. Business Overview
11.19.2. Company Snapshot
11.19.3. Company Market Share Analysis
11.19.4. Company Product Portfolio
11.19.5. Recent Developments
11.19.6. SWOT Analysis
11.20. Yamaha Corporation
11.20.1. Business Overview
11.20.2. Company Snapshot
11.20.3. Company Market Share Analysis
11.20.4. Company Product Portfolio
11.20.5. Recent Developments
11.20.6. SWOT Analysis
11.21. VIZIO Inc.
11.21.1. Business Overview
11.21.2. Company Snapshot
11.21.3. Company Market Share Analysis
11.21.4. Company Product Portfolio
11.21.5. Recent Developments
11.21.6. SWOT Analysis
11.22. Voxx International Corporation
11.22.1. Business Overview
11.22.2. Company Snapshot
11.22.3. Company Market Share Analysis
11.22.4. Company Product Portfolio
11.22.5. Recent Developments
11.22.6. SWOT Analysis
List of Table
1. Global Home Audio Equipment Market, By Application Type, 2020-2033 (USD Billion)
2. Global Wireless, Home Audio Equipment Market, By Region, 2020-2033 (USD Billion)
3. Global Wired, Home Audio Equipment Market, By Region, 2020-2033 (USD Billion)
4. Global Home Audio Equipment Market, By Product Type, 2020-2033 (USD Billion)
5. Global Home Audio Speakers And Systems, Home Audio Equipment Market, By Region, 2020-2033 (USD Billion)
6. Global Home Theatre In-A-Box (HTIB), Home Audio Equipment Market, By Region, 2020-2033 (USD Billion)
7. Global Home Audio Equipment Market, By Audio Components, 2020-2033 (USD Billion)
8. Global Digital & Signal Processors, Home Audio Equipment Market, By Region, 2020-2033 (USD Billion)
9. Global Microphones, Home Audio Equipment Market, By Region, 2020-2033 (USD Billion)
10. Global Amplifiers, Home Audio Equipment Market, By Region, 2020-2033 (USD Billion)
11. Global Mixers, Home Audio Equipment Market, By Region, 2020-2033 (USD Billion)
12. Global Others, Home Audio Equipment Market, By Region, 2020-2033 (USD Billion)
13. North America Home Audio Equipment Market, By Application Type, 2020-2033 (USD Billion)
14. North America Home Audio Equipment Market, By Product Type, 2020-2033 (USD Billion)
15. North America Home Audio Equipment Market, By Audio Components, 2020-2033 (USD Billion)
16. U.S. Home Audio Equipment Market, By Application Type, 2020-2033 (USD Billion)
17. U.S. Home Audio Equipment Market, By Product Type, 2020-2033 (USD Billion)
18. U.S. Home Audio Equipment Market, By Audio Components, 2020-2033 (USD Billion)
19. Canada Home Audio Equipment Market, By Application Type, 2020-2033 (USD Billion)
20. Canada Home Audio Equipment Market, By Product Type, 2020-2033 (USD Billion)
21. Canada Home Audio Equipment Market, By Audio Components, 2020-2033 (USD Billion)
22. Mexico Home Audio Equipment Market, By Application Type, 2020-2033 (USD Billion)
23. Mexico Home Audio Equipment Market, By Product Type, 2020-2033 (USD Billion)
24. Mexico Home Audio Equipment Market, By Audio Components, 2020-2033 (USD Billion)
25. Europe Home Audio Equipment Market, By Application Type, 2020-2033 (USD Billion)
26. Europe Home Audio Equipment Market, By Product Type, 2020-2033 (USD Billion)
27. Europe Home Audio Equipment Market, By Audio Components, 2020-2033 (USD Billion)
28. Germany Home Audio Equipment Market, By Application Type, 2020-2033 (USD Billion)
29. Germany Home Audio Equipment Market, By Product Type, 2020-2033 (USD Billion)
30. Germany Home Audio Equipment Market, By Audio Components, 2020-2033 (USD Billion)
31. France Home Audio Equipment Market, By Application Type, 2020-2033 (USD Billion)
32. France Home Audio Equipment Market, By Product Type, 2020-2033 (USD Billion)
33. France Home Audio Equipment Market, By Audio Components, 2020-2033 (USD Billion)
34. U.K. Home Audio Equipment Market, By Application Type, 2020-2033 (USD Billion)
35. U.K. Home Audio Equipment Market, By Product Type, 2020-2033 (USD Billion)
36. U.K. Home Audio Equipment Market, By Audio Components, 2020-2033 (USD Billion)
37. Italy Home Audio Equipment Market, By Application Type, 2020-2033 (USD Billion)
38. Italy Home Audio Equipment Market, By Product Type, 2020-2033 (USD Billion)
39. Italy Home Audio Equipment Market, By Audio Components, 2020-2033 (USD Billion)
40. Spain Home Audio Equipment Market, By Application Type, 2020-2033 (USD Billion)
41. Spain Home Audio Equipment Market, By Product Type, 2020-2033 (USD Billion)
42. Spain Home Audio Equipment Market, By Audio Components, 2020-2033 (USD Billion)
43. Asia Pacific Home Audio Equipment Market, By Application Type, 2020-2033 (USD Billion)
44. Asia Pacific Home Audio Equipment Market, By Product Type, 2020-2033 (USD Billion)
45. Asia Pacific Home Audio Equipment Market, By Audio Components, 2020-2033 (USD Billion)
46. Japan Home Audio Equipment Market, By Application Type, 2020-2033 (USD Billion)
47. Japan Home Audio Equipment Market, By Product Type, 2020-2033 (USD Billion)
48. Japan Home Audio Equipment Market, By Audio Components, 2020-2033 (USD Billion)
49. China Home Audio Equipment Market, By Application Type, 2020-2033 (USD Billion)
50. China Home Audio Equipment Market, By Product Type, 2020-2033 (USD Billion)
51. China Home Audio Equipment Market, By Audio Components, 2020-2033 (USD Billion)
52. India Home Audio Equipment Market, By Application Type, 2020-2033 (USD Billion)
53. India Home Audio Equipment Market, By Product Type, 2020-2033 (USD Billion)
54. India Home Audio Equipment Market, By Audio Components, 2020-2033 (USD Billion)
55. South America Home Audio Equipment Market, By Application Type, 2020-2033 (USD Billion)
56. South America Home Audio Equipment Market, By Product Type, 2020-2033 (USD Billion)
57. South America Home Audio Equipment Market, By Audio Components, 2020-2033 (USD Billion)
58. Brazil Home Audio Equipment Market, By Application Type, 2020-2033 (USD Billion)
59. Brazil Home Audio Equipment Market, By Product Type, 2020-2033 (USD Billion)
60. Brazil Home Audio Equipment Market, By Audio Components, 2020-2033 (USD Billion)
61. Middle East and Africa Home Audio Equipment Market, By Application Type, 2020-2033 (USD Billion)
62. Middle East and Africa Home Audio Equipment Market, By Product Type, 2020-2033 (USD Billion)
63. Middle East and Africa Home Audio Equipment Market, By Audio Components, 2020-2033 (USD Billion)
64. UAE Home Audio Equipment Market, By Application Type, 2020-2033 (USD Billion)
65. UAE Home Audio Equipment Market, By Product Type, 2020-2033 (USD Billion)
66. UAE Home Audio Equipment Market, By Audio Components, 2020-2033 (USD Billion)
67. South Africa Home Audio Equipment Market, By Application Type, 2020-2033 (USD Billion)
68. South Africa Home Audio Equipment Market, By Product Type, 2020-2033 (USD Billion)
69. South Africa Home Audio Equipment Market, By Audio Components, 2020-2033 (USD Billion)
List of Figures
1. Global Home Audio Equipment Market Segmentation
2. Global Home Audio Equipment Market: Research Methodology
3. Market Size Estimation Methodology: Bottom-Up Approach
4. Market Size Estimation Methodology: Top- Approach
5. Data Triangulation
6. Porter’s Five Forces Analysis
7. Value Chain Analysis
8. Global Home Audio Equipment Market Attractiveness Analysis By Application Type
9. Global Home Audio Equipment Market Attractiveness Analysis By Product Type
10. Global Home Audio Equipment Market Attractiveness Analysis By Audio Components
11. Global Home Audio Equipment Market Attractiveness Analysis By Region
12. Global Home Audio Equipment Market: Dynamics
13. Global Home Audio Equipment Market Share By Application Type (2023 & 2033)
14. Global Home Audio Equipment Market Share By Product Type (2023 & 2033)
15. Global Home Audio Equipment Market Share By Audio Components (2023 & 2033)
16. Global Home Audio Equipment Market Share By Regions (2023 & 2033)
17. Global Home Audio Equipment Market Share By Company (2023)
This study forecasts revenue at global, regional, and country levels from 2020 to 2033. The Brainy Insights has segmented the global home audio equipment based on below mentioned segments:
Global Home Audio Equipment Market by Application Type:
Global Home Audio Equipment Market by Product Type:
Global Home Audio Equipment Market by Audio Components:
Global Home Audio Equipment by Region:
Research has its special purpose to undertake marketing efficiently. In this competitive scenario, businesses need information across all industry verticals; the information about customer wants, market demand, competition, industry trends, distribution channels etc. This information needs to be updated regularly because businesses operate in a dynamic environment. Our organization, The Brainy Insights incorporates scientific and systematic research procedures in order to get proper market insights and industry analysis for overall business success. The analysis consists of studying the market from a miniscule level wherein we implement statistical tools which helps us in examining the data with accuracy and precision.
Our research reports feature both; quantitative and qualitative aspects for any market. Qualitative information for any market research process are fundamental because they reveal the customer needs and wants, usage and consumption for any product/service related to a specific industry. This in turn aids the marketers/investors in knowing certain perceptions of the customers. Qualitative research can enlighten about the different product concepts and designs along with unique service offering that in turn, helps define marketing problems and generate opportunities. On the other hand, quantitative research engages with the data collection process through interviews, e-mail interactions, surveys and pilot studies. Quantitative aspects for the market research are useful to validate the hypotheses generated during qualitative research method, explore empirical patterns in the data with the help of statistical tools, and finally make the market estimations.
The Brainy Insights offers comprehensive research and analysis, based on a wide assortment of factual insights gained through interviews with CXOs and global experts and secondary data from reliable sources. Our analysts and industry specialist assume vital roles in building up statistical tools and analysis models, which are used to analyse the data and arrive at accurate insights with exceedingly informative research discoveries. The data provided by our organization have proven precious to a diverse range of companies, facilitating them to address issues such as determining which products/services are the most appealing, whether or not customers use the product in the manner anticipated, the purchasing intentions of the market and many others.
Our research methodology encompasses an idyllic combination of primary and secondary initiatives. Key phases involved in this process are listed below:

The phase involves the gathering and collecting of market data and its related information with the help of different sources & research procedures.

The data procurement stage involves in data gathering and collecting through various data sources.
This stage involves in extensive research. These data sources includes:
Purchased Database: Purchased databases play a crucial role in estimating the market sizes irrespective of the domain. Our purchased database includes:
Primary Research: The Brainy Insights interacts with leading companies and experts of the concerned domain to develop the analyst team’s market understanding and expertise. It improves and substantiates every single data presented in the market reports. Primary research mainly involves in telephonic interviews, E-mail interactions and face-to-face interviews with the raw material providers, manufacturers/producers, distributors, & independent consultants. The interviews that we conduct provides valuable data on market size and industry growth trends prevailing in the market. Our organization also conducts surveys with the various industry experts in order to gain overall insights of the industry/market. For instance, in healthcare industry we conduct surveys with the pharmacists, doctors, surgeons and nurses in order to gain insights and key information of a medical product/device/equipment which the customers are going to usage. Surveys are conducted in the form of questionnaire designed by our own analyst team. Surveys plays an important role in primary research because surveys helps us to identify the key target audiences of the market. Additionally, surveys helps to identify the key target audience engaged with the market. Our survey team conducts the survey by targeting the key audience, thus gaining insights from them. Based on the perspectives of the customers, this information is utilized to formulate market strategies. Moreover, market surveys helps us to understand the current competitive situation of the industry. To be precise, our survey process typically involve with the 360 analysis of the market. This analytical process begins by identifying the prospective customers for a product or service related to the market/industry to obtain data on how a product/service could fit into customers’ lives.

Secondary Research: The secondary data sources includes information published by the on-profit organizations such as World bank, WHO, company fillings, investor presentations, annual reports, national government documents, statistical databases, blogs, articles, white papers and others. From the annual report, we analyse a company’s revenue to understand the key segment and market share of that organization in a particular region. We analyse the company websites and adopt the product mapping technique which is important for deriving the segment revenue. In the product mapping method, we select and categorize the products offered by the companies catering to domain specific market, deduce the product revenue for each of the companies so as to get overall estimation of the market size. We also source data and analyses trends based on information received from supply side and demand side intermediaries in the value chain. The supply side denotes the data gathered from supplier, distributor, wholesaler and the demand side illustrates the data gathered from the end customers for respective market domain.

The supply side for a domain specific market is analysed by:
The demand side for the market is estimated through:
In-house Library: Apart from these third-party sources, we have our in-house library of qualitative and quantitative information. Our in-house database includes market data for various industry and domains. These data are updated on regular basis as per the changing market scenario. Our library includes, historic databases, internal audit reports and archives.
Sometimes there are instances where there is no metadata or raw data available for any domain specific market. For those cases, we use our expertise to forecast and estimate the market size in order to generate comprehensive data sets. Our analyst team adopt a robust research technique in order to produce the estimates:
Data Synthesis: This stage involves the analysis & mapping of all the information obtained from the previous step. It also involves in scrutinizing the data for any discrepancy observed while data gathering related to the market. The data is collected with consideration to the heterogeneity of sources. Robust scientific techniques are in place for synthesizing disparate data sets and provide the essential contextual information that can orient market strategies. The Brainy Insights has extensive experience in data synthesis where the data passes through various stages:


Market Deduction & Formulation: The final stage comprises of assigning data points at appropriate market spaces so as to deduce feasible conclusions. Analyst perspective & subject matter expert based holistic form of market sizing coupled with industry analysis also plays a crucial role in this stage.
This stage involves in finalization of the market size and numbers that we have collected from data integration step. With data interpolation, it is made sure that there is no gap in the market data. Successful trend analysis is done by our analysts using extrapolation techniques, which provide the best possible forecasts for the market.
Data Validation & Market Feedback: Validation is the most important step in the process. Validation & re-validation via an intricately designed process helps us finalize data-points to be used for final calculations.

The Brainy Insights interacts with leading companies and experts of the concerned domain to develop the analyst team’s market understanding and expertise. It improves and substantiates every single data presented in the market reports. The data validation interview and discussion panels are typically composed of the most experienced industry members. The participants include, however, are not limited to:
Moreover, we always validate our data and findings through primary respondents from all the major regions we are working on.


Free Customization
Fortune 500 Clients
Free Yearly Update On Purchase Of Multi/Corporate License
Companies Served Till Date