- +1-315-215-1633
- sales@thebrainyinsights.com

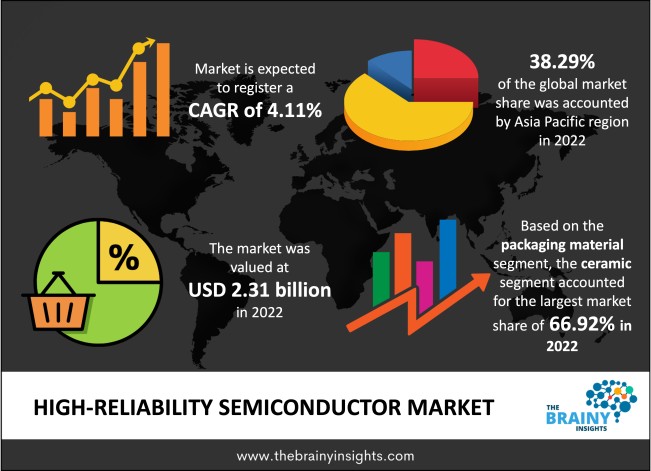
The global high-reliability semiconductor market is expected to grow from USD 2.31 billion in 2022 to USD 3.45 billion by 2032, at a CAGR of 4.11% during the forecast period 2023-2032.Asia-Pacific dominated the market in 2022.
High-reliability semiconductor is used in components used for defense and space sectors.High-reliability semiconductorsare manufactured to withstand extreme temperatures for a more extended period. Several high-reliability semiconductors include RF microwaves, amplifiers, data converters, etc. Adopting tiny, highly efficient, and robust devices that use standard components and high frequencies is one of the main drivers for high-reliability semiconductors. Electronic warfare systems must respond swiftly to constantly changing threats, necessitating the speedy deployment of standardized solutions. A wide variety of aerospace, defense and MEMS applications, including radar, Lidar, RF and microwave power modules, IR sensors, aircraft surveillance, IR thermal cameras, aerial cameras, and microbolometers, require high-reliability semiconductors. High-reliability semiconductor is being used in these devices more and more frequently.
Get an overview of this study by requesting a free sample
Increasing use of high-reliability semiconductors in different applications: As a material for a variety of high- and protection-level components, high-reliability semiconductors have gained prominence, necessitating a greater understanding of the effects of various machining techniques. High-reliability semiconductorhas been used in high-temperature structural industries such as defense and aviation. High-reliability semiconductor is a revolutionary emerging technology for enhancing the toughness and endurance of components in highly high-temperature applications, such as engine hot area elements. The development of stiffer, more challenging, smaller, lighter materials that can endure higher operating temperatures using high-reliability semiconductors raises the possibility of weight reduction of the components. The adoption of new infrastructure technology has necessitated the use of reliable and safe components used in automotive and aerospace bodies.
The fluctuating cost of raw materials–The fluctuating cost of the high-reliability semiconductor hinders the market growth. The R&D and manufacturing costs associated with developing such high-reliability semiconductors contribute to the overall costs. Also, raw material prices, manufacturing and testing costs, and other miscellaneous costs soar the overall price of installing these components in the automotive and aerospace body. Thus, the high cost affects the market growth of high-reliability semiconductors.
Increasing research and development in the automotive sector: Following the expanding openness, the income of the people, the arrival of new and existing models, easy availability of finance at a relatively low rate of interest, and price concessions made by dealers and manufacturers, the global automotive industry has grown dramatically since 1991. Although various factors influence automotive demand, passenger vehicle sales nearly doubled in the last decade, albeit from a low base, due to pent-up demand and the opening up more markets. Vehicle regulations are the specifications that vehicles must meet to be authorized for sale or use in a specific nation or area. They are typically regulated by a government agency and required by law. The rules necessitate high-reliability semiconductors in most new edge vehicles to improve their efficiency and speed.
Complexities in instalment –Many high-reliability semiconductors are complex to use. There are various complexities involved with high-reliability semiconductors, as they should be compatible with the components. It requires a skilled workforce and developed infrastructure. In addition, many people in developing countries are unaware of the advantages of high-reliability semiconductors in aerospace and space applications. This aspect limits the market's expansion in these areas even further.
The regions analyzed for the market include North America, Europe, South America, Asia Pacific, the Middle East, and Africa. Asia-Pacific emerged as the most significant global high-reliability semiconductor market, with a revenue share of 38.29% in 2022. The region has a high market growth rate due to the increasing growth of aerospace and defense applications. The Asia Pacific market will be driven by investment in the automotive breakthrough technology to support the high-reliability semiconductor market. The consumers are increasingly investing in innovative and miniatured devices. The North American region is anticipated to grow lucratively during the forecast period. The market is witnessing a lucrative growth rate due to the increasing use of high-reliability semiconductors inthe defense sector in countries like the USA and Canada.
Asia Pacific region high-reliability semiconductor Market Share in 2022 - 38.29%
www.thebrainyinsights.com
Check the geographical analysis of this market by requesting a free sample
The typesegment is divided intoanalog, discrete, and mixed. The analog segment dominated the market with a revenue share of 41.29% in 2022. Analog-based semiconductors are used in numerous components in aerospace and defense applications. Analog-type semiconductors are reliable and compatible with most hardware devices.
The packaging material segment includes ceramic and plastic. The ceramic segment dominated the market with a revenue share of 66.92% in 2022. Ceramics are mainly used in manufacturing high-reliability semiconductors due to their favourable attributes. Ceramics provide the strength which is required in aerospace components.
The technology segment includes through-hole technology and surface mount technology. The surface mount technology segment dominated the market with a revenue share of 69.22% in 2022. Surface mount technology allows for the development of complex boards and helps develop specialized components. The demand for different components requires the use of highly reliable technology.
The application segment includes space, automotive, defense, and aerospace. The aerospace segment dominated the market with a revenue share of 43.10% in 2022. The aerospace industryhas witnessed drastic trends over the years. The demand for a high-reliability semiconductor has increased in aerospace applications due to the growing focus on safety improvement.
| Attribute | Description |
|---|---|
| Market Size | Revenue (USD Billion) |
| Market size value in 2022 | USD 2.31 Billion |
| Market size value in 2032 | USD 3.45 Billion |
| CAGR (2023 to 2032) | 4.11% |
| Historical data | 2019-2021 |
| Base Year | 2022 |
| Forecast | 2023-2032 |
| Regional Segments | The regions examined for the market are Europe, Asia Pacific, North America, South America, and Middle East & Africa. |
| Segments | The research segment is based on type, packaging material, technology, and application. |
As per The Brainy Insights, the size of the high reliability semiconductor market was valued 2.31 billion in 2022 to USD 3.45 billion by 2032.
Global high reliability semiconductor market is growing at a CAGR of 4.11% during the forecast period 2023-2032.
Asia Pacific region emerged as the largest market for the high reliability semiconductor.
The market's growth will be influenced by the growing use of high reliability semiconductor in aerospace and defense applications.
The fluctuating cost of raw materials could hamper the market growth.
The increasing investment in defense applications is providing huge opportunities to the market.
1. Introduction
1.1. Objectives of the Study
1.2. Market Definition
1.3. Research Scope
1.4. Currency
1.5. Key Target Audience
2. Research Methodology and Assumptions
3. Executive Summary
4. Premium Insights
4.1. Porter’s Five Forces Analysis
4.2. Value Chain Analysis
4.3. Top Investment Pockets
4.3.1. Market Attractiveness Analysis by Type
4.3.2. Market Attractiveness Analysis by Packaging Material
4.3.3. Market Attractiveness Analysis by Technology
4.3.4. Market Attractiveness Analysis by Application
4.3.5. Market Attractiveness Analysis by Region
4.4. Industry Trends
5. Market Dynamics
5.1. Market Evaluation
5.2. Drivers
5.2.1. Increasing use of high reliability semiconductor across verticals
5.3. Restraints
5.3.1. Fluctuating cost of raw materials
5.4. Opportunities
5.4.1. Increasing investment in defense applications
5.5. Challenges
5.5.1. Complexities in instalment
6. Global High Reliability Semiconductor Market Analysis and Forecast, By Type
6.1. Segment Overview
6.2. Analog
6.3. Discrete
6.4. Mixed
7. Global High Reliability Semiconductor Market Analysis and Forecast, By Packaging Material
7.1. Segment Overview
7.2. Ceramic
7.3. Plastic
8. Global High Reliability Semiconductor Market Analysis and Forecast, By Technology
8.1. Segment Overview
8.2. Through-Hole Technology
8.3. Surface Mount Technology
9. Global High Reliability Semiconductor Market Analysis and Forecast, By Application
9.1. Segment Overview
9.2. Space
9.3. Automotive
9.4. Defense
9.5. Aerospace
10. Global High Reliability Semiconductor Market Analysis and Forecast, By Regional Analysis
10.1. Segment Overview
10.2. North America
10.2.1. U.S.
10.2.2. Canada
10.2.3. Mexico
10.3. Europe
10.3.1. Germany
10.3.2. France
10.3.3. U.K.
10.3.4. Italy
10.3.5. Spain
10.4. Asia-Pacific
10.4.1. Japan
10.4.2. China
10.4.3. India
10.5. South America
10.5.1. Brazil
10.6. Middle East and Africa
10.6.1. UAE
10.6.2. South Africa
11. Global High Reliability Semiconductor Market-Competitive Landscape
11.1. Overview
11.2. Market Share of Key Players in the High Reliability Semiconductor Market
11.2.1. Global Company Market Share
11.2.2. North America Company Market Share
11.2.3. Europe Company Market Share
11.2.4. APAC Company Market Share
11.3. Competitive Situations and Trends
11.3.1. Product Launches and Developments
11.3.2. Partnerships, Collaborations, and Agreements
11.3.3. Mergers & Acquisitions
11.3.4. Expansions
12. Company Profiles
12.1. Digitron Semiconductors
12.1.1. Business Overview
12.1.2. Company Snapshot
12.1.3. Company Market Share Analysis
12.1.4. Company Product Portfolio
12.1.5. Recent Developments
12.1.6. SWOT Analysis
12.2. Infineon Technologies AG
12.2.1. Business Overview
12.2.2. Company Snapshot
12.2.3. Company Market Share Analysis
12.2.4. Company Product Portfolio
12.2.5. Recent Developments
12.2.6. SWOT Analysis
12.3. Microsemi Corporation
12.3.1. Business Overview
12.3.2. Company Snapshot
12.3.3. Company Market Share Analysis
12.3.4. Company Product Portfolio
12.3.5. Recent Developments
12.3.6. SWOT Analysis
12.4. Semtech Corporation
12.4.1. Business Overview
12.4.2. Company Snapshot
12.4.3. Company Market Share Analysis
12.4.4. Company Product Portfolio
12.4.5. Recent Developments
12.4.6. SWOT Analysis
12.5. SEMICOA
12.5.1. Business Overview
12.5.2. Company Snapshot
12.5.3. Company Market Share Analysis
12.5.4. Company Product Portfolio
12.5.5. Recent Developments
12.5.6. SWOT Analysis
12.6. KCB Solutions LLC
12.6.1. Business Overview
12.6.2. Company Snapshot
12.6.3. Company Market Share Analysis
12.6.4. Company Product Portfolio
12.6.5. Recent Developments
12.6.6. SWOT Analysis
12.7. Teledyne Technologies Incorporated
12.7.1. Business Overview
12.7.2. Company Snapshot
12.7.3. Company Market Share Analysis
12.7.4. Company Product Portfolio
12.7.5. Recent Developments
12.7.6. SWOT Analysis
12.8. Texas Instruments Inc.
1.1.1. Business Overview
1.1.2. Company Snapshot
1.1.3. Company Market Share Analysis
1.1.4. Company Product Portfolio
1.1.5. Recent Developments
1.1.6. SWOT Analysis
12.9. Testime Technology Ltd.
12.9.1. Business Overview
12.9.2. Company Snapshot
12.9.3. Company Market Share Analysis
12.9.4. Company Product Portfolio
12.9.5. Recent Developments
12.9.6. SWOT Analysis
12.10. Skyworks Solutions Inc.
12.10.1. Business Overview
12.10.2. Company Snapshot
12.10.3. Company Market Share Analysis
12.10.4. Company Product Portfolio
12.10.5. Recent Developments
12.10.6. SWOT Analysis
12.11. Vishay Intertechnology, Inc
12.11.1. Business Overview
12.11.2. Company Snapshot
12.11.3. Company Market Share Analysis
12.11.4. Company Product Portfolio
12.11.5. Recent Developments
12.11.6. SWOT Analysis
List of Table
1. Global High Reliability Semiconductor Market, By Type, 2019-2032 (USD Billion)
2. Global Analog, High Reliability Semiconductor Market, By Region, 2019-2032 (USD Billion)
3. Global Discrete, High Reliability Semiconductor Market, By Region, 2019-2032 (USD Billion)
4. Global Mixed, High Reliability Semiconductor Market, By Region, 2019-2032 (USD Billion)
5. Global High Reliability Semiconductor Market, By Packaging Material, 2019-2032 (USD Billion)
6. Global Ceramic, High Reliability Semiconductor Market, By Region, 2019-2032 (USD Billion)
7. Global Plastic, High Reliability Semiconductor Market, By Region, 2019-2032 (USD Billion)
8. Global High Reliability Semiconductor Market, By Technology, 2019-2032 (USD Billion)
9. Global Through-Hole Technology, High Reliability Semiconductor Market, By Region, 2019-2032 (USD Billion)
10. Global Surface Mount Technology, High Reliability Semiconductor Market, By Region, 2019-2032 (USD Billion)
11. Global High Reliability Semiconductor Market, By Application, 2019-2032 (USD Billion)
12. Global Space, High Reliability Semiconductor Market, By Region, 2019-2032 (USD Billion)
13. Global Automotive, High Reliability Semiconductor Market, By Region, 2019-2032 (USD Billion)
14. Global Defense, High Reliability Semiconductor Market, By Region, 2019-2032 (USD Billion)
15. Global Aerospace, High Reliability Semiconductor Market, By Region, 2019-2032 (USD Billion)
16. Global High Reliability Semiconductor Market, By Region, 2019-2032 (USD Billion)
17. North America High Reliability Semiconductor Market, By Type, 2019-2032 (USD Billion)
18. North America High Reliability Semiconductor Market, By Packaging Material, 2019-2032 (USD Billion)
19. North America High Reliability Semiconductor Market, By Technology, 2019-2032 (USD Billion)
20. North America High Reliability Semiconductor Market, By Application, 2019-2032 (USD Billion)
21. U.S. High Reliability Semiconductor Market, By Type, 2019-2032 (USD Billion)
22. U.S. High Reliability Semiconductor Market, By Packaging Material, 2019-2032 (USD Billion)
23. U.S. High Reliability Semiconductor Market, By Technology, 2019-2032 (USD Billion)
24. U.S. High Reliability Semiconductor Market, By Application, 2019-2032 (USD Billion)
25. Canada High Reliability Semiconductor Market, By Type, 2019-2032 (USD Billion)
26. Canada High Reliability Semiconductor Market, By Packaging Material, 2019-2032 (USD Billion)
27. Canada High Reliability Semiconductor Market, By Technology, 2019-2032 (USD Billion)
28. Canada High Reliability Semiconductor Market, By Application, 2019-2032 (USD Billion)
29. Mexico High Reliability Semiconductor Market, By Type, 2019-2032 (USD Billion)
30. Mexico High Reliability Semiconductor Market, By Packaging Material, 2019-2032 (USD Billion)
31. Mexico High Reliability Semiconductor Market, By Technology, 2019-2032 (USD Billion)
32. Mexico High Reliability Semiconductor Market, By Application, 2019-2032 (USD Billion)
33. Europe High Reliability Semiconductor Market, By Type, 2019-2032 (USD Billion)
34. Europe High Reliability Semiconductor Market, By Packaging Material, 2019-2032 (USD Billion)
35. Europe High Reliability Semiconductor Market, By Technology, 2019-2032 (USD Billion)
36. Europe High Reliability Semiconductor Market, By Application, 2019-2032 (USD Billion)
37. Germany High Reliability Semiconductor Market, By Type, 2019-2032 (USD Billion)
38. Germany High Reliability Semiconductor Market, By Packaging Material, 2019-2032 (USD Billion)
39. Germany High Reliability Semiconductor Market, By Technology, 2019-2032 (USD Billion)
40. Germany High Reliability Semiconductor Market, By Application, 2019-2032 (USD Billion)
41. France High Reliability Semiconductor Market, By Type, 2019-2032 (USD Billion)
42. France High Reliability Semiconductor Market, By Packaging Material, 2019-2032 (USD Billion)
43. France High Reliability Semiconductor Market, By Technology, 2019-2032 (USD Billion)
44. France High Reliability Semiconductor Market, By Application, 2019-2032 (USD Billion)
45. U.K. High Reliability Semiconductor Market, By Type, 2019-2032 (USD Billion)
46. U.K. High Reliability Semiconductor Market, By Packaging Material, 2019-2032 (USD Billion)
47. U.K. High Reliability Semiconductor Market, By Technology, 2019-2032 (USD Billion)
48. U.K. High Reliability Semiconductor Market, By Application, 2019-2032 (USD Billion)
49. Italy High Reliability Semiconductor Market, By Type, 2019-2032 (USD Billion)
50. Italy High Reliability Semiconductor Market, By Packaging Material, 2019-2032 (USD Billion)
51. Italy High Reliability Semiconductor Market, By Technology, 2019-2032 (USD Billion)
52. Italy High Reliability Semiconductor Market, By Application, 2019-2032 (USD Billion)
53. Spain High Reliability Semiconductor Market, By Type, 2019-2032 (USD Billion)
54. Spain High Reliability Semiconductor Market, By Packaging Material, 2019-2032 (USD Billion)
55. Spain High Reliability Semiconductor Market, By Technology, 2019-2032 (USD Billion)
56. Spain High Reliability Semiconductor Market, By Application, 2019-2032 (USD Billion)
57. Asia Pacific High Reliability Semiconductor Market, By Type, 2019-2032 (USD Billion)
58. Asia Pacific High Reliability Semiconductor Market, By Packaging Material, 2019-2032 (USD Billion)
59. Asia Pacific High Reliability Semiconductor Market, By Technology, 2019-2032 (USD Billion)
60. Asia Pacific High Reliability Semiconductor Market, By Application, 2019-2032 (USD Billion)
61. Japan High Reliability Semiconductor Market, By Type, 2019-2032 (USD Billion)
62. Japan High Reliability Semiconductor Market, By Packaging Material, 2019-2032 (USD Billion)
63. Japan High Reliability Semiconductor Market, By Technology, 2019-2032 (USD Billion)
64. Japan High Reliability Semiconductor Market, By Application, 2019-2032 (USD Billion)
65. China High Reliability Semiconductor Market, By Type, 2019-2032 (USD Billion)
66. China High Reliability Semiconductor Market, By Packaging Material, 2019-2032 (USD Billion)
67. China High Reliability Semiconductor Market, By Technology, 2019-2032 (USD Billion)
68. China High Reliability Semiconductor Market, By Application, 2019-2032 (USD Billion)
69. India High Reliability Semiconductor Market, By Type, 2019-2032 (USD Billion)
70. India High Reliability Semiconductor Market, By Packaging Material, 2019-2032 (USD Billion)
71. India High Reliability Semiconductor Market, By Technology, 2019-2032 (USD Billion)
72. India High Reliability Semiconductor Market, By Application, 2019-2032 (USD Billion)
73. South America High Reliability Semiconductor Market, By Type, 2019-2032 (USD Billion)
74. South America High Reliability Semiconductor Market, By Packaging Material, 2019-2032 (USD Billion)
75. South America High Reliability Semiconductor Market, By Technology, 2019-2032 (USD Billion)
76. South America High Reliability Semiconductor Market, By Application, 2019-2032 (USD Billion)
77. Brazil High Reliability Semiconductor Market, By Type, 2019-2032 (USD Billion)
78. Brazil High Reliability Semiconductor Market, By Packaging Material, 2019-2032 (USD Billion)
79. Brazil High Reliability Semiconductor Market, By Technology, 2019-2032 (USD Billion)
80. Brazil High Reliability Semiconductor Market, By Application, 2019-2032 (USD Billion)
81. Middle East and Africa High Reliability Semiconductor Market, By Type, 2019-2032 (USD Billion)
82. Middle East and Africa High Reliability Semiconductor Market, By Packaging Material, 2019-2032 (USD Billion)
83. Middle East and Africa High Reliability Semiconductor Market, By Technology, 2019-2032 (USD Billion)
84. Middle East and Africa High Reliability Semiconductor Market, By Application, 2019-2032 (USD Billion)
85. UAE High Reliability Semiconductor Market, By Type, 2019-2032 (USD Billion)
86. UAE High Reliability Semiconductor Market, By Packaging Material, 2019-2032 (USD Billion)
87. UAE High Reliability Semiconductor Market, By Technology, 2019-2032 (USD Billion)
88. UAE High Reliability Semiconductor Market, By Application, 2019-2032 (USD Billion)
89. South Africa High Reliability Semiconductor Market, By Type, 2019-2032 (USD Billion)
90. South Africa High Reliability Semiconductor Market, By Packaging Material, 2019-2032 (USD Billion)
91. South Africa High Reliability Semiconductor Market, By Technology, 2019-2032 (USD Billion)
South Africa High Reliability Semiconductor Market, By Application, 2019-2032 (USD Billion)
List of Figures
1. Global High Reliability Semiconductor Market Segmentation
2. High Reliability Semiconductor Market: Research Methodology
3. Market Size Estimation Methodology: Bottom-Up Approach
4. Market Size Estimation Methodology: Top-Down Approach
5. Data Triangulation
6. Porter’s Five Forces Analysis
7. Value Chain Analysis
8. Global High Reliability Semiconductor Market Attractiveness Analysis by Type
9. Global High Reliability Semiconductor Market Attractiveness Analysis by Packaging Material
10. Global High Reliability Semiconductor Market Attractiveness Analysis by Technology
11. Global High Reliability Semiconductor Market Attractiveness Analysis by Application
12. Global High Reliability Semiconductor Market Attractiveness Analysis by Region
13. Global High Reliability Semiconductor Market: Dynamics
14. Global High Reliability Semiconductor Market Share by Type (2022 & 2032)
15. Global High Reliability Semiconductor Market Share by Packaging Material (2022 & 2032)
16. Global High Reliability Semiconductor Market Share by Technology (2022 & 2032)
17. Global High Reliability Semiconductor Market Share by Application (2022 & 2032)
18. Global High Reliability Semiconductor Market Share by Regions (2022 & 2032)
19. Global High Reliability Semiconductor Market Share by Company (2022)
This study forecasts revenue at global, regional, and country levels from 2019 to 2032. The Brainy Insights has segmented the global high reliability semiconductor market based on below mentioned segments:
Global High Reliability Semiconductor Market by Type:
Global High Reliability Semiconductor Market by Packaging Material:
Global High Reliability Semiconductor Market by Technology:
Global High Reliability Semiconductor Market by Application:
Global High Reliability Semiconductor Market by Region:
Research has its special purpose to undertake marketing efficiently. In this competitive scenario, businesses need information across all industry verticals; the information about customer wants, market demand, competition, industry trends, distribution channels etc. This information needs to be updated regularly because businesses operate in a dynamic environment. Our organization, The Brainy Insights incorporates scientific and systematic research procedures in order to get proper market insights and industry analysis for overall business success. The analysis consists of studying the market from a miniscule level wherein we implement statistical tools which helps us in examining the data with accuracy and precision.
Our research reports feature both; quantitative and qualitative aspects for any market. Qualitative information for any market research process are fundamental because they reveal the customer needs and wants, usage and consumption for any product/service related to a specific industry. This in turn aids the marketers/investors in knowing certain perceptions of the customers. Qualitative research can enlighten about the different product concepts and designs along with unique service offering that in turn, helps define marketing problems and generate opportunities. On the other hand, quantitative research engages with the data collection process through interviews, e-mail interactions, surveys and pilot studies. Quantitative aspects for the market research are useful to validate the hypotheses generated during qualitative research method, explore empirical patterns in the data with the help of statistical tools, and finally make the market estimations.
The Brainy Insights offers comprehensive research and analysis, based on a wide assortment of factual insights gained through interviews with CXOs and global experts and secondary data from reliable sources. Our analysts and industry specialist assume vital roles in building up statistical tools and analysis models, which are used to analyse the data and arrive at accurate insights with exceedingly informative research discoveries. The data provided by our organization have proven precious to a diverse range of companies, facilitating them to address issues such as determining which products/services are the most appealing, whether or not customers use the product in the manner anticipated, the purchasing intentions of the market and many others.
Our research methodology encompasses an idyllic combination of primary and secondary initiatives. Key phases involved in this process are listed below:

The phase involves the gathering and collecting of market data and its related information with the help of different sources & research procedures.

The data procurement stage involves in data gathering and collecting through various data sources.
This stage involves in extensive research. These data sources includes:
Purchased Database: Purchased databases play a crucial role in estimating the market sizes irrespective of the domain. Our purchased database includes:
Primary Research: The Brainy Insights interacts with leading companies and experts of the concerned domain to develop the analyst team’s market understanding and expertise. It improves and substantiates every single data presented in the market reports. Primary research mainly involves in telephonic interviews, E-mail interactions and face-to-face interviews with the raw material providers, manufacturers/producers, distributors, & independent consultants. The interviews that we conduct provides valuable data on market size and industry growth trends prevailing in the market. Our organization also conducts surveys with the various industry experts in order to gain overall insights of the industry/market. For instance, in healthcare industry we conduct surveys with the pharmacists, doctors, surgeons and nurses in order to gain insights and key information of a medical product/device/equipment which the customers are going to usage. Surveys are conducted in the form of questionnaire designed by our own analyst team. Surveys plays an important role in primary research because surveys helps us to identify the key target audiences of the market. Additionally, surveys helps to identify the key target audience engaged with the market. Our survey team conducts the survey by targeting the key audience, thus gaining insights from them. Based on the perspectives of the customers, this information is utilized to formulate market strategies. Moreover, market surveys helps us to understand the current competitive situation of the industry. To be precise, our survey process typically involve with the 360 analysis of the market. This analytical process begins by identifying the prospective customers for a product or service related to the market/industry to obtain data on how a product/service could fit into customers’ lives.

Secondary Research: The secondary data sources includes information published by the on-profit organizations such as World bank, WHO, company fillings, investor presentations, annual reports, national government documents, statistical databases, blogs, articles, white papers and others. From the annual report, we analyse a company’s revenue to understand the key segment and market share of that organization in a particular region. We analyse the company websites and adopt the product mapping technique which is important for deriving the segment revenue. In the product mapping method, we select and categorize the products offered by the companies catering to domain specific market, deduce the product revenue for each of the companies so as to get overall estimation of the market size. We also source data and analyses trends based on information received from supply side and demand side intermediaries in the value chain. The supply side denotes the data gathered from supplier, distributor, wholesaler and the demand side illustrates the data gathered from the end customers for respective market domain.

The supply side for a domain specific market is analysed by:
The demand side for the market is estimated through:
In-house Library: Apart from these third-party sources, we have our in-house library of qualitative and quantitative information. Our in-house database includes market data for various industry and domains. These data are updated on regular basis as per the changing market scenario. Our library includes, historic databases, internal audit reports and archives.
Sometimes there are instances where there is no metadata or raw data available for any domain specific market. For those cases, we use our expertise to forecast and estimate the market size in order to generate comprehensive data sets. Our analyst team adopt a robust research technique in order to produce the estimates:
Data Synthesis: This stage involves the analysis & mapping of all the information obtained from the previous step. It also involves in scrutinizing the data for any discrepancy observed while data gathering related to the market. The data is collected with consideration to the heterogeneity of sources. Robust scientific techniques are in place for synthesizing disparate data sets and provide the essential contextual information that can orient market strategies. The Brainy Insights has extensive experience in data synthesis where the data passes through various stages:


Market Deduction & Formulation: The final stage comprises of assigning data points at appropriate market spaces so as to deduce feasible conclusions. Analyst perspective & subject matter expert based holistic form of market sizing coupled with industry analysis also plays a crucial role in this stage.
This stage involves in finalization of the market size and numbers that we have collected from data integration step. With data interpolation, it is made sure that there is no gap in the market data. Successful trend analysis is done by our analysts using extrapolation techniques, which provide the best possible forecasts for the market.
Data Validation & Market Feedback: Validation is the most important step in the process. Validation & re-validation via an intricately designed process helps us finalize data-points to be used for final calculations.

The Brainy Insights interacts with leading companies and experts of the concerned domain to develop the analyst team’s market understanding and expertise. It improves and substantiates every single data presented in the market reports. The data validation interview and discussion panels are typically composed of the most experienced industry members. The participants include, however, are not limited to:
Moreover, we always validate our data and findings through primary respondents from all the major regions we are working on.


Free Customization
Fortune 500 Clients
Free Yearly Update On Purchase Of Multi/Corporate License
Companies Served Till Date