- +1-315-215-1633
- sales@thebrainyinsights.com

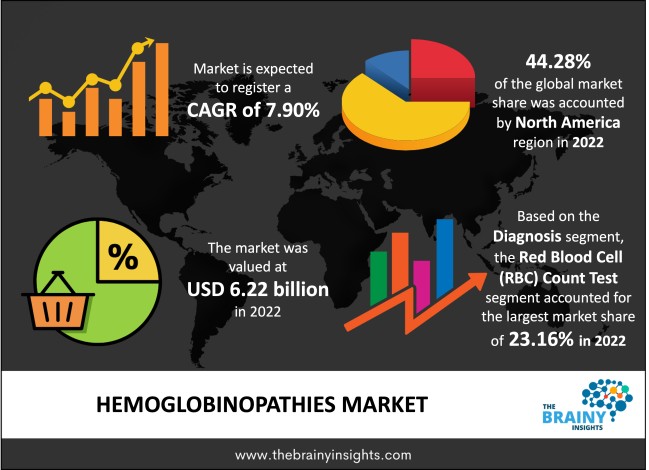
The global hemoglobinopathies market was valued at USD 6.22 billion in 2022, growing at a CAGR of 7.90% from 2023 to 2032. The market is expected to reach USD 13.29 billion by 2032. The growing demand for diagnostic and treatment services for hemoglobinopathies and the increasing incidence of hemoglobinopathies, which focus on controlling air pollution, is propelling the market growth.
Hemoglobinopathies are a blood disease that directly influences the red blood cells. It is a genetic defect that results in the abnormal structure of globin chains of the haemoglobin molecule. Sickle cell anaemia, haemoglobin C disease, thalassemia, and haemoglobin S-C disorder are the most prevalent examples of hemoglobinopathies disease. There are two significant groups: abnormal structural haemoglobin variants caused by mutations in the haemoglobin genes and thalassemia caused by an underproduction of otherwise normal haemoglobin molecules. The main structural haemoglobin variants are HbC, HbS, and HbE. The significant types of thalassemia are alpha-thalassemia & beta-thalassemia. The essential haemoglobinopathies result in either a shift in the structure & quality of the haemoglobin or a reduction in the quantity of haemoglobin produced. Haemoglobin levels tend to be higher in HbSC disease than in sickle cell anaemia and may even be at the low end of the normal range. The clinical course of adults with HbSC anaemia varies from that of sickle cell anaemia in that symptoms like painful concerns are less frequent & less severe.
Get an overview of this study by requesting a free sample
The growing awareness about hemoglobinopathy: The increasing awareness regarding hemoglobinopathies and government initiatives to diagnose the diseases at an early stage are the driving factor of the market growth. Further, the insufficient healthcare infrastructure and low levels of disease diagnosis and treatments are expected to drive market growth. Also, the increasing number of blood donations in government initiatives is helping to boost market growth. Moreover, many patients with sickle cell disease & thalassemia are also helping to boost the market growth over the forecast period.
The lack of high sensitivity and specific diagnostic tests: The lack of high sensitivity and specific diagnostic tests is the restraining factor of the market growth. Further, the lack of therapy in less developed regions & unawareness about the disorder hampers the market growth.
The growing investment in developing novel therapies: The rising approvals from the regulatory bodies for novel therapies are the opportunity factor for market growth. Further, the different programs undertaken by governments, like thalassemia screening in neonates & providing medicines, are expected to propel the market growth. Also, the rising prevalence of haemoglobin disorders such as Sickle Cell Disease, Hb C, thalassemia, and Hb E is the opportunity factor for market growth. Moreover, the development of the low-cost diagnostic kit for hemoglobinopathy, and the approval for newer biopharmaceutical products & continuous R&D, are expected to drive market growth over the forecast period.
The regions analyzed for the market include North America, Europe, South America, Asia Pacific, the Middle East, and Africa. North America emerged as the largest global hemoglobinopathies market, with a 44.28% market revenue share in 2022. The increasing R&D investments by the key players, promising reimbursement scenarios, and the presence of high-quality healthcare infrastructure are expected to propel market growth in this region. Moreover, raised immigration of high-risk populations, along with the improved therapy and overall presence of healthcare infrastructure anticipated to drive market growth in this region. Additionally, the rising disposable income and significant investment by leading industry participants propel market growth over the forecast period. However, raised R&D efforts to develop new treatments and the availability of high-quality healthcare services helped stimulate market growth. The Asia Pacific region will account for the largest market share with revenue growth. This growth is attributed to the rise in awareness of sickle cell disorders. Further, the rise in the implementation of the latest technologies in the pharmaceutical & medicine sector is also helping to boost market growth. Additionally, increasing awareness among the general population, the rising prevalence of blood-related disorders among individuals worldwide, and the availability of high-quality healthcare services are also helping to boost the market growth in this region.
North America Region Hemoglobinopathies Market Share in 2022 - 44.28%
www.thebrainyinsights.com
Check the geographical analysis of this market by requesting a free sample
The diagnosis segment is divided into red blood cell (RBC) count test, genetic testing, high-performance liquid chromatography (HPLC) test, haemoglobin isoelectric (Hb IEF) focusing, haemoglobin electrophoresis (Hb ELP) test, and haemoglobin solubility test. The red blood cell (RBC) count test segment dominated the market, with a share of around 23.16% in 2022. This growth is attributed to the increasing medical spending by the government & regulatory bodies.
The type segment is divided into thalassemia, sickle cell disease, and others. The sickle cell disease segment dominated the market, with a market share of around 42.17% in 2022. This growth is attributed to the rising efforts of biopharmaceutical firms and non-profit organizations that aim to improve access to SCD treatment.
The therapy segment is divided into bone marrow transplant, blood transfusion, iron chelation therapy, and others. The blood transfusion segment dominated the market, with a market share of around 32.16% in 2022. This growth is attributed to raised accidents, trauma cases, and blood diseases.
| Attribute | Description |
|---|---|
| Market Size | Revenue (USD Billion) |
| Market size value in 2022 | USD 6.22 Billion |
| Market size value in 2032 | USD 13.29 Billion |
| CAGR (2023 to 2032) | 7.90% |
| Historical data | 2019-2021 |
| Base Year | 2022 |
| Forecast | 2023-2032 |
| Region | The regions analyzed for the market are Asia Pacific, Europe, South America, North America, and Middle East & Africa. Furthermore, the regions are further analyzed at the country level. |
| Segments | Diagnosis, Type, Therapy |
North America region emerged as the largest market for hemoglobinopathies.
The market's growth will be influenced by the rising incidence of hemoglobinopathies globally.
The high cost of treatment could hamper the market growth.
The growing R&D activities will provide huge opportunities to the market.
1. Introduction
1.1. Objectives of the Study
1.2. Market Definition
1.3. Research Scope
1.4. Currency
1.5. Key Target Audience
2. Research Methodology and Assumptions
3. Executive Summary
4. Premium Insights
4.1. Porter’s Five Forces Analysis
4.2. Value Chain Analysis
4.3. Top Investment Pockets
4.3.1. Market Attractiveness Analysis By Diagnosis
4.3.2. Market Attractiveness Analysis By Type
4.3.3. Market Attractiveness Analysis By Therapy
4.3.4. Market Attractiveness Analysis By Region
4.4. Industry Trends
5. Market Dynamics
5.1. Market Evaluation
5.2. Drivers
5.2.1. The increase in research & development activities
5.2.2. The growing awareness among the general population
5.2.3. The rising incidence of hemoglobinopathies globally
5.3. Restraints
5.3.1. The lack of high sensitivity and specific diagnostic tests
5.3.2. The high cost of treatment
5.4. Opportunities
5.4.1. The growing investment in developing novel therapies
5.4.2. The growing R&D activities
5.4.3. The rapid technological advancements in the healthcare sector
6. Global Hemoglobinopathies Market Analysis and Forecast, By Diagnosis
6.1. Segment Overview
6.2. Red Blood Cell (RBC) Count Test
6.3. Genetic Testing
6.4. High-Performance Liquid Chromatography (HPLC) Test
6.5. Hemoglobin Isoelectric (Hb IEF) Focusing
6.6. Hemoglobin Electrophoresis (Hb ELP) Test
6.7. Hemoglobin Solubility Test
7. Global Hemoglobinopathies Market Analysis and Forecast, By Type
7.1. Segment Overview
7.2. Thalassemia
7.3. Sickle Cell Disease
7.4. Others
8. Global Hemoglobinopathies Market Analysis and Forecast, By Therapy
8.1. Segment Overview
8.2. Bone Marrow Transplant
8.3. Blood Transfusion
8.4. Iron Chelation Therapy
8.5. Others
9. Global Hemoglobinopathies Market Analysis and Forecast, By Regional Analysis
9.1. Segment Overview
9.2. North America
9.2.1. U.S.
9.2.2. Canada
9.2.3. Mexico
9.3. Europe
9.3.1. Germany
9.3.2. France
9.3.3. U.K.
9.3.4. Italy
9.3.5. Spain
9.4. Asia-Pacific
9.4.1. Japan
9.4.2. China
9.4.3. India
9.5. South America
9.5.1. Brazil
9.6. Middle East and Africa
9.6.1. UAE
9.6.2. South Africa
10. Global Hemoglobinopathies Market-Competitive Landscape
10.1. Overview
10.2. Market Share of Key Players in Global Hemoglobinopathies Market
10.2.1. Global Company Market Share
10.2.2. North America Company Market Share
10.2.3. Europe Company Market Share
10.2.4. APAC Company Market Share
10.3. Competitive Situations and Trends
10.3.1. Product Launches and Developments
10.3.2. Partnerships, Collaborations, and Agreements
10.3.3. Mergers & Acquisitions
10.3.4. Expansions
11. Company Profiles
11.1. Gamida Cell
11.1.1. Business Overview
11.1.2. Company Snapshot
11.1.3. Company Market Share Analysis
11.1.4. Company Product Portfolio
11.1.5. Recent Developments
11.1.6. SWOT Analysis
11.2. Alnylam Pharmaceuticals, Inc.
11.2.1. Business Overview
11.2.2. Company Snapshot
11.2.3. Company Market Share Analysis
11.2.4. Company Product Portfolio
11.2.5. Recent Developments
11.2.6. SWOT Analysis
11.3. Sangamo Therapeutics
11.3.1. Business Overview
11.3.2. Company Snapshot
11.3.3. Company Market Share Analysis
11.3.4. Company Product Portfolio
11.3.5. Recent Developments
11.3.6. SWOT Analysis
11.4. Global Blood Therapeutics, Inc.
11.4.1. Business Overview
11.4.2. Company Snapshot
11.4.3. Company Market Share Analysis
11.4.4. Company Product Portfolio
11.4.5. Recent Developments
11.4.6. SWOT Analysis
11.5. Acceleron Pharma, Inc.
11.5.1. Business Overview
11.5.2. Company Snapshot
11.5.3. Company Market Share Analysis
11.5.4. Company Product Portfolio
11.5.5. Recent Developments
11.5.6. SWOT Analysis
11.6. Biogen
11.6.1. Business Overview
11.6.2. Company Snapshot
11.6.3. Company Market Share Analysis
11.6.4. Company Product Portfolio
11.6.5. Recent Developments
11.6.6. SWOT Analysis
11.7. Prolong Pharmaceuticals, LLC.
11.7.1. Business Overview
11.7.2. Company Snapshot
11.7.3. Company Market Share Analysis
11.7.4. Company Product Portfolio
11.7.5. Recent Developments
11.7.6. SWOT Analysis
11.8. CELGENE CORPORATION
11.8.1. Business Overview
11.8.2. Company Snapshot
11.8.3. Company Market Share Analysis
11.8.4. Company Product Portfolio
11.8.5. Recent Developments
11.8.6. SWOT Analysis
11.9. Emmaus Life Sciences, Inc.
11.9.1. Business Overview
11.9.2. Company Snapshot
11.9.3. Company Market Share Analysis
11.9.4. Company Product Portfolio
11.9.5. Recent Developments
11.9.6. SWOT Analysis
11.10. Genetix Biotech Asia Pvt. Ltd
11.10.1. Business Overview
11.10.2. Company Snapshot
11.10.3. Company Market Share Analysis
11.10.4. Company Product Portfolio
11.10.5. Recent Developments
11.10.6. SWOT Analysis
11.11. Biogen
11.11.1. Business Overview
11.11.2. Company Snapshot
11.11.3. Company Market Share Analysis
11.11.4. Company Product Portfolio
11.11.5. Recent Developments
11.11.6. SWOT Analysis
11.12. Bio-Rad Laboratories, Inc.
11.12.1. Business Overview
11.12.2. Company Snapshot
11.12.3. Company Market Share Analysis
11.12.4. Company Product Portfolio
11.12.5. Recent Developments
11.12.6. SWOT Analysis
11.13. Abbott
11.13.1. Business Overview
11.13.2. Company Snapshot
11.13.3. Company Market Share Analysis
11.13.4. Company Product Portfolio
11.13.5. Recent Developments
11.13.6. SWOT Analysis
11.14. Nexcelom Bioscience LLC.
11.14.1. Business Overview
11.14.2. Company Snapshot
11.14.3. Company Market Share Analysis
11.14.4. Company Product Portfolio
11.14.5. Recent Developments
11.14.6. SWOT Analysis
11.15. Bristol-Myers Squibb Company
11.15.1. Business Overview
11.15.2. Company Snapshot
11.15.3. Company Market Share Analysis
11.15.4. Company Product Portfolio
11.15.5. Recent Developments
11.15.6. SWOT Analysis
11.16. Optinova
11.16.1. Business Overview
11.16.2. Company Snapshot
11.16.3. Company Market Share Analysis
11.16.4. Company Product Portfolio
11.16.5. Recent Developments
11.16.6. SWOT Analysis
11.17. Sysmex Corporation
11.17.1. Business Overview
11.17.2. Company Snapshot
11.17.3. Company Market Share Analysis
11.17.4. Company Product Portfolio
11.17.5. Recent Developments
11.17.6. SWOT Analysis
11.18. Danaher
11.18.1. Business Overview
11.18.2. Company Snapshot
11.18.3. Company Market Share Analysis
11.18.4. Company Product Portfolio
11.18.5. Recent Developments
11.18.6. SWOT Analysis
List of Table
1. Global Hemoglobinopathies Market, By Diagnosis, 2019-2032 (USD Billion)
2. Global Red Blood Cell (RBC) Count Test, Hemoglobinopathies Market, By Region, 2019-2032 (USD Billion)
3. Global Genetic Testing, Hemoglobinopathies Market, By Region, 2019-2032 (USD Billion)
4. Global High-Performance Liquid Chromatography (HPLC) Test, Hemoglobinopathies Market, By Region, 2019-2032 (USD Billion)
5. Global Hemoglobin Isoelectric (Hb IEF) Focusing, Hemoglobinopathies Market, By Region, 2019-2032 (USD Billion)
6. Global Hemoglobin Electrophoresis (Hb ELP) Test, Hemoglobinopathies Market, By Region, 2019-2032 (USD Billion)
7. Global Hemoglobin Solubility Test, Hemoglobinopathies Market, By Region, 2019-2032 (USD Billion)
8. Global Hemoglobinopathies Market, By Type, 2019-2032 (USD Billion)
9. Global Thalassemia, Hemoglobinopathies Market, By Region, 2019-2032 (USD Billion)
10. Global Sickle Cell Disease, Hemoglobinopathies Market, By Region, 2019-2032 (USD Billion)
11. Global Others, Hemoglobinopathies Market, By Region, 2019-2032 (USD Billion)
12. Global Hemoglobinopathies Market, By Therapy, 2019-2032 (USD Billion)
13. Global Bone Marrow Transplant, Hemoglobinopathies Market, By Region, 2019-2032 (USD Billion)
14. Global Blood Transfusion, Hemoglobinopathies Market, By Region, 2019-2032 (USD Billion)
15. Global Iron Chelation Therapy, Hemoglobinopathies Market, By Region, 2019-2032 (USD Billion)
16. Global Others, Hemoglobinopathies Market, By Region, 2019-2032 (USD Billion)
17. North America Hemoglobinopathies Market, By Diagnosis, 2019-2032 (USD Billion)
18. North America Hemoglobinopathies Market, By Type, 2019-2032 (USD Billion)
19. North America Hemoglobinopathies Market, By Therapy, 2019-2032 (USD Billion)
20. U.S. Hemoglobinopathies Market, By Diagnosis, 2019-2032 (USD Billion)
21. U.S. Hemoglobinopathies Market, By Type, 2019-2032 (USD Billion)
22. U.S. Hemoglobinopathies Market, By Therapy, 2019-2032 (USD Billion)
23. Canada Hemoglobinopathies Market, By Diagnosis, 2019-2032 (USD Billion)
24. Canada Hemoglobinopathies Market, By Type, 2019-2032 (USD Billion)
25. Canada Hemoglobinopathies Market, By Therapy, 2019-2032 (USD Billion)
26. Mexico Hemoglobinopathies Market, By Diagnosis, 2019-2032 (USD Billion)
27. Mexico Hemoglobinopathies Market, By Type, 2019-2032 (USD Billion)
28. Mexico Hemoglobinopathies Market, By Therapy, 2019-2032 (USD Billion)
29. Europe Hemoglobinopathies Market, By Diagnosis, 2019-2032 (USD Billion)
30. Europe Hemoglobinopathies Market, By Type, 2019-2032 (USD Billion)
31. Europe Hemoglobinopathies Market, By Therapy, 2019-2032 (USD Billion)
32. Germany Hemoglobinopathies Market, By Diagnosis, 2019-2032 (USD Billion)
33. Germany Hemoglobinopathies Market, By Type, 2019-2032 (USD Billion)
34. Germany Hemoglobinopathies Market, By Therapy, 2019-2032 (USD Billion)
35. France Hemoglobinopathies Market, By Diagnosis, 2019-2032 (USD Billion)
36. France Hemoglobinopathies Market, By Type, 2019-2032 (USD Billion)
37. France Hemoglobinopathies Market, By Therapy, 2019-2032 (USD Billion)
38. U.K. Hemoglobinopathies Market, By Diagnosis, 2019-2032 (USD Billion)
39. U.K. Hemoglobinopathies Market, By Type, 2019-2032 (USD Billion)
40. U.K. Hemoglobinopathies Market, By Therapy, 2019-2032 (USD Billion)
41. Italy Hemoglobinopathies Market, By Diagnosis, 2019-2032 (USD Billion)
42. Italy Hemoglobinopathies Market, By Type, 2019-2032 (USD Billion)
43. Italy Hemoglobinopathies Market, By Therapy, 2019-2032 (USD Billion)
44. Spain Hemoglobinopathies Market, By Diagnosis, 2019-2032 (USD Billion)
45. Spain Hemoglobinopathies Market, By Type, 2019-2032 (USD Billion)
46. Spain Hemoglobinopathies Market, By Therapy, 2019-2032 (USD Billion)
47. Asia Pacific Hemoglobinopathies Market, By Diagnosis, 2019-2032 (USD Billion)
48. Asia Pacific Hemoglobinopathies Market, By Type, 2019-2032 (USD Billion)
49. Asia Pacific Hemoglobinopathies Market, By Therapy, 2019-2032 (USD Billion)
50. Japan Hemoglobinopathies Market, By Diagnosis, 2019-2032 (USD Billion)
51. Japan Hemoglobinopathies Market, By Type, 2019-2032 (USD Billion)
52. Japan Hemoglobinopathies Market, By Therapy, 2019-2032 (USD Billion)
53. China Hemoglobinopathies Market, By Diagnosis, 2019-2032 (USD Billion)
54. China Hemoglobinopathies Market, By Type, 2019-2032 (USD Billion)
55. China Hemoglobinopathies Market, By Therapy, 2019-2032 (USD Billion)
56. India Hemoglobinopathies Market, By Diagnosis, 2019-2032 (USD Billion)
57. India Hemoglobinopathies Market, By Type, 2019-2032 (USD Billion)
58. India Hemoglobinopathies Market, By Therapy, 2019-2032 (USD Billion)
59. South America Hemoglobinopathies Market, By Diagnosis, 2019-2032 (USD Billion)
60. South America Hemoglobinopathies Market, By Type, 2019-2032 (USD Billion)
61. South America Hemoglobinopathies Market, By Therapy, 2019-2032 (USD Billion)
62. Brazil Hemoglobinopathies Market, By Diagnosis, 2019-2032 (USD Billion)
63. Brazil Hemoglobinopathies Market, By Type, 2019-2032 (USD Billion)
64. Brazil Hemoglobinopathies Market, By Therapy, 2019-2032 (USD Billion)
65. Middle East and Africa Hemoglobinopathies Market, By Diagnosis, 2019-2032 (USD Billion)
66. Middle East and Africa Hemoglobinopathies Market, By Type, 2019-2032 (USD Billion)
67. Middle East and Africa Hemoglobinopathies Market, By Therapy, 2019-2032 (USD Billion)
68. UAE Hemoglobinopathies Market, By Diagnosis, 2019-2032 (USD Billion)
69. UAE Hemoglobinopathies Market, By Type, 2019-2032 (USD Billion)
70. UAE Hemoglobinopathies Market, By Therapy, 2019-2032 (USD Billion)
71. South Africa Hemoglobinopathies Market, By Diagnosis, 2019-2032 (USD Billion)
72. South Africa Hemoglobinopathies Market, By Type, 2019-2032 (USD Billion)
73. South Africa Hemoglobinopathies Market, By Therapy, 2019-2032 (USD Billion)
List of Figures
1. Global Hemoglobinopathies Market Segmentation
2. Global Hemoglobinopathies Market: Research Methodology
3. Market Size Estimation Methodology: Bottom-Up Approach
4. Market Size Estimation Methodology: Top- Approach
5. Data Triangulation
6. Porter’s Five Forces Analysis
7. Value Chain Analysis
8. Global Hemoglobinopathies Market Attractiveness Analysis By Diagnosis
9. Global Hemoglobinopathies Market Attractiveness Analysis By Type
10. Global Hemoglobinopathies Market Attractiveness Analysis By Therapy
11. Global Hemoglobinopathies Market Attractiveness Analysis By Region
12. Global Hemoglobinopathies Market: Dynamics
13. Global Hemoglobinopathies Market Share By Diagnosis (2023 & 2032)
14. Global Hemoglobinopathies Market Share By Type (2023 & 2032)
15. Global Hemoglobinopathies Market Share By Therapy (2023 & 2032)
16. Global Hemoglobinopathies Market Share By Regions (2023 & 2032)
17. Global Hemoglobinopathies Market Share By Company (2022)
This study forecasts revenue at global, regional, and country levels from 2019 to 2030. The Brainy Insights has segmented the global Hemoglobinopathies based on below mentioned segments:
Global Hemoglobinopathies Market by Diagnosis:
Global Hemoglobinopathies Market by Type:
Global Hemoglobinopathies Market by Therapy:
Global Hemoglobinopathies by Region:
Research has its special purpose to undertake marketing efficiently. In this competitive scenario, businesses need information across all industry verticals; the information about customer wants, market demand, competition, industry trends, distribution channels etc. This information needs to be updated regularly because businesses operate in a dynamic environment. Our organization, The Brainy Insights incorporates scientific and systematic research procedures in order to get proper market insights and industry analysis for overall business success. The analysis consists of studying the market from a miniscule level wherein we implement statistical tools which helps us in examining the data with accuracy and precision.
Our research reports feature both; quantitative and qualitative aspects for any market. Qualitative information for any market research process are fundamental because they reveal the customer needs and wants, usage and consumption for any product/service related to a specific industry. This in turn aids the marketers/investors in knowing certain perceptions of the customers. Qualitative research can enlighten about the different product concepts and designs along with unique service offering that in turn, helps define marketing problems and generate opportunities. On the other hand, quantitative research engages with the data collection process through interviews, e-mail interactions, surveys and pilot studies. Quantitative aspects for the market research are useful to validate the hypotheses generated during qualitative research method, explore empirical patterns in the data with the help of statistical tools, and finally make the market estimations.
The Brainy Insights offers comprehensive research and analysis, based on a wide assortment of factual insights gained through interviews with CXOs and global experts and secondary data from reliable sources. Our analysts and industry specialist assume vital roles in building up statistical tools and analysis models, which are used to analyse the data and arrive at accurate insights with exceedingly informative research discoveries. The data provided by our organization have proven precious to a diverse range of companies, facilitating them to address issues such as determining which products/services are the most appealing, whether or not customers use the product in the manner anticipated, the purchasing intentions of the market and many others.
Our research methodology encompasses an idyllic combination of primary and secondary initiatives. Key phases involved in this process are listed below:

The phase involves the gathering and collecting of market data and its related information with the help of different sources & research procedures.

The data procurement stage involves in data gathering and collecting through various data sources.
This stage involves in extensive research. These data sources includes:
Purchased Database: Purchased databases play a crucial role in estimating the market sizes irrespective of the domain. Our purchased database includes:
Primary Research: The Brainy Insights interacts with leading companies and experts of the concerned domain to develop the analyst team’s market understanding and expertise. It improves and substantiates every single data presented in the market reports. Primary research mainly involves in telephonic interviews, E-mail interactions and face-to-face interviews with the raw material providers, manufacturers/producers, distributors, & independent consultants. The interviews that we conduct provides valuable data on market size and industry growth trends prevailing in the market. Our organization also conducts surveys with the various industry experts in order to gain overall insights of the industry/market. For instance, in healthcare industry we conduct surveys with the pharmacists, doctors, surgeons and nurses in order to gain insights and key information of a medical product/device/equipment which the customers are going to usage. Surveys are conducted in the form of questionnaire designed by our own analyst team. Surveys plays an important role in primary research because surveys helps us to identify the key target audiences of the market. Additionally, surveys helps to identify the key target audience engaged with the market. Our survey team conducts the survey by targeting the key audience, thus gaining insights from them. Based on the perspectives of the customers, this information is utilized to formulate market strategies. Moreover, market surveys helps us to understand the current competitive situation of the industry. To be precise, our survey process typically involve with the 360 analysis of the market. This analytical process begins by identifying the prospective customers for a product or service related to the market/industry to obtain data on how a product/service could fit into customers’ lives.

Secondary Research: The secondary data sources includes information published by the on-profit organizations such as World bank, WHO, company fillings, investor presentations, annual reports, national government documents, statistical databases, blogs, articles, white papers and others. From the annual report, we analyse a company’s revenue to understand the key segment and market share of that organization in a particular region. We analyse the company websites and adopt the product mapping technique which is important for deriving the segment revenue. In the product mapping method, we select and categorize the products offered by the companies catering to domain specific market, deduce the product revenue for each of the companies so as to get overall estimation of the market size. We also source data and analyses trends based on information received from supply side and demand side intermediaries in the value chain. The supply side denotes the data gathered from supplier, distributor, wholesaler and the demand side illustrates the data gathered from the end customers for respective market domain.

The supply side for a domain specific market is analysed by:
The demand side for the market is estimated through:
In-house Library: Apart from these third-party sources, we have our in-house library of qualitative and quantitative information. Our in-house database includes market data for various industry and domains. These data are updated on regular basis as per the changing market scenario. Our library includes, historic databases, internal audit reports and archives.
Sometimes there are instances where there is no metadata or raw data available for any domain specific market. For those cases, we use our expertise to forecast and estimate the market size in order to generate comprehensive data sets. Our analyst team adopt a robust research technique in order to produce the estimates:
Data Synthesis: This stage involves the analysis & mapping of all the information obtained from the previous step. It also involves in scrutinizing the data for any discrepancy observed while data gathering related to the market. The data is collected with consideration to the heterogeneity of sources. Robust scientific techniques are in place for synthesizing disparate data sets and provide the essential contextual information that can orient market strategies. The Brainy Insights has extensive experience in data synthesis where the data passes through various stages:


Market Deduction & Formulation: The final stage comprises of assigning data points at appropriate market spaces so as to deduce feasible conclusions. Analyst perspective & subject matter expert based holistic form of market sizing coupled with industry analysis also plays a crucial role in this stage.
This stage involves in finalization of the market size and numbers that we have collected from data integration step. With data interpolation, it is made sure that there is no gap in the market data. Successful trend analysis is done by our analysts using extrapolation techniques, which provide the best possible forecasts for the market.
Data Validation & Market Feedback: Validation is the most important step in the process. Validation & re-validation via an intricately designed process helps us finalize data-points to be used for final calculations.

The Brainy Insights interacts with leading companies and experts of the concerned domain to develop the analyst team’s market understanding and expertise. It improves and substantiates every single data presented in the market reports. The data validation interview and discussion panels are typically composed of the most experienced industry members. The participants include, however, are not limited to:
Moreover, we always validate our data and findings through primary respondents from all the major regions we are working on.


Free Customization
Fortune 500 Clients
Free Yearly Update On Purchase Of Multi/Corporate License
Companies Served Till Date