- +1-315-215-1633
- sales@thebrainyinsights.com

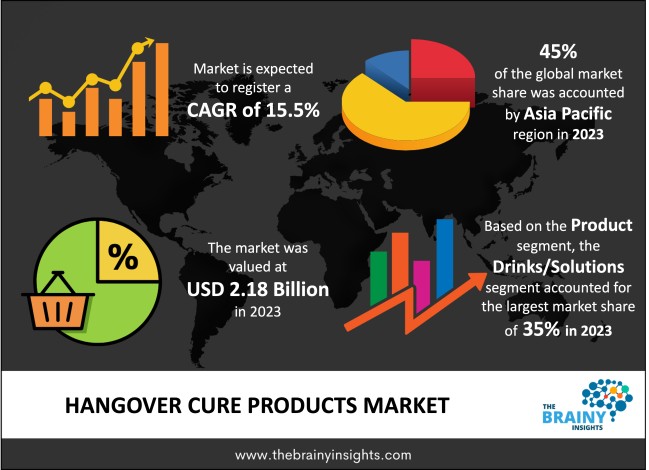
The hangover cure products market was valued at USD 2.18 billion in 2023 and is expected to expand at a CAGR of 15.5% over the forecast period from 2024 to 2033. The increasing consumption of alcoholic drinks is driving the growth of hangover cure products such as rehydration supplements, drinks, and powders. Moreover, increasing consumer focus on maintaining health even after the consumption of alcoholic drinks is likely to propel the growth.
To promote Hangover Cure Products, brands run many educational and awareness campaigns. This will inform consumers about these products and promote the brands. Promoting through social media influencers and celebrities can reach consumers more easily. Nowadays, people are very active on social media, following celebrities and social media influencers and using their products. This benefits companies a lot.
Hangover Cure Products relieve hangover symptoms such as headaches, nausea, fatigue, and dehydration, providing relief from the discomfort experienced after drinking. They also accelerate recovery time so that the consumer becomes normal as soon as possible. Hangover Cure Products are very easy to use. They are available in the market in the form of tablets, drinks, and patches and can be consumed immediately.
Get an overview of this study by requesting a free sample
Alcohol consumption can result in several conditions, such as dehydration, inflammation, sleep disturbance, hormonal imbalance, and direct toxin effects. With rising awareness of harmful side effects of alcohol consumption, such as dehydration and inflammation, consumers are focusing on adopting alcohol detox products, including hangover cure products, to avoid the deteriorating side effects of excess alcohol consumption.
The COVID‑19 pandemic has impacted the patterns and places of alcohol consumption. Many individuals started engaging in harmful drinking to cope with the rising stress. During the pandemic, people have shifted their places of drinking from bars and restaurants to home. Overall, most consumers did not change their drinking quantity, among those who did, a higher percentage of people consumed more.
The growing awareness about the hangover cure products through social media platforms like YouTube and Instagram in countries the US, the UK, South Korea, and Australia, is likely to drive market growth during the forecast period. Moreover, the increasing availability and focus of companies to include herbal extracts, such as aloe vera, green tea extract, and Gotu kola, in their product offerings owing to the growing demand for herbal ingredients is anticipated to boost the demand for herbal hangover solutions.
In November 2020, BIOTAKE GmbH (ALCOVIT), a Germany-based company, launched hangover cure products in the US. The supplement is made from a mixture of vitamins, minerals, and antioxidants, which are designed to minimize the effects of a hangover. Thus, the increasing availability of products is expected to boost the demand for the products over the upcoming years.
Drinks/Solutions held the largest market share of more than 35% in 2023. Hangover cure solutions are gaining impetus owing to the robust demand from health-conscious consumers for premium hydration products to combat hangovers. Market players such as More Labs, and Morning Fresh have introduced hangover solutions in a range of flavors.
The increasing number of product launches to fulfill consumer demand is expected to boost the demand for this segment. For instance, in November 2020, Dong-A Pharmaceutical reinvigorated its hangover drink ‘Morning Care’ in versions S, H, and D for consumers to choose from. The company’s design has reflected customers’ needs, allowing customers to choose drinks depending on their specific needs.
Patches are expected to register the fastest CAGR during the forecast period. The demand for rehydration patches will prevail in the coming years as a majority of consumers seek innovative options when it comes to hangover cure products. These patches are applied on the skin before alcohol consumption, which allows active ingredients to diffuse through the pores of the skin, thereby maintaining nutrient levels during and after alcohol consumption.
Players like RallyPatch, LLC, and Party Patch are extending their product offerings in the natural hangover patches segment, which is expected to have a positive impact on the market growth. RallyPatch, LLC offers natural hangover patches infused with green tea, milk thistle, and globe artichoke extract. This highly effective combination has been attracting consumers.
Offline held the largest market share of more than 45% in 2023. The high-profit margin from hangover cure products has prompted retailers to dedicate certain shelf space for these products and expand their locations. For instance, Vitamin Cottage Natural Grocers, a US-based health and food company engaged in the manufacturing of hangover supplements expanded its presence by launching four specialty stores in the US in April 2021. This move was designed to help the company reach maximum consumers and increase its brand awareness.
The online distribution channel is anticipated to register the fastest CAGR during the forecast period. Owing to the growing popularity of this distribution channel, several market players are launching hangover cure products through online platforms. For instance, in December 2020, IVUSION Beverage Company, LLC launched a hangover hydration drink on its official store website. The hangover hydration drink is formulated with electrolytes, vitamins, and essential minerals to offer multipurpose hydration benefits to consumers. Consumers can shop for the product on the company website and other third-party websites such as Amazon and Alibaba.
Asia Pacific accounted for the highest share of more than 45% in 2023. The increasing awareness in countries such as India, Australia, Thailand, Indonesia, Singapore, and Malaysia about hangover cure products is expected to boost regional growth. Moreover, product launches are also supporting market growth. For instance, In October 2020, Singapore startup DrinkAid launched an anti-hangover capsule to reduce ‘Asian Flush’ by using pyroglutamic acid that increases liver recovery rate and intoxication, which is driving the consumption.
Europe is expected to witness the fastest growth from 2024-2033. According to a research study by The Lancet in 2019, the European region has the highest prevalence of alcohol drinkers and one of the highest rates of alcohol consumption per capita in the world. This scenario is likely to create huge opportunities for the hangover cure products market in this region. High product visibility and increasing product launches are the major factors driving the demand for hangover cure products in the region. For instance, in 2019, Glasgow biochemists, Dhruv Trivedi and Vandana Pillai introduced an after-alcohol drink, “Bounce Back” in the UK. The product claims to ensure that party-goers feel replenished after a good sleep.
The key players in the market have been implementing various strategies to increase market penetration such as partnerships with retailers, and pharmacy stores, and focusing on building online distribution channels.
Segments Covered in the Report
As per The Brainy Insights, the size of the hangover cure products market was valued at USD 2.18 billion in 2023 to USD 9.22 billion by 2033.
The global Hangover Cure Products market is growing at a CAGR of 15.5% during the forecast period 2024-2033.
The Asia Pacific region emerged as the largest market for the hangover cure products.
The increasing consumption of alcohol will influence the market's growth.
1. Introduction
1.1. Objectives of the Study
1.2. Market Definition
1.3. Research Scope
1.4. Currency
1.5. Key Target Audience
2. Research Methodology and Assumptions
3. Executive Summary
4. Premium Insights
4.1. Porter’s Five Forces Analysis
4.2. Value Chain Analysis
4.3. Top Investment Pockets
4.3.1. Market Attractiveness Analysis by Product
4.3.2. Market Attractiveness Analysis by Distribution Channel
4.3.3. Market Attractiveness Analysis by Region
4.4. Industry Trends
5. Market Dynamics
5.1. Market Evaluation
5.2. Drivers
5.2.1. Increasing consumption of alcohol
5.3. Restraints
5.3.1. Lack of product awareness
5.4. Opportunities
5.4.1. Adoption from Millennials and Generation Z
5.5. Challenges
5.5.1. Stringent regulation policies by FDA
6. Global Hangover Cure Products Market Analysis and Forecast, By Product
6.1. Segment Overview
6.2. Drinks/Solutions
6.3. Powder
6.4. Tablets & Capsules
6.5. Patches
6.6. Others
7. Global Hangover Cure Products Market Analysis and Forecast, By Distribution Channel
7.1. Segment Overview
7.2. Online
7.3. Offline
8. Global Hangover Cure Products Market Analysis and Forecast, By Regional Analysis
8.1. Segment Overview
8.2. North America
8.2.1. U.S.
8.2.2. Canada
8.2.3. Mexico
8.3. Europe
8.3.1. Germany
8.3.2. France
8.3.3. U.K.
8.3.4. Italy
8.3.5. Spain
8.4. Asia-Pacific
8.4.1. Japan
8.4.2. China
8.4.3. India
8.5. South America
8.5.1. Brazil
8.6. Middle East and Africa
8.6.1. UAE
8.6.2. South Africa
9. Global Hangover Cure Products Market-Competitive Landscape
9.1. Overview
9.2. Market Share of Key Players in the Hangover Cure Products Market
9.2.1. Global Company Market Share
9.2.2. North America Company Market Share
9.2.3. Europe Company Market Share
9.2.4. APAC Company Market Share
9.3. Competitive Situations and Trends
9.3.1. Product Launches and Developments
9.3.2. Partnerships, Collaborations, and Agreements
9.3.3. Mergers & Acquisitions
9.3.4. Expansions
10. Company Profiles
10.1. Bayer AG
10.1.1. Business Overview
10.1.2. Company Snapshot
10.1.3. Company Market Share Analysis
10.1.4. Company Product Portfolio
10.1.5. Recent Developments
10.1.6. SWOT Analysis
10.2. More Labs
10.2.1. Business Overview
10.2.2. Company Snapshot
10.2.3. Company Market Share Analysis
10.2.4. Company Product Portfolio
10.2.5. Recent Developments
10.2.6. SWOT Analysis
10.3. Flyby
10.3.1. Business Overview
10.3.2. Company Snapshot
10.3.3. Company Market Share Analysis
10.3.4. Company Product Portfolio
10.3.5. Recent Developments
10.3.6. SWOT Analysis
10.4. Rally Labs LLC
10.4.1. Business Overview
10.4.2. Company Snapshot
10.4.3. Company Market Share Analysis
10.4.4. Company Product Portfolio
10.4.5. Recent Developments
10.4.6. SWOT Analysis
10.5. Himalaya Wellness
10.5.1. Business Overview
10.5.2. Company Snapshot
10.5.3. Company Market Share Analysis
10.5.4. Company Product Portfolio
10.5.5. Recent Developments
10.5.6. SWOT Analysis
10.6. DOTSHOT
10.6.1. Business Overview
10.6.2. Company Snapshot
10.6.3. Company Market Share Analysis
10.6.4. Company Product Portfolio
10.6.5. Recent Developments
10.6.6. SWOT Analysis
10.7. DONG-A SOCIO HOLDINGS
10.7.1. Business Overview
10.7.2. Company Snapshot
10.7.3. Company Market Share Analysis
10.7.4. Company Product Portfolio
10.7.5. Recent Developments
10.7.6. SWOT Analysis
10.8. GLAMI.COM
10.8.1. Business Overview
10.8.2. Company Snapshot
10.8.3. Company Market Share Analysis
10.8.4. Company Product Portfolio
10.8.5. Recent Developments
10.8.6. SWOT Analysis
10.9. NoDaysWasted
10.9.1. Business Overview
10.9.2. Company Snapshot
10.9.3. Company Market Share Analysis
10.9.4. Company Product Portfolio
10.9.5. Recent Developments
10.9.6. SWOT Analysis
10.10. HK inno.N Corp
10.10.1. Business Overview
10.10.2. Company Snapshot
10.10.3. Company Market Share Analysis
10.10.4. Company Product Portfolio
10.10.5. Recent Developments
10.10.6. SWOT Analysis
10.11. DrinkAde
10.11.1. Business Overview
10.11.2. Company Snapshot
10.11.3. Company Market Share Analysis
10.11.4. Company Product Portfolio
10.11.5. Recent Developments
10.11.6. SWOT Analysis
10.12. Party Patch
10.12.1. Business Overview
10.12.2. Company Snapshot
10.12.3. Company Market Share Analysis
10.12.4. Company Product Portfolio
10.12.5. Recent Developments
10.12.6. SWOT Analysis
10.13. HANDOK
10.13.1. Business Overview
10.13.2. Company Snapshot
10.13.3. Company Market Share Analysis
10.13.4. Company Product Portfolio
10.13.5. Recent Developments
10.13.6. SWOT Analysis
10.14. Cheers Health Inc.
10.14.1. Business Overview
10.14.2. Company Snapshot
10.14.3. Company Market Share Analysis
10.14.4. Company Product Portfolio
10.14.5. Recent Developments
10.14.6. SWOT Analysis
List of Table
1. Global Hangover Cure Products Market, By Product, 2020-2033 (USD Billion)
2. Global Drinks/Solutions Hangover Cure Products Market, By Region, 2020-2033 (USD Billion)
3. Global Powder Hangover Cure Products Market, By Region, 2020-2033 (USD Billion)
4. Global Tablets & Capsules Hangover Cure Products Market, By Region, 2020-2033 (USD Billion)
5. Global Patches Hangover Cure Products Market, By Region, 2020-2033 (USD Billion)
6. Global Others Hangover Cure Products Market, By Region, 2020-2033 (USD Billion)
7. Global Hangover Cure Products Market, By Distribution Channel, 2020-2033 (USD Billion)
8. Global Online Hangover Cure Products Market, By Region, 2020-2033 (USD Billion)
9. Global Offline Hangover Cure Products Market, By Region, 2020-2033 (USD Billion)
10. Global Hangover Cure Products Market, By Region, 2020-2033 (USD Billion)
11. North America Hangover Cure Products Market, By Product, 2020-2033 (USD Billion)
12. North America Hangover Cure Products Market, By Distribution Channel, 2020-2033 (USD Billion)
13. U.S. Hangover Cure Products Market, By Product, 2020-2033 (USD Billion)
14. U.S. Hangover Cure Products Market, By Distribution Channel, 2020-2033 (USD Billion)
15. Canada Hangover Cure Products Market, By Product, 2020-2033 (USD Billion)
16. Canada Hangover Cure Products Market, By Distribution Channel, 2020-2033 (USD Billion)
17. Mexico Hangover Cure Products Market, By Product, 2020-2033 (USD Billion)
18. Mexico Hangover Cure Products Market, By Distribution Channel, 2020-2033 (USD Billion)
19. Europe Hangover Cure Products Market, By Product, 2020-2033 (USD Billion)
20. Europe Hangover Cure Products Market, By Distribution Channel, 2020-2033 (USD Billion)
21. Germany Hangover Cure Products Market, By Product, 2020-2033 (USD Billion)
22. Germany Hangover Cure Products Market, By Distribution Channel, 2020-2033 (USD Billion)
23. France Hangover Cure Products Market, By Product, 2020-2033 (USD Billion)
24. France Hangover Cure Products Market, By Distribution Channel, 2020-2033 (USD Billion)
25. U.K. Hangover Cure Products Market, By Product, 2020-2033 (USD Billion)
26. U.K. Hangover Cure Products Market, By Distribution Channel, 2020-2033 (USD Billion)
27. Italy Hangover Cure Products Market, By Product, 2020-2033 (USD Billion)
28. Italy Hangover Cure Products Market, By Distribution Channel, 2020-2033 (USD Billion)
29. Spain Hangover Cure Products Market, By Product, 2020-2033 (USD Billion)
30. Spain Hangover Cure Products Market, By Distribution Channel, 2020-2033 (USD Billion)
31. Asia Pacific Hangover Cure Products Market, By Product, 2020-2033 (USD Billion)
32. Asia Pacific Hangover Cure Products Market, By Distribution Channel, 2020-2033 (USD Billion)
33. Japan Hangover Cure Products Market, By Product, 2020-2033 (USD Billion)
34. Japan Hangover Cure Products Market, By Distribution Channel, 2020-2033 (USD Billion)
35. China Hangover Cure Products Market, By Product, 2020-2033 (USD Billion)
36. China Hangover Cure Products Market, By Distribution Channel, 2020-2033 (USD Billion)
37. India Hangover Cure Products Market, By Product, 2020-2033 (USD Billion)
38. India Hangover Cure Products Market, By Distribution Channel, 2020-2033 (USD Billion)
39. South America Hangover Cure Products Market, By Product, 2020-2033 (USD Billion)
40. South America Hangover Cure Products Market, By Distribution Channel, 2020-2033 (USD Billion)
41. Brazil Hangover Cure Products Market, By Product, 2020-2033 (USD Billion)
42. Brazil Hangover Cure Products Market, By Distribution Channel, 2020-2033 (USD Billion)
43. Middle East and Africa Hangover Cure Products Market, By Product, 2020-2033 (USD Billion)
44. Middle East and Africa Hangover Cure Products Market, By Distribution Channel, 2020-2033 (USD Billion)
45. UAE Hangover Cure Products Market, By Product, 2020-2033 (USD Billion)
46. UAE Hangover Cure Products Market, By Distribution Channel, 2020-2033 (USD Billion)
47. South Africa Hangover Cure Products Market, By Product, 2020-2033 (USD Billion)
48. South Africa Hangover Cure Products Market, By Distribution Channel, 2020-2033 (USD Billion)
List of Figures
1. Global Hangover Cure Products Market Segmentation
2. Hangover Cure Products Market: Research Methodology
3. Market Size Estimation Methodology: Bottom-Up Approach
4. Market Size Estimation Methodology: Top-Down Approach
5. Data Triangulation
6. Porter’s Five Forces Analysis
7. Value Chain Analysis
8. Global Hangover Cure Products Market Attractiveness Analysis by Product
9. Global Hangover Cure Products Market Attractiveness Analysis by Distribution Channel
10. Global Hangover Cure Products Market Attractiveness Analysis by Region
11. Global Hangover Cure Products Market: Dynamics
12. Global Hangover Cure Products Market Share by Product (2023 & 2033)
13. Global Hangover Cure Products Market Share by Distribution Channel (2023 & 2033)
14. Global Hangover Cure Products Market Share by Regions (2023 & 2033)
15. Global Hangover Cure Products Market Share by Company (2023)
This study forecasts revenue at global, regional, and country levels from 2020 to 2033. The Brainy Insights has segmented the global hangover cure products market based on below-mentioned segments:
Global Hangover Cure Products Market by Product:
Global Hangover Cure Products Market by Distribution Channel:
Global Hangover Cure Products Market by Region:
Research has its special purpose to undertake marketing efficiently. In this competitive scenario, businesses need information across all industry verticals; the information about customer wants, market demand, competition, industry trends, distribution channels etc. This information needs to be updated regularly because businesses operate in a dynamic environment. Our organization, The Brainy Insights incorporates scientific and systematic research procedures in order to get proper market insights and industry analysis for overall business success. The analysis consists of studying the market from a miniscule level wherein we implement statistical tools which helps us in examining the data with accuracy and precision.
Our research reports feature both; quantitative and qualitative aspects for any market. Qualitative information for any market research process are fundamental because they reveal the customer needs and wants, usage and consumption for any product/service related to a specific industry. This in turn aids the marketers/investors in knowing certain perceptions of the customers. Qualitative research can enlighten about the different product concepts and designs along with unique service offering that in turn, helps define marketing problems and generate opportunities. On the other hand, quantitative research engages with the data collection process through interviews, e-mail interactions, surveys and pilot studies. Quantitative aspects for the market research are useful to validate the hypotheses generated during qualitative research method, explore empirical patterns in the data with the help of statistical tools, and finally make the market estimations.
The Brainy Insights offers comprehensive research and analysis, based on a wide assortment of factual insights gained through interviews with CXOs and global experts and secondary data from reliable sources. Our analysts and industry specialist assume vital roles in building up statistical tools and analysis models, which are used to analyse the data and arrive at accurate insights with exceedingly informative research discoveries. The data provided by our organization have proven precious to a diverse range of companies, facilitating them to address issues such as determining which products/services are the most appealing, whether or not customers use the product in the manner anticipated, the purchasing intentions of the market and many others.
Our research methodology encompasses an idyllic combination of primary and secondary initiatives. Key phases involved in this process are listed below:

The phase involves the gathering and collecting of market data and its related information with the help of different sources & research procedures.

The data procurement stage involves in data gathering and collecting through various data sources.
This stage involves in extensive research. These data sources includes:
Purchased Database: Purchased databases play a crucial role in estimating the market sizes irrespective of the domain. Our purchased database includes:
Primary Research: The Brainy Insights interacts with leading companies and experts of the concerned domain to develop the analyst team’s market understanding and expertise. It improves and substantiates every single data presented in the market reports. Primary research mainly involves in telephonic interviews, E-mail interactions and face-to-face interviews with the raw material providers, manufacturers/producers, distributors, & independent consultants. The interviews that we conduct provides valuable data on market size and industry growth trends prevailing in the market. Our organization also conducts surveys with the various industry experts in order to gain overall insights of the industry/market. For instance, in healthcare industry we conduct surveys with the pharmacists, doctors, surgeons and nurses in order to gain insights and key information of a medical product/device/equipment which the customers are going to usage. Surveys are conducted in the form of questionnaire designed by our own analyst team. Surveys plays an important role in primary research because surveys helps us to identify the key target audiences of the market. Additionally, surveys helps to identify the key target audience engaged with the market. Our survey team conducts the survey by targeting the key audience, thus gaining insights from them. Based on the perspectives of the customers, this information is utilized to formulate market strategies. Moreover, market surveys helps us to understand the current competitive situation of the industry. To be precise, our survey process typically involve with the 360 analysis of the market. This analytical process begins by identifying the prospective customers for a product or service related to the market/industry to obtain data on how a product/service could fit into customers’ lives.

Secondary Research: The secondary data sources includes information published by the on-profit organizations such as World bank, WHO, company fillings, investor presentations, annual reports, national government documents, statistical databases, blogs, articles, white papers and others. From the annual report, we analyse a company’s revenue to understand the key segment and market share of that organization in a particular region. We analyse the company websites and adopt the product mapping technique which is important for deriving the segment revenue. In the product mapping method, we select and categorize the products offered by the companies catering to domain specific market, deduce the product revenue for each of the companies so as to get overall estimation of the market size. We also source data and analyses trends based on information received from supply side and demand side intermediaries in the value chain. The supply side denotes the data gathered from supplier, distributor, wholesaler and the demand side illustrates the data gathered from the end customers for respective market domain.

The supply side for a domain specific market is analysed by:
The demand side for the market is estimated through:
In-house Library: Apart from these third-party sources, we have our in-house library of qualitative and quantitative information. Our in-house database includes market data for various industry and domains. These data are updated on regular basis as per the changing market scenario. Our library includes, historic databases, internal audit reports and archives.
Sometimes there are instances where there is no metadata or raw data available for any domain specific market. For those cases, we use our expertise to forecast and estimate the market size in order to generate comprehensive data sets. Our analyst team adopt a robust research technique in order to produce the estimates:
Data Synthesis: This stage involves the analysis & mapping of all the information obtained from the previous step. It also involves in scrutinizing the data for any discrepancy observed while data gathering related to the market. The data is collected with consideration to the heterogeneity of sources. Robust scientific techniques are in place for synthesizing disparate data sets and provide the essential contextual information that can orient market strategies. The Brainy Insights has extensive experience in data synthesis where the data passes through various stages:


Market Deduction & Formulation: The final stage comprises of assigning data points at appropriate market spaces so as to deduce feasible conclusions. Analyst perspective & subject matter expert based holistic form of market sizing coupled with industry analysis also plays a crucial role in this stage.
This stage involves in finalization of the market size and numbers that we have collected from data integration step. With data interpolation, it is made sure that there is no gap in the market data. Successful trend analysis is done by our analysts using extrapolation techniques, which provide the best possible forecasts for the market.
Data Validation & Market Feedback: Validation is the most important step in the process. Validation & re-validation via an intricately designed process helps us finalize data-points to be used for final calculations.

The Brainy Insights interacts with leading companies and experts of the concerned domain to develop the analyst team’s market understanding and expertise. It improves and substantiates every single data presented in the market reports. The data validation interview and discussion panels are typically composed of the most experienced industry members. The participants include, however, are not limited to:
Moreover, we always validate our data and findings through primary respondents from all the major regions we are working on.


Free Customization
Fortune 500 Clients
Free Yearly Update On Purchase Of Multi/Corporate License
Companies Served Till Date