- +1-315-215-1633
- sales@thebrainyinsights.com

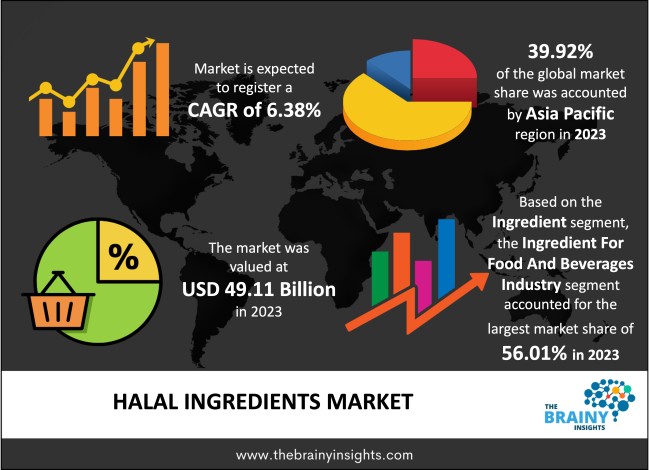
The global halal ingredients market was valued at USD 49.11 Billion in 2023 and grew at a CAGR of 6.38% from 2024 to 2033. The market is expected to reach USD 91.15 Billion by 2033. The growth of the halal ingredients market can be attributed to the rising demand for halal products among the Muslim population. Further, the increasing awareness of cruelty-free products will determine the market's growth during the forecast period.
The halal ingredient is defined as those permissible under Islamic law and must meet the following criteria. It must not contain or consist of any substance that is illegal or prohibited under Islamic law. It cannot be manufactured, processed, transported, or kept in any appliance or facility polluted with illegal or prohibited substances under Islamic law. The halal ingredients have Halal certification. Muslim communities are extremely careful about the products they use and how they handle food. The makers of halal items adhere to religious traditions and Sharia law. This indicates that no alcohol, blood, or animal flesh has been killed before being used in the products. These limitations guarantee that the items adhere to ethical norms and are cruelty-free.
Get an overview of this study by requesting a free sample
Increasing preference for Halal food products: The global halal business is steadily improving, particularly in the global halal food industry, which has raised the demand for halal ingredients around the world. The need for halal food is expected to rise as the world's population grows to two billion people in 57 countries, the majority of whom are Muslims. In today's global world, it's more crucial than ever for food service managers to understand the many dietary customs people follow. Religious dietary restrictions, such as kosher and halal, are becoming more popular as the United States' population grows and diversifies. Despite the limited availability of halal items, there is currently a great deal of client demand. Many manufacturers are entering the halal ingredient market to close the supply-demand imbalance.
High cost of transportation: Naturally, halal animals must be killed by Islamic customs to be used in halal food; these customs stipulate that a mentally sound Muslim must carry out the deed. Additionally, when being cooked, stored, and transported, the halal ingredients must not be combined or come into touch with haram elements, such as goods made from dogs or pigs. Due to this, handling halal ingredients requires extreme precision, which raises the cost. Furthermore, during the forecast period, high transportation costs would further impede the expansion of the halal ingredients market.
Increasing Muslim population: Muslims have the highest fertility rate in the world, with an average of 3.1 children per woman, much beyond the replacement level, which is normally required to sustain population stability. Overall, the number of Muslims has increased, as has their percentage of the global population. In 2010, 74% of Muslims lived in 49 nations, accounting for most of the population. According to predictions, the number of Muslims worldwide will increase by 35% by 2030 to reach 2.2 billion, up from the 2010 estimate. As a result, huge young Muslim populations are approaching childbearing years, implying that future population growth will be supported even as the TFR drops. The Muslim community and grocers will gain significantly from an increase in Halal goods for all ages on market shelves. This factor is leading to greater adoption of the halal ingredients market.
The regions analyzed for the market include North America, Europe, South America, Asia Pacific, the Middle East, and Africa. Asia Pacific emerged as the most significant halal ingredients market, with a 39.92% market revenue share in 2023.
Asia-Pacific region will account for the largest market share with revenue growth. The region has a high demand for halal Ingredients to meet the requirements of the growing Muslim population. Most Muslims live in the Asia Pacific region, in Pakistan, India, Bangladesh, and Indonesia. Many of these countries have outlaid strict regulations related to Halal products, and thus, the market is growing lucratively in the region.
Asia-Pacific region Halal Ingredients Market Share in 2023 - 39.92%
www.thebrainyinsights.com
Check the geographical analysis of this market by requesting a free sample
The ingredient segment is divided into ingredient for pharmaceutical industry, ingredient for cosmetics industry and ingredient for food and beverages industry. The ingredient for cosmetics industry segment further includes active ingredients, specialty additives and others. The ingredients for the food and beverages industry segment further include flavours, sweeteners, hydrocolloids, emulsifiers, preservatives, enzymes, and others. The ingredient for food and beverages industry segment dominated the market, with a share of around 56.01% in 2023. Food firms are concentrating on developing innovative halal ingredients and providing customers with a wide selection of halal goods. Due to the growing customer preference for ready-to-eat food products and novel, inventive tastes, flavouring ingredients are in high demand among all halal ingredients.
The application segment is divided into pharmaceuticals, cosmetics, and food and beverages. The food and beverages segment further includes bakery and confectionery products, meat and poultry products, convenience food products, beverages and others. The food and beverages segment dominated the market, with a share of around 49.21% in 2023. Strict regulations require halal food businesses to disclose all product ingredients on the label. The global halal food and beverages sector is one of the world's fastest-expanding consumer categories. People are becoming more aware of the advantages of eating halal food for their health.
| Attribute | Description |
|---|---|
| Market Size | Revenue (USD Billion) |
| Market size value in 2023 | USD 49.11 Billion |
| Market size value in 2033 | USD 91.15 Billion |
| CAGR (2024 to 2033) | 6.38% |
| Historical data | 2020-2022 |
| Base Year | 2023 |
| Forecast | 2024-2033 |
| Region | The regions analyzed for the market are Asia Pacific, Europe, South America, North America, and Middle East & Africa. Furthermore, the regions are further analyzed at the country level. |
| Segments | Ingredient and Application |
As per The Brainy Insights, the size of the halal ingredients market was valued 49.11 Billion in 2023 to USD 91.15 Billion by 2033.
Global halal ingredients market is growing at a CAGR of 6.38% during the forecast period 2024-2033.
Asia Pacific region emerged as the largest market for the halal ingredients.
The market's growth will be influenced by the growing consumption of halal food.
The cost of transportation can hamper the market growth.
The increasing Muslim population is providing huge opportunities to the market.
1. Introduction
1.1. Objectives of the Study
1.2. Market Definition
1.3. Research Scope
1.4. Currency
1.5. Key Target Audience
2. Research Methodology and Assumptions
3. Executive Summary
4. Premium Insights
4.1. Porter’s Five Forces Analysis
4.2. Value Chain Analysis
4.3. Top Investment Pockets
4.3.1. Market Attractiveness Analysis by Ingredient
4.3.2. Market Attractiveness Analysis by Application
4.3.3. Market Attractiveness Analysis by Region
4.4. Industry Trends
5. Market Dynamics
5.1. Market Evaluation
5.2. Drivers
5.2.1. Increasing consumption of halal food
5.3. Restraints
5.3.1. Cost of transportation
5.4. Opportunities
5.4.1. Increasing Muslim population
5.5. Challenges
5.5.1. Lack of uniform standards
6. Global Halal Ingredients Market Analysis and Forecast, By Ingredient
6.1. Segment Overview
6.2. Composites Ingredient for Pharmaceutical Industry
6.2.1. Ingredient for Cosmetics Industry
6.2.2. Active Ingredient
6.2.3. Specialty Additives
6.2.4. Others
6.3. Ingredient for Food and Beverages Industry
6.3.1. Flavours
6.3.2. Sweeteners
6.3.3. Hydrocolloids
6.3.4. Emulsifiers
6.3.5. Preservatives
6.3.6. Enzymes
6.3.7. Others
7. Global Halal Ingredients Market Analysis and Forecast, By Application
7.1. Segment Overview
7.2. Pharmaceutical
7.3. Cosmetics
7.4. Food and Beverages
8. Global Halal Ingredients Market Analysis and Forecast, By Regional Analysis
8.1. Segment Overview
8.2. North America
8.2.1. U.S.
8.2.2. Canada
8.2.3. Mexico
8.3. Europe
8.3.1. Germany
8.3.2. France
8.3.3. U.K.
8.3.4. Italy
8.3.5. Spain
8.4. Asia-Pacific
8.4.1. Japan
8.4.2. China
8.4.3. India
8.5. South America
8.5.1. Brazil
8.6. Middle East and Africa
8.6.1. UAE
8.6.2. South Africa
9. Global Halal Ingredients Market-Competitive Landscape
9.1. Overview
9.2. Market Share of Key Players in the Halal Ingredients Market
9.2.1. Global Company Market Share
9.2.2. North America Company Market Share
9.2.3. Europe Company Market Share
9.2.4. APAC Company Market Share
9.3. Competitive Situations and Trends
9.3.1. Product Launches and Developments
9.3.2. Partnerships, Collaborations, and Agreements
9.3.3. Mergers & Acquisitions
9.3.4. Expansions
10. Company Profiles
10.1. Halagel Group Of Companies
10.1.1. Business Overview
10.1.2. Company Snapshot
10.1.3. Company Market Share Analysis
10.1.4. Company Product Portfolio
10.1.5. Recent Developments
10.1.6. SWOT Analysis
10.2. Del Monte Phil’s., Inc.
10.2.1. Business Overview
10.2.2. Company Snapshot
10.2.3. Company Market Share Analysis
10.2.4. Company Product Portfolio
10.2.5. Recent Developments
10.2.6. SWOT Analysis
10.3. Croda International Plc
10.3.1. Business Overview
10.3.2. Company Snapshot
10.3.3. Company Market Share Analysis
10.3.4. Company Product Portfolio
10.3.5. Recent Developments
10.3.6. SWOT Analysis
10.4. Unilever
10.4.1. Business Overview
10.4.2. Company Snapshot
10.4.3. Company Market Share Analysis
10.4.4. Company Product Portfolio
10.4.5. Recent Developments
10.4.6. SWOT Analysis
10.5. Burger King Corporation
10.5.1. Business Overview
10.5.2. Company Snapshot
10.5.3. Company Market Share Analysis
10.5.4. Company Product Portfolio
10.5.5. Recent Developments
10.5.6. SWOT Analysis
10.6. L’Oreal
10.6.1. Business Overview
10.6.2. Company Snapshot
10.6.3. Company Market Share Analysis
10.6.4. Company Product Portfolio
10.6.5. Recent Developments
10.6.6. SWOT Analysis
10.7. MAKE-UP ART COSMETICS
10.7.1. Business Overview
10.7.2. Company Snapshot
10.7.3. Company Market Share Analysis
10.7.4. Company Product Portfolio
10.7.5. Recent Developments
10.7.6. SWOT Analysis
10.8. Amara Cosmetics
10.8.1. Business Overview
10.8.2. Company Snapshot
10.8.3. Company Market Share Analysis
10.8.4. Company Product Portfolio
10.8.5. Recent Developments
10.8.6. SWOT Analysis
10.9. Beiersdorf
10.9.1. Business Overview
10.9.2. Company Snapshot
10.9.3. Company Market Share Analysis
10.9.4. Company Product Portfolio
10.9.5. Recent Developments
10.9.6. SWOT Analysis
10.10. Kerry Group plc
10.10.1. Business Overview
10.10.2. Company Snapshot
10.10.3. Company Market Share Analysis
10.10.4. Company Product Portfolio
10.10.5. Recent Developments
10.10.6. SWOT Analysis
10.11. Shiseido Co., Ltd.
10.11.1. Business Overview
10.11.2. Company Snapshot
10.11.3. Company Market Share Analysis
10.11.4. Company Product Portfolio
10.11.5. Recent Developments
10.11.6. SWOT Analysis
10.12. Impossible Foods
10.12.1. Business Overview
10.12.2. Company Snapshot
10.12.3. Company Market Share Analysis
10.12.4. Company Product Portfolio
10.12.5. Recent Developments
10.12.6. SWOT Analysis
10.13. Symrise AG
10.13.1. Business Overview
10.13.2. Company Snapshot
10.13.3. Company Market Share Analysis
10.13.4. Company Product Portfolio
10.13.5. Recent Developments
10.13.6. SWOT Analysis
10.14. KoninklijkeDsm N.V
10.14.1. Business Overview
10.14.2. Company Snapshot
10.14.3. Company Market Share Analysis
10.14.4. Company Product Portfolio
10.14.5. Recent Developments
10.14.6. SWOT Analysis
10.15. The Archer Daniels Midland
10.15.1. Business Overview
10.15.2. Company Snapshot
10.15.3. Company Market Share Analysis
10.15.4. Company Product Portfolio
10.15.5. Recent Developments
10.15.6. SWOT Analysis
List of Table
1. Global Halal Ingredients Market, By Ingredient, 2020-2033 (USD Billion)
2. Global Ingredient for Pharmaceutical Industry, Halal Ingredients Market, By Region, 2020-2033 (USD Billion)
3. Global Ingredient for Cosmetics Industry, Halal Ingredients Market, By Region, 2020-2033 (USD Billion)
4. Global Ingredient for Food and Beverages Industry, Halal Ingredients Market, By Region, 2020-2033 (USD Billion)
5. Global Halal Ingredients Market, By Application, 2020-2033 (USD Billion)
6. Global Pharmaceutical, Halal Ingredients Market, By Region, 2020-2033 (USD Billion)
7. Global Cosmetics, Halal Ingredients Market, By Region, 2020-2033 (USD Billion)
8. Global Food and Beverages, Halal Ingredients Market, By Region, 2020-2033 (USD Billion)
9. Global Halal Ingredients Market, By Region, 2020-2033 (USD Billion)
10. North America Halal Ingredients Market, By Ingredient, 2020-2033 (USD Billion)
11. North America Halal Ingredients Market, By Application, 2020-2033 (USD Billion)
12. U.S. Halal Ingredients Market, By Ingredient, 2020-2033 (USD Billion)
13. U.S. Halal Ingredients Market, By Application, 2020-2033 (USD Billion)
14. Canada Halal Ingredients Market, By Ingredient, 2020-2033 (USD Billion)
15. Canada Halal Ingredients Market, By Application, 2020-2033 (USD Billion)
16. Mexico Halal Ingredients Market, By Ingredient, 2020-2033 (USD Billion)
17. Mexico Halal Ingredients Market, By Application, 2020-2033 (USD Billion)
18. Europe Halal Ingredients Market, By Ingredient, 2020-2033 (USD Billion)
19. Europe Halal Ingredients Market, By Application, 2020-2033 (USD Billion)
20. Germany Halal Ingredients Market, By Ingredient, 2020-2033 (USD Billion)
21. Germany Halal Ingredients Market, By Application, 2020-2033 (USD Billion)
22. France Halal Ingredients Market, By Ingredient, 2020-2033 (USD Billion)
23. France Halal Ingredients Market, By Application, 2020-2033 (USD Billion)
24. U.K. Halal Ingredients Market, By Ingredient, 2020-2033 (USD Billion)
25. U.K. Halal Ingredients Market, By Application, 2020-2033 (USD Billion)
26. Italy Halal Ingredients Market, By Ingredient, 2020-2033 (USD Billion)
27. Italy Halal Ingredients Market, By Application, 2020-2033 (USD Billion)
28. Spain Halal Ingredients Market, By Ingredient, 2020-2033 (USD Billion)
29. Spain Halal Ingredients Market, By Application, 2020-2033 (USD Billion)
30. Asia Pacific Halal Ingredients Market, By Ingredient, 2020-2033 (USD Billion)
31. Asia Pacific Halal Ingredients Market, By Application, 2020-2033 (USD Billion)
32. Japan Halal Ingredients Market, By Ingredient, 2020-2033 (USD Billion)
33. Japan Halal Ingredients Market, By Application, 2020-2033 (USD Billion)
34. China Halal Ingredients Market, By Ingredient, 2020-2033 (USD Billion)
35. China Halal Ingredients Market, By Application, 2020-2033 (USD Billion)
36. India Halal Ingredients Market, By Ingredient, 2020-2033 (USD Billion)
37. India Halal Ingredients Market, By Application, 2020-2033 (USD Billion)
38. South America Halal Ingredients Market, By Ingredient, 2020-2033 (USD Billion)
39. South America Halal Ingredients Market, By Application, 2020-2033 (USD Billion)
40. Brazil Halal Ingredients Market, By Ingredient, 2020-2033 (USD Billion)
41. Brazil Halal Ingredients Market, By Application, 2020-2033 (USD Billion)
42. Middle East and Africa Halal Ingredients Market, By Ingredient, 2020-2033 (USD Billion)
43. Middle East and Africa Halal Ingredients Market, By Application, 2020-2033 (USD Billion)
44. UAE Halal Ingredients Market, By Ingredient, 2020-2033 (USD Billion)
45. UAE Halal Ingredients Market, By Application, 2020-2033 (USD Billion)
46. South Africa Halal Ingredients Market, By Ingredient, 2020-2033 (USD Billion)
47. South Africa Halal Ingredients Market, By Application, 2020-2033 (USD Billion)
List of Figures
1. Global Halal Ingredients Market Segmentation
2. Halal Ingredients Market: Research Methodology
3. Market Size Estimation Methodology: Bottom-Up Approach
4. Market Size Estimation Methodology: Top-Down Approach
5. Data Triangulation
6. Porter’s Five Forces Analysis
7. Value Chain Analysis
8. Global Halal Ingredients Market Attractiveness Analysis by Ingredient
9. Global Halal Ingredients Market Attractiveness Analysis by Application
10. Global Halal Ingredients Market Attractiveness Analysis by Region
11. Global Halal Ingredients Market: Dynamics
12. Global Halal Ingredients Market Share by Ingredient (2023 & 2033)
13. Global Halal Ingredients Market Share by Application (2023 & 2033)
14. Global Halal Ingredients Market Share by Regions (2023 & 2033)
15. Global Halal Ingredients Market Share by Company (2023)
This study forecasts revenue at global, regional, and country levels from 2020 to 2033. The Brainy Insights has segmented the global halal ingredients market based on below mentioned segments:
Global Halal Ingredients Market by Ingredient:
Global Halal Ingredients Market by Application:
Global Halal Ingredients Market by Region:
Research has its special purpose to undertake marketing efficiently. In this competitive scenario, businesses need information across all industry verticals; the information about customer wants, market demand, competition, industry trends, distribution channels etc. This information needs to be updated regularly because businesses operate in a dynamic environment. Our organization, The Brainy Insights incorporates scientific and systematic research procedures in order to get proper market insights and industry analysis for overall business success. The analysis consists of studying the market from a miniscule level wherein we implement statistical tools which helps us in examining the data with accuracy and precision.
Our research reports feature both; quantitative and qualitative aspects for any market. Qualitative information for any market research process are fundamental because they reveal the customer needs and wants, usage and consumption for any product/service related to a specific industry. This in turn aids the marketers/investors in knowing certain perceptions of the customers. Qualitative research can enlighten about the different product concepts and designs along with unique service offering that in turn, helps define marketing problems and generate opportunities. On the other hand, quantitative research engages with the data collection process through interviews, e-mail interactions, surveys and pilot studies. Quantitative aspects for the market research are useful to validate the hypotheses generated during qualitative research method, explore empirical patterns in the data with the help of statistical tools, and finally make the market estimations.
The Brainy Insights offers comprehensive research and analysis, based on a wide assortment of factual insights gained through interviews with CXOs and global experts and secondary data from reliable sources. Our analysts and industry specialist assume vital roles in building up statistical tools and analysis models, which are used to analyse the data and arrive at accurate insights with exceedingly informative research discoveries. The data provided by our organization have proven precious to a diverse range of companies, facilitating them to address issues such as determining which products/services are the most appealing, whether or not customers use the product in the manner anticipated, the purchasing intentions of the market and many others.
Our research methodology encompasses an idyllic combination of primary and secondary initiatives. Key phases involved in this process are listed below:

The phase involves the gathering and collecting of market data and its related information with the help of different sources & research procedures.

The data procurement stage involves in data gathering and collecting through various data sources.
This stage involves in extensive research. These data sources includes:
Purchased Database: Purchased databases play a crucial role in estimating the market sizes irrespective of the domain. Our purchased database includes:
Primary Research: The Brainy Insights interacts with leading companies and experts of the concerned domain to develop the analyst team’s market understanding and expertise. It improves and substantiates every single data presented in the market reports. Primary research mainly involves in telephonic interviews, E-mail interactions and face-to-face interviews with the raw material providers, manufacturers/producers, distributors, & independent consultants. The interviews that we conduct provides valuable data on market size and industry growth trends prevailing in the market. Our organization also conducts surveys with the various industry experts in order to gain overall insights of the industry/market. For instance, in healthcare industry we conduct surveys with the pharmacists, doctors, surgeons and nurses in order to gain insights and key information of a medical product/device/equipment which the customers are going to usage. Surveys are conducted in the form of questionnaire designed by our own analyst team. Surveys plays an important role in primary research because surveys helps us to identify the key target audiences of the market. Additionally, surveys helps to identify the key target audience engaged with the market. Our survey team conducts the survey by targeting the key audience, thus gaining insights from them. Based on the perspectives of the customers, this information is utilized to formulate market strategies. Moreover, market surveys helps us to understand the current competitive situation of the industry. To be precise, our survey process typically involve with the 360 analysis of the market. This analytical process begins by identifying the prospective customers for a product or service related to the market/industry to obtain data on how a product/service could fit into customers’ lives.

Secondary Research: The secondary data sources includes information published by the on-profit organizations such as World bank, WHO, company fillings, investor presentations, annual reports, national government documents, statistical databases, blogs, articles, white papers and others. From the annual report, we analyse a company’s revenue to understand the key segment and market share of that organization in a particular region. We analyse the company websites and adopt the product mapping technique which is important for deriving the segment revenue. In the product mapping method, we select and categorize the products offered by the companies catering to domain specific market, deduce the product revenue for each of the companies so as to get overall estimation of the market size. We also source data and analyses trends based on information received from supply side and demand side intermediaries in the value chain. The supply side denotes the data gathered from supplier, distributor, wholesaler and the demand side illustrates the data gathered from the end customers for respective market domain.

The supply side for a domain specific market is analysed by:
The demand side for the market is estimated through:
In-house Library: Apart from these third-party sources, we have our in-house library of qualitative and quantitative information. Our in-house database includes market data for various industry and domains. These data are updated on regular basis as per the changing market scenario. Our library includes, historic databases, internal audit reports and archives.
Sometimes there are instances where there is no metadata or raw data available for any domain specific market. For those cases, we use our expertise to forecast and estimate the market size in order to generate comprehensive data sets. Our analyst team adopt a robust research technique in order to produce the estimates:
Data Synthesis: This stage involves the analysis & mapping of all the information obtained from the previous step. It also involves in scrutinizing the data for any discrepancy observed while data gathering related to the market. The data is collected with consideration to the heterogeneity of sources. Robust scientific techniques are in place for synthesizing disparate data sets and provide the essential contextual information that can orient market strategies. The Brainy Insights has extensive experience in data synthesis where the data passes through various stages:


Market Deduction & Formulation: The final stage comprises of assigning data points at appropriate market spaces so as to deduce feasible conclusions. Analyst perspective & subject matter expert based holistic form of market sizing coupled with industry analysis also plays a crucial role in this stage.
This stage involves in finalization of the market size and numbers that we have collected from data integration step. With data interpolation, it is made sure that there is no gap in the market data. Successful trend analysis is done by our analysts using extrapolation techniques, which provide the best possible forecasts for the market.
Data Validation & Market Feedback: Validation is the most important step in the process. Validation & re-validation via an intricately designed process helps us finalize data-points to be used for final calculations.

The Brainy Insights interacts with leading companies and experts of the concerned domain to develop the analyst team’s market understanding and expertise. It improves and substantiates every single data presented in the market reports. The data validation interview and discussion panels are typically composed of the most experienced industry members. The participants include, however, are not limited to:
Moreover, we always validate our data and findings through primary respondents from all the major regions we are working on.


Free Customization
Fortune 500 Clients
Free Yearly Update On Purchase Of Multi/Corporate License
Companies Served Till Date